8 Oct 2021
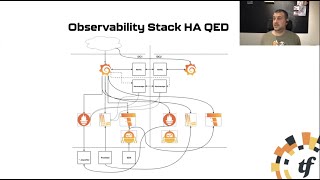
An introduction to Observability and how to setup a highly available monitoring platform, across multiple data centers. During this talk we investigate how to config a monitoring setup across 2 DCs using Prometheus, Loki, Tempo, Alertmanager and Grafana.
Bram Vogelaar spent the first part of his career as a Molecular Biologist, he then moved on to supporting his peers by building tools and platforms for them with a lot of Open Source technologies. He now works as a DevOps Cloud Engineer at The Factory.
Bram Vogelaar spent the first part of his career as a Molecular Biologist, he then moved on to supporting his peers by building tools and platforms for them with a lot of Open Source technologies. He now works as a DevOps Cloud Engineer at The Factory.
- 2 participants
- 21 minutes
8 Oct 2021
We learned from a visually impaired astronomer that it was possible to use sonification to understand astronomical spectra. So during a hackathon at Grafana Labs we decided to turn time series into audio, and add sound to our alerting systems too.
Kostas Pelelis is a Software Engineer at Grafana Labs living in Greece.
Kostas Pelelis is a Software Engineer at Grafana Labs living in Greece.
- 3 participants
- 16 minutes
8 Oct 2021
For more information on Grafana's accessibility visit: https://grafana.com/accessibility/
We want to make Grafana accessible to everyone! In this talk, Alexa will share how Grafana recently introduced Pa11y CI into the Grafana Continuous Integration pipeline. The library supports our developers and contributors to highlight a11y issues. And more importantly, it acts as a gatekeeper, stopping new A11y issues from making it into the project.
You will additionally hear about the alternatives that were considered and their challenges. This talk will have everything!
Alexandra (Alexa )Vargas is a Software Engineer at Grafana Labs living in the Netherlands.
- 2 participants
- 23 minutes

8 Oct 2021
k6 is one of the newest additions to the Grafana Labs family, but what exactly is it, and what does it have to do with Grafana? In this session, Nicole van der Hoeven will demonstrate how to use k6, how to integrate it with Grafana, and why k6 and Grafana are better together.
Nicole van der Hoeven is a Developer Advocate at k6, living in the Netherlands.
Get started at https://k6.io/docs/cloud/integrations/grafana-plugin/
Nicole van der Hoeven is a Developer Advocate at k6, living in the Netherlands.
Get started at https://k6.io/docs/cloud/integrations/grafana-plugin/
- 2 participants
- 25 minutes
8 Oct 2021
When using Thanos on top of Prometheus we can leverage this for a unified way in a single data source to query all our data across multiple clusters, servers and Prometheis.
Wiard van Rij is an Engineer at Fullstaq helping people, teams, and organizations with various cloud-native challenges with a strong focus on Kubernetes and Observability. Wiard is a Thanos team member, open source enthusiast and has extra fun with security and hacking.
Wiard van Rij is an Engineer at Fullstaq helping people, teams, and organizations with various cloud-native challenges with a strong focus on Kubernetes and Observability. Wiard is a Thanos team member, open source enthusiast and has extra fun with security and hacking.
- 2 participants
- 22 minutes