15 Apr 2022
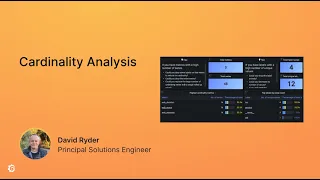
Cardinality Analysis of metrics is an enabler to reducing costs and focusing observability on the necessary metrics to identify and investigate where issues are occurring in your services. Grafana has added cardinality management dashboards to Grafana Cloud and Grafana Enterprise Metrics to make this an easy and fast process. In this introductory session, we will provide an overview of the Grafana Cardinality features and offer a set of discovery questions to help you with the process.
Presented by David Ryder, Principal Solutions Engineer at Grafana Labs
Learn more at: https://grafana.com/go/meetup/grafana-meetup-west-coast-rockies-april-2022/
Presented by David Ryder, Principal Solutions Engineer at Grafana Labs
Learn more at: https://grafana.com/go/meetup/grafana-meetup-west-coast-rockies-april-2022/
- 1 participant
- 8 minutes
15 Apr 2022
As organizations have moved from monolithic to microservice-based architectures, there has been an explosion in the volume of logs generated. Most logging solutions create a full index of the logs and use SSD drives, which results in costly compute and storage resources for logs that are mostly write once, read never. We created Grafana Loki to solve these problems. Loki only indexes the metadata of the log lines, relies on inexpensive object storage, and is architected for scalability. In addition, Loki takes advantage of parallelism and sharding that results in fast query performance. In this session, we will discuss the benefits of using Loki as a backend logging solution.
See more at: https://grafana.com/go/meetup/grafana-meetup-west-coast-rockies-april-2022/
Presented by Shawn Madden, Principal Solutions Engineer at Grafana Labs
See more at: https://grafana.com/go/meetup/grafana-meetup-west-coast-rockies-april-2022/
Presented by Shawn Madden, Principal Solutions Engineer at Grafana Labs
- 1 participant
- 15 minutes
14 Apr 2022
It’s like an obby unto itself: With roughly 100 million global active users, how does an observability team monitor operations and troubleshoot problems that pop up across more than 10,000 servers? In this session, you’ll get an inside look at how the Roblox team evolved their observability platform to combine a multitude of data sources, from low-level hardware health to high-level performance metrics. Grafana Agent plays a key role by replacing many special-purpose pipelines with a single, easy-to-manage tool. Roblox’s observability team has met growing demand to provide actionable insights to hundreds of engineers, covering dozens of data sources and thousands of Grafana dashboards, which all help keep its infrastructure running and ready for play.
Talk given by Dan Maas, Technical Director at Roblox
For more information, visit: https://grafana.com/go/meetup/grafana-meetup-west-coast-rockies-april-2022/
Talk given by Dan Maas, Technical Director at Roblox
For more information, visit: https://grafana.com/go/meetup/grafana-meetup-west-coast-rockies-april-2022/
- 1 participant
- 15 minutes