23 Mar 2019
Flux is InfluxData’s new functional data scripting language designed for querying, analyzing, and interacting with data.
- 1 participant
- 18 minutes

21 Mar 2019
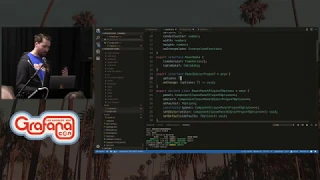
Jacob Lisi takes a deep dive into writing queries for the new Flux datasource at GrafanaCon LA.
Note: Due to a technical glitch a portion of the demo was re-recorded after the event. The queries are the same, however, some of the values on the graphs differ.
Note: Due to a technical glitch a portion of the demo was re-recorded after the event. The queries are the same, however, some of the values on the graphs differ.
- 6 participants
- 42 minutes

20 Mar 2019
Paul Dix, CTO and co-founder of InfluxData gives an overview and demo of the new InfluxDB 2.0 at GrafanaCon LA 2019.
- 1 participant
- 24 minutes

18 Mar 2019
A new breed of open-source building blocks is emerging — and is bringing Internet-scale best practices to the industrial IoT space. These building blocks implement open, standards-compliant communications protocols, allowing devices and data streams to be connected in a secure, flexible and scalable way. Grafana — given its time-series focus, and flexible/extensible design — is the natural front-end for this.
- 1 participant
- 15 minutes

18 Mar 2019
In this talk from the IoT track sponsored by InfluxData, David discusses how to use InfluxData’s new functional data scripting language Flux to track data for your IoT sensors and smart devices. He also discusses the concept of a "digital twin" - A digital copy of a physical system to perform real-time optimization
- 1 participant
- 21 minutes
18 Mar 2019
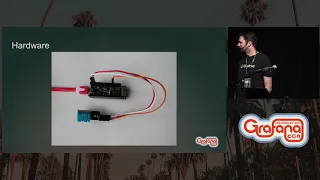
In this hands-on workshop, Dan Cech shows you how to collect data from an ESP32 sensor and visualize it in Grafana.
- 6 participants
- 1:26 hours
14 Mar 2019
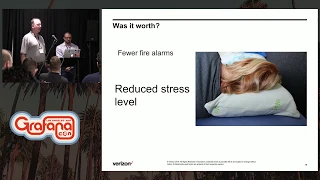
Join the automation and tools team within Verizon’s Global Technology Solutions organization for highlights on Grafana implementation in an enterprise environment. In this presentation we will quickly explain how the combination of Grafana, MySQL, and new technical innovations simplified analytics and automated development efforts.
- 4 participants
- 28 minutes
14 Mar 2019
While Grafana is super popular tool for visualizing monitoring data, it can go well beyond that.
In this presentation we will show how you can visualize virtually any business data in beautiful Grafana dashboard as well as offer some tips how you can go beyond MySQL if you’re looking for high performance interactive dashboards.
In this presentation we will show how you can visualize virtually any business data in beautiful Grafana dashboard as well as offer some tips how you can go beyond MySQL if you’re looking for high performance interactive dashboards.
- 2 participants
- 36 minutes

14 Mar 2019
This talk is delivered by TimescaleDB, who contributed the PostgreSQL query builder. It covers the rationale for why we decided to contribute these new functionalities, offers an overview of the new features, and provides insight into the real-world examples of how users are leveraging Grafana and SQL to power analytics and visualizations across their organizations.
- 2 participants
- 29 minutes

14 Mar 2019
Learn how to start developing new features for Grafana and contribute to making the project better.
- 4 participants
- 24 minutes

14 Mar 2019
Learn more about some of the popular and newest Grafana plugins and how you can start using them today.
- 1 participant
- 17 minutes

14 Mar 2019
Learn more about some of the popular and newest Grafana plugins and how you can start using them today.
- 1 participant
- 7 minutes
14 Mar 2019
Learn how easy it is to create your own Grafana data sources & panels.
- Learn about the new React panel support and how to write panels in React.
- Learn how to create your own data source.
- What is the Simple JSON data source?
- Tips & best practices of plugin development.
- Learn about the new React panel support and how to write panels in React.
- Learn how to create your own data source.
- What is the Simple JSON data source?
- Tips & best practices of plugin development.
- 4 participants
- 34 minutes
12 Mar 2019
Take away some plans and starter code for how to use Grafana at home for whimsical and educational purposes. Inviting family to do these projects with us is a great way to help them understand what we do at work all day! But the benefits extend far beyond keeping a child entertained.
We’ll conclude with some thoughts about how we can take these lessons and apply them towards making our own workplaces better. We can all strive to “Explain it like I’m five” to each other more often – not to be patronizing, but to encourage a culture of tinkering and playfulness, without the fear of breaking things.
We’ll conclude with some thoughts about how we can take these lessons and apply them towards making our own workplaces better. We can all strive to “Explain it like I’m five” to each other more often – not to be patronizing, but to encourage a culture of tinkering and playfulness, without the fear of breaking things.
- 4 participants
- 33 minutes
12 Mar 2019
Learn about Hastic - a hackable tool for making pattern detection and predictions for your time series data, and explore Grafana plugins to create visualizations and custom analytics from new data sources.
- 1 participant
- 8 minutes

12 Mar 2019
This talk focuses on the journey that eBay took in rethinking how they do monitoring with the help of Grafana and the lessons they learned along the way.
- 1 participant
- 8 minutes

12 Mar 2019
Troubleshoot slow graphs, and find out what to do if your metrics aren’t loading. Learn how to optimize your queries, pitfalls to avoid, and get the most out of your dashboards.
- 1 participant
- 27 minutes

12 Mar 2019
Carl Bergquist will walk you through the dashboard provisioning functionality, as well as how to set up folders, teams and set permissions. He’ll also discuss how to run Grafana in a HA environment.
- 1 participant
- 32 minutes

12 Mar 2019
This talk will focus on how the telemetry team delivers value for Bloomberg’s 5,500+ engineers around the globe, with as little effort as possible required by application or SRE teams.
Learn about enhancements Bloomberg made to open source software, as well as successes (and failures) in adopting various performance metrics.
Learn about enhancements Bloomberg made to open source software, as well as successes (and failures) in adopting various performance metrics.
- 3 participants
- 24 minutes
12 Mar 2019
The role of IoT to produce tangible impacts on the ground in Africa. How we used Grafana and InfluxDB to be able to remotely monitor our mini-grids in Tanzania. This reduced the number of long and cumbersome site trips and enabled us to guarantee a 24/7 power supply.
See how IoT devices truly increased the standard of living in the community including smart water pump operation and the supply of power for a welding business.
See how IoT devices truly increased the standard of living in the community including smart water pump operation and the supply of power for a welding business.
- 1 participant
- 10 minutes

12 Mar 2019
Grafana, with its huge amount of data sources and plugins, has all the capabilities one needs to create accurate graphs. Although creating dashboards is easy, interpreting each panel is hard if it’s not correctly visualised. Misinterpretation is one of the most common causes of wrong conclusions that make us hunt ghosts during debugging sessions. There are many common pitfalls which we can avoid if we follow some rules.
Learn about some of the most common mistakes in visualizations and how to avoid them.
Learn about some of the most common mistakes in visualizations and how to avoid them.
- 1 participant
- 10 minutes
12 Mar 2019
At SevOne we collect high resolution network telemetry data where live visualization of that data is crucial for operations. Using a refresh rate on a large report fetches duplicate data unnecessarily, slowing the user experience. We decided to investigate adding streaming to Grafana, and found it was possible without any modifications to the Grafana server.
- 1 participant
- 7 minutes
12 Mar 2019
Kubernetes generates a wealth of metrics from several places. Some explicitly within the Kubernetes API server, the Kublet, and cAdvisor or implicitly by observing events such as the kube-state-metrics project. A subset of these metrics are used within Kubernetes itself to make scheduling decisions, however, other metrics can be used to determine the overall health of the system or for capacity planning purposes.
In this session you will learn about:
- Node level metrics, as exposed from the node_exporter
- Kublet metrics
- API server metrics
- etcd metrics
- cAdvisor metrics
- Metrics exposed from kube-state-metrics
Learn about how these metrics are calculated, their use within Kubernetes scheduling decisions and application in monitoring, alerting and capacity planning.
- 2 participants
- 21 minutes
12 Mar 2019
Have you thought about running Grafana exposed to everyone on the internet? Probably not!
At GitLab we value transparency, so this is exactly what we do. Every metric we use for running gitlab.com is visible to the public.
This talk will give an overview of how we operate Grafana, Prometheus, Trickster, and Thanos to create both internal and external dashboards.
At GitLab we value transparency, so this is exactly what we do. Every metric we use for running gitlab.com is visible to the public.
This talk will give an overview of how we operate Grafana, Prometheus, Trickster, and Thanos to create both internal and external dashboards.
- 2 participants
- 18 minutes
12 Mar 2019
Daniel Lee walks through many of the templating use cases, options and examples to help you become a Grafana master.
- 2 participants
- 25 minutes
12 Mar 2019
Bartek Plotka discusses the Thanos project and running Prometheus at scale at GrafanaCon LA 2019.
- 2 participants
- 31 minutes

12 Mar 2019
Goutham Veeramachaneni, a Prometheus project maintainer, will give you an inside look at the latest developments of Prometheus and what’s on the horizon for the project.
- 6 participants
- 39 minutes
12 Mar 2019
Learn about managing Grafana dashboards like code: checking them into source-code repository and deploying them to every Kubernetes cluster via an automated build system. This ensures the Grafana dashboards are consistent across all Kubernetes clusters, making for a more productive and reliable experience.
- 2 participants
- 27 minutes
12 Mar 2019
In this session, we will inject some chaos into a Spring Boot application. We will collect all the metrics from the application and the experiments in Prometheus. We will create Grafana dashboards to visualize the results and see how the application is performing in the real world.
- 1 participant
- 14 minutes
12 Mar 2019
Get an overview of how Amgen has implemented on-call data to be viewable within Grafana so that anyone looking up an app that has some alerts associated with it can also know who the current engineer on-call and what their information is in case anyone needs to proactively reach out to them regarding degraded user experience, before any alerts are triggered.
- 1 participant
- 10 minutes

11 Mar 2019
Learn about the newest features of Grafana v6.0 including Grafana Loki, Prometheus-inspired, open source logging in Grafana, the new explore workflow, new cloud data sources and more!
- 2 participants
- 41 minutes

11 Mar 2019
James Wetherall how Trapeze is leveraging Grafana as a key platform for visualizing and communicating a real-time picture and how this is being utilized within Emergency Service organizations.
- 2 participants
- 19 minutes

11 Mar 2019
Daniel Lee discusses native support for the major cloud platforms, and highlights popular plugins from the Grafana community.
Brendan Burns, Microsoft Distinguished Engineer & Kubernetes co-founder discusses Microsoft Azure support
Google Project Manager Joy Wang discusses the new Google Stackdriver support in Grafana
Mies Hernandez van Leuffen introduces the Oracle Cloud Infrastructure data source.
Brendan Burns, Microsoft Distinguished Engineer & Kubernetes co-founder discusses Microsoft Azure support
Google Project Manager Joy Wang discusses the new Google Stackdriver support in Grafana
Mies Hernandez van Leuffen introduces the Oracle Cloud Infrastructure data source.
- 5 participants
- 33 minutes
11 Mar 2019
This talk covers experience and thoughts about how to approach the monitoring and management of cloud-native systems. It will draw both from observations of the opportunities provided by systems like Kubernetes as well as from practical hands-on experience from building real monitoring systems. With luck it will provide both experiences from the past, and inspirations for the future.
- 2 participants
- 32 minutes

11 Mar 2019
How does a company built on open source technology build and defend their bottom line? This panel discussion dives into the new OSS licensing trends and spans the idealogical spectrum on what's best for both companies and communities
- 7 participants
- 41 minutes
11 Mar 2019
Nikki Attea talks about one of the endless permutations of metrics software you can pair with Sensu. She'll show you how to collect data using Sensu check output metric extraction, transform that data with a Sensu InfluxDB Handler, store the data in an InfluxDB time series database and visualize that data on a Grafana dashboard
- 3 participants
- 12 minutes

11 Mar 2019
Grafana Labs co-founder and CEO Raj Dutt recaps what the company has been up to since the last GrafanaCon including a recent fund raise, how Grafana Labs drives revenue, the introduction of Loki, a post-geographic, remote-first approach to hiring the best people, and where Grafana Labs is headed.
- 2 participants
- 19 minutes

11 Mar 2019
Grafana 6.0 adds a new way to explore ad-hoc queries and data. You can now view both metric and log data in Grafana.
Tom Wilkie will discuss the motivation behind Loki, Grafana Labs' latest Prometheus inspired, log aggregation tool, its design and architecture, and what the future holds.
David Kaltschmidt will walk through the new interface of the explore workflow and show you how to get started using it.
Tom Wilkie will discuss the motivation behind Loki, Grafana Labs' latest Prometheus inspired, log aggregation tool, its design and architecture, and what the future holds.
David Kaltschmidt will walk through the new interface of the explore workflow and show you how to get started using it.
- 3 participants
- 51 minutes

11 Mar 2019
Wenting Gong showcases Grafana’s immense usage at Tinder, and how they approach monitoring at scale
- 2 participants
- 21 minutes
11 Mar 2019
Applications are complex systems. Their many moving parts, component and dependency services may span any number of infrastructure technologies and platforms from bare metal to serverless.
Sensu co-founder and CTO Sean Porter teaches you how to overcome many of these challenges and effectively monitor these ever-changing heterogeneous environments.
Sensu co-founder and CTO Sean Porter teaches you how to overcome many of these challenges and effectively monitor these ever-changing heterogeneous environments.
- 1 participant
- 8 minutes

11 Mar 2019
Melanie Postma talks about solving problems as they occur, understanding the impact of deploys on your infrastructure, reducing MTTM/MTTR and creating an environment of continuous improvement.
- 1 participant
- 6 minutes
11 Mar 2019
The new Flux (formerly IFQL) super-charges queries both for analytics and data science. Get an overview of the language features as well as the moving parts for a working deployment. Grafana shares Flux’s passion for analytics and data science. For that reason, they are very excited to showcase the new Flux support within Grafana, and a couple of common analytics use cases to get the most out of your data.
- 2 participants
- 25 minutes

25 Feb 2019
Matt Toback kicks off GrafanaCon LA Feb 25, 2019. He discusses the structure for both days of talks and workshops, and unveils the latest in Grafana Labs' popular poster series.
- 1 participant
- 6 minutes
