►
From YouTube: IETF109-MAPRG-20201116-0730
Description
MAPRG meeting session at IETF109
2020/11/16 0730
https://datatracker.ietf.org/meeting/109/proceedings/
A
A
A
However,
I
will
quickly
run
through
my
sets
of
the
slides
and
then,
if
possible.
I
would
like
to
ask
the
first
presenter
emily
to
maybe
share
the
slides
on
your
own,
or
at
least
try
that
and
then
I
can
try
to
fix
that
where
I
will
listen
to
that
presentation,
so
that
would
be
good
welcome
to
itf
109.
A
This
is
the
note
well
part
about
the
intellectual
property
rights
similar
as
the
ietf.
The
irtf
has
adopted
rules
about
participation
in
intellectual
property
rights,
and
you
should
study
those
rcs
which
are
linked
here
on
the
slide.
If
you
haven't
seen
this
before
in
order
to
know
what
you
get
yourself
and
when
you're
participating
here
on
the
mic
or
in
any
way
in
the
java
or
anyway,
we
also
have
in
the
itf
a
couple
of
policies
about
privacy
and
code
of
conduct.
A
So
if
you
want
to
participate
here
and
you're
not
aware
of
these
rscs,
please
also
have
a
look
at
them
and
then
the
next
slide
is
quickly
giving
you
a
reminder
or
some
understanding
that
the
irtf
is
actually
not
the
same
as
the
ietf,
what
the
difference
are
and
how
to
how
to
how
these
two
organizations
work
together
or
interwove
and
there's
another
rc.
You
can
study
if
you
want
to-
and
this
is
the
usual
slide,
which
is
more
useful
if
you
actually
go
to
the
material,
so
you
can.
A
A
So
we
have
this
very
quick
overview
here,
because
we
have
a
packed
agenda.
We
only
requested
one
hour
slot
because
it's
an
online
meeting
and
some
people
are
not
the
perfect
time
zone.
So
we
try
to
keep
this
a
little
bit
short
but
actually
kind
of.
Fortunately,
unfortunately,
however,
you
want
to
take
it.
A
So,
if
you
want
to
know
more,
you
can
watch
them,
or
maybe
you
have
watched
them
in
advance
already,
because
you're
prepared
and
and
you
can
read
the
papers,
all
the
links
for
the
papers
and
the
videos
are
in
the
agenda.
So
if
you
look
up
in
the
data
tracker
click
on
the
agenda,
you
get
more
information
there,
and
with
that
I
will
try
to
stop
stop
sharing
here
and
see
if
emilyne
is
available
to
maybe
share
his
self.
A
B
B
B
So
here,
actually
we
want
to
discover
where
the
different
brands
of
hardware,
that
is
to
say
juniper,
cisco,
alcatel,
etc,
where
those
different
brands
of
hardware
are
located
inside
the
network
and
what
is
the
role
that
they
play
and
knowing?
This
is
actually
important
for
a
second
research
question,
which
is
what
could
happen
if
an
attacker
is
able
to
identify
the
brand
of
a
router
and
use
that
information
to
launch
a
targeted
attack
on
sale,
routers.
B
So
from
the
output
that
we
get
from
question
one.
We
can
get
a
view
of
what
could
happen
in
such
a
scenario,
and
these
questions
are
motivated
by
the
fact
that
recently
there
are
five
vulnerabilities
that
have
been
found
in
cisco
devices
vulnerabilities
that
can
lead
to
a
remote
code,
execution
and
denial
of
service
attacks,
but
there's
not
only
cisco.
There
are
also
several
other
manufacturers
for
which
a
vulnerability
in
the
rsm
implementation
has
been
found.
B
B
They
put
an
initial
value
in
this
field,
which
is
almost
always
30,
32,
64,
128
or
255,
and
so
the
people
who
have
found
this
technique
have
also
shown
that
it
is
enough
to
get
these
two
values
for
a
time
exceeded
packet
and
an
echo
reply
packet.
So
these
two
values
we
call
that
the
router
signature.
This
is
what
tells
us,
what
is
the
brand
of
the
router
and
in
this
table,
you
can
find
the
different
classes
of
hardware
that
we
are
able
to
identify.
With
this
technique.
B
We
can
differentiate
between
cisco,
juniper
juniper
with
the
operating
system,
junos
e
and
the
last
class,
which
is
composed
of
brocade,
alcatel
and
linux
machines,
and
that
we
will
call
the
bell
class
okay.
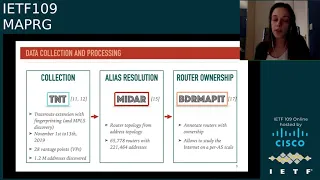
So
on
to
the
data
we
collected,
we
use
tnt,
which
is
a
paris
choice,
root
extension
that
comes
with
this
lightweight
fingerprinting
technique
that
we
just
talked
about,
and
additionally,
it
can
also
reveal
mpls
tunnels.
B
B
So
from
these
traces
we
then
used
another
tool
midar
to
perform
alias
resolution,
which
is
the
process
of
identifying
which
ip
addresses
belong
to
the
same
router
and
so
from
the
ip
level
topology
that
we
got
with
tnt.
We
can
get
a
router
level
topology
with
middle,
and
this
is
actually
interesting
for
us,
because
these
topologies
they
are
closer
to
reality.
They
are
more
concrete,
and
so
we
can
better
study,
network,
resiliency
and
robustness
on
this
kind
of
topology.
B
And
finally,
the
last
bit
of
processing
that
we
did
on
the
data
was
to
use
the
tool
border
mappit,
which
allows
us
to
determine
who
is
the
owner
of
a
router
in
the
sense.
What
is
the
autonomous
system
that
operates
this
router
and
our
goal
here
is
to
delimit,
as
precisely
as
possible,
the
different
ass
in
the
network
to
study
hardware
ecosystem
at
a
finer
scale.
B
Okay,
so
back
to
our
first
research
question:
what
did
we
find?
What
did
we
find?
Well,
let's.
First
look
at
the
internet
as
a
whole
on
your
left.
Here
you
have
a
graph
that
gives
the
signature
reportation
for
both
addresses
and
routers,
and
what
we
can
get
from
this
graph.
Basically,
is
that
cisco
largely
dominates
the
overall
market,
so
we
can
see,
for
example,
that
nearly
60
percent
of
the
routing
devices
are
actually
cisco
devices.
B
Now,
if
we
look
at
a
finer
scale
at
the
scale
of
the
autonomous
system,
well,
this
graph
gives
us
once
again
the
hardware
repartition,
but
for
four
large
asses
this
time
for
asa
b,
c
and
d,
and
what
we
can
already
see
from
this
graph
is
that
the
hardware
repartition
can
be
very
different
from
one
as
to
the
other,
for
example,
with
asa,
we
see
a
lot
of
cisco
devices,
but
for
asd
it's
not
the
case
at
all.
We
see
only
almost
junos
for
asb.
We
see
also
a
lot
of
junas
and
for
asc.
B
B
Well,
the
first
thing
to
know
here
is
that
not
all
routers
contribute
equally
to
forwarding
packets
in
the
network.
Okay,
we
have
small
routers.
We
have
big
routers
with
a
lot
of
forwarding
power,
and
so
if
it
turns
out
that
a
certain
brand
of
router
is
important
for
forwarding
the
traffic,
and
if
that
brand
of
router
has
a
vulnerability,
then
it
could
be
a
target
of
interest
for
attackers
to
to
target
those
routers.
B
So
how
are
we
going
to
measure
the
impact
of
an
attack
on
a
brand
of
routers?
Well,
we
already
saw
the
hardware
distribution
that
I've
put
back
here.
So,
for
example,
if
we
look
at
asa,
we
could
say:
okay,
we
see
a
lot
of
cisco
routers,
so
we
can
conclude
that
cisco
routers
are
important
for
forwarding
the
traffic,
but
actually
the
the
amount
of
routers
does
not
necessarily
reflect
the
amount
of
traffic
that
is
being
carried.
So
this
is
a
first
indicator.
B
Yes,
but
we
need
another
metric
to
measure
that
and
this
metric
is
the
hardware
popularity
we,
we
compute
the
hardware
popularity
as
the
proportion
of
traces
that
cross
each
brand
of
hardware
and
this
metric.
It
has
been
shown
that
it
reflects
the
amount
of
the
actual
amount
of
traffic.
So
what
do
we
get
when
we
compute
it?
Well
here
it
is.
B
We
see
that
actually,
it's
quite
close
to
the
hardware
distribution,
so
our
first
indicator
was
already
a
good
one,
but
still
we
can
see
some
differences,
for
example
for
asc
in
terms
of
number
of
routers,
we
saw
a
nearly
equal
mix
between
belle
and
junas,
but
when
we
look
at
the
amount
of
traffic
that
is
being
carried,
we
see
that
actually
bal
is
more
important
for
forwarding
the
traffic
okay.
So
how
did
we
proceed
with
our
experiment?
B
Well,
for
each
brand
of
router,
we
simulated
an
attack
by
taking
down
different
fractions
of
the
different
brands
of
routers,
and
we
looked
at
the
impact
in
terms
of
traces
impacted
in
the
network
and
we
performed
the
simulation
30
times
and
averaged
the
results
that
you
can
see
here
on
your
right.
So
we
have
one
graph
per
as
let's
look
for
it,
for
example,
at
asa
we
can
see
here
that
it
is
enough
to
take
down
20
of
the
cisco
routers
to
impact
already
nearly
60
of
the
traces
of
all
the
traces
in
this
network.
B
B
B
B
The
second
thing
is
that
the
different,
as
they
can
have
very
different
hardware,
reportation
and
hardware
popularity
and
third,
because
of
this
different
asses,
will
be
more
or
less
vulnerable
to
different
types
of
attacks,
depending
depending
on
the
hardware
infrastructure,
and
that's
it
for
me.
I
hope
you
enjoyed
the
talk.
Thank
you.
C
Okay,
so
they've
changed
this
slightly
since
the
last
time
hi.
So
a
quick
question
on
on
the
takeaways
here
would
a
another
way
to
phrase
this
be.
There
are
definite
advantages
to
being
a
multi-vendor
as
in
terms
of
your
ability
to
like.
So
this
basically
is
looking
at
the
amount
of
traffic.
That's
going
through
these
these
architectures.
B
Yes,
it's
it's
actually
well
in
the
paper,
we
have
a
few
suggestions
for
our
network
operators
and
one
of
the
suggestions
we
didn't
put-
but
I
think
about
later,
was
that
maybe
there
could
be
an
advantage
for
autonomous
system
to
have
several
vendors
several
manufacturers
in
order
to
to
not
be
that
vulnerable,
to
not
rely
on
only
one
single
brand,
but
maybe
a
drawback
of
this
would
be
in
terms
of
management
overhead.
Maybe
it's
complicated
to
to
deal
with
that
many
routers,
because
they're.
C
A
A
A
D
Okay,
yeah.
Thank
you
so
much
so
hello.
Everyone
thank
you
for
being
here
today.
I
am
sudeesh
and
I'll
be
presenting
the
measurements
of
a
privacy,
enhancing
dns
protocol
called
odo
or
oblivious
dns
over
https,
and
this
work
is
the
result
of
a
collaborative
effort
between
lots
of
incredible
people
at
cloudflare
and
was
a
part
of
my
internship
this
summer
with
them,
and
this
talk
will
focus
on
the
odo
standard
proposal
that
was
co-authored
by
apple
and
cloudflare,
and
we're
committed
to
actually
moving
this
forward.
D
D
But
over
the
past
few
years,
we've
seen
active
measurement
research
trying
to
understand
and
measure
the
impacts
of
encrypted
protocols
like
doe
or
dod,
and
many
large
scale.
Measurements
have
shown
that
the
performance
of
these
encrypted
protocols
vary
by
the
choice
of
the
resolver
and
it
does
not
significantly
impact
page
load
times
and
it
improves
user
security.
D
Practices
is
extremely
difficult
and
it
requires
explicit
negotiation
and
a
lot
of
effort
mozilla,
for
example,
actively
defined
criteria
around
data
retention,
aggregation
and
frequent
audits
for
the
door
services
to
be
configured
as
a
default
to
the
firefox
browser
and,
while
some
users
might
might
be
comfortable
with
this
idea
of
having
a
policy
driven
approach,
these
are
difficult
to
enforce
and
they're.
Also
very
time
consuming.
D
Making
users
want
a
system
that
that
can
technologically
guarantee
their
privacy
and
in
in
this
talk
I'll
focus
on
the
privacy
critiques
and
the
ability
for
the
resolvers
to
be
able
to
create
a
profile
for
for
their
clients,
and
this
is
exactly
where
oblivious
dns
or
over
https
or
odo
kicks
in
at
a
high
level.
There
are
three
main
components
in
odo.
D
The
second
is
a
proxy
instance
whose
main
role
is
to
relay
the
encrypted
queries
and
responses
to
and
from
the
targets,
while
removing
the
client
ip
addresses,
and
the
third
is
a
target
instance
which
receives
the
encrypted
query
from
the
client
decrypts.
It
obtains
the
dns
response
for
the
query
processes
it
to
retrieve
another
to
get
a
response,
encrypts
the
response
and
sends
it
back
to
the
proxy,
and
it
has
no
ability
to
identify
who
the
actual
client
is
by
the
ip
address.
D
But
at
a
high
level,
the
design
of
odo
is
similar
to
that
of
dough
and
injects
an
intermediate
proxy
node,
which
terminates
the
client
query
over
here.
Queue
and
performs.
The
query
on
the
client's
behalf
and
the
main
goal
of
odo
is,
is
actually
to
prevent.
Recursive
resolvers
and
isps
running
such
as
running
such
resolvers
from
being
able
to
link
the
clients
to
their
requests,
so
a
client
encrypts
their
query,
using
a
hybrid
public
key
encryption
scheme
and
using
a
validated
public
key
from
the
target
resolver
and
sends
this
query
to
a
proxy
instance.
D
And
there
are
various
ways
in
which
the
clients
can
actually
learn
about
these
services
and
validate
them
through
dns
sec.
Look
for
conflicting
keys,
but,
however,
in
this
talk
I'll
I'll,
be
pointing
on
this
problem.
But
there
are
more
details
that
are
available
in
the
report,
but
in
odo
the
the
proxy
instance
can
see
the
ip
address
of
the
client,
but
not
the
contents
of
the
dns
query
and
forwards.
D
This
message
to
the
oblivious
target,
which
decrypts
the
query
and
obtains
the
response
from
the
resolver
and
the
response
is
encrypted
by
the
oblivious
target
and
is
sent
back
to
the
resolver.
Who
sends
this
message
back
to
the
client
where
it
can
be
decrypted
and
in
this
process
the
target
only
sees
the
dns
content
and
not
the
actual
client's
ip
address.
D
But
we
often
say
the
target
resolver
as
like
independent
entities,
but
this
need
not
really
be
true.
Ideally
in
practice
for
performance
reasons,
the
the
oblivious
target
and
the
recursive
resolver
could
be
co-located,
and
this
avoids
the
additional
network
messages
between
the
oblivious
target
and
the
resolver.
D
D
This
slide
pretty
much
sums
up
the
results
of
our
measurement
and
is
probably
the
most
interest
to
all
of
you,
but
but
I'll
leave
this
here
as
a
reference
to
come
back
to
just
in
case.
Anyone
wants
to
refer
to
the
slides
and
in
the
next
few
slides.
Actually
talk
about
the
measurement
that
we
perform
and
detail
each
one
of
these
takeaways.
D
Xeon
is
roughly
480
megabits
per
second,
but
the
clients
perform
dns
response
time
measurements
by
choosing
pairs
of
available
proxies
and
targets
and
by
choosing
a
low
latency
proxy
target
pair
for
the
measurement
shown
in
the
orange
line.
Here
we
find
that
the
average
query
response
time
improves
by
22.8
percent
compared
to
only
choosing
a
low
latency
proxy,
as
shown
in
the
green
line,
and
this
hints
towards
the
fact
that
having
an
intermediate
proxy
on
the
same
network
path
to
the
target
will
improve
the
response.
D
In
our
experimental
setup.
We
we
evaluate
for
the
worst
case
performance
and
incur
an
additional
network
latency
between
the
target
instance
and
the
resolver
in
the
architecture
that
we
showed
before
and
as
as
we
see
here,
the
target
instances
which
are
located
in
google
cloud
and
performing
queries
to
three
open
resolvers
have
faster
response
time
for
google
dns
because
of
potential
co-location
within
the
same
data
center
compared
to
the
other
services
and
integrating
the
oblivious
target
into
the
recursive
resolver
can
reduce
the
the
network.
D
Latency
incurred
to
that
of
a
cache
hit
for
for
the
answer
and
in
the
cache
miss
cases,
incurring
the
network
cost
for
the
recursive
resolver
to
communicate
with
the
other
name
servers.
So
we
find
that
co-locating.
These
services
does
actually
result
in
better
performance
but
to
understand
the
performance
of
odo.
D
But
when
we
compare
this
to
odo,
we
notice
odo,
with
no
service.
Co-Location
achieves
an
interesting
position
roughly
in
between,
do
and
do
over
torque,
and
these
results
get
interesting
and
better,
as
we
start
to
co-locate
the
target
and
the
resolver
together,
which
is
shown
by
the
dash
blue
line
over
here,
and
we
notice
that
the
response
time
for
odo
compared
to
doe
for
the
baseline
increases
by
fifty
percent
with
service
co-location
and
a
hundred
percent
when,
when
the
target
and
the
resolver
are
not
co-located
but
dns
protocols
with
message.
D
Encryption
like
dns
script
or
anonymous,
dns
script
tend
to
have
much
larger,
compute
overheads
and
use
non-encrypted
channels,
and
these
protocols
have
higher
response
time
and
lies
somewhere
in
between
odo
and
doe.
Over
torr,
which
is
which
is
over
here
in
this
in
this
region
on
on
the
graph
and
the
performance
of
these
response
times
with
with
odo
somewhere
being
in
the
middle
ground
is
very
interesting,
is
very
interesting
for
us,
and
but
this
brings
us
to
a
crucial
measurement
that
we're
really
interested
in
the
page
load
time
impact.
D
And
to
do
this,
we
establish
a
measurement
node
in
a
lab
network
with
an
available
on
path
and
a
randomly
chosen
off
path.
Proxy
and
the
node
runs
a
local
stub
resolver,
which
is
configured
to
use
doe
and
odor
protocols
for
various
runs
and
in
each
run
we
browse
the
same
set
of
pages
after
purging,
all
the
local
cache
entries
and
perform
page
load
time
measurements
with
selenium,
while
using
the
navigation
events.
D
Our
first
measurements
presented
here
are
pessimistic
and
use
the
worst
case,
network
architecture
with
no
service
co-location
and
only
considers
the
complete
page
load
time.
Events
instead
of
other
metrics
like
time
to
first
byte
or
the
first
useful
paint.
So,
additionally,
there
are
a
lot
of
various
browser
artifacts
like
caching,
which
happens
within
the
browser
which-
and
this
is
the
reason
why
the
top
graph
over
here
is
quite
different
from
from
the
stress
test
measurements
and
the
results
from
this
test.
Measurements
that
we've
shown
before.
D
But
what
we
find
in
in
our
preliminary
measurements
is
that
using
odo
with
an
onpath
proxy
increases,
the
page
load
time
by
20
compared
to
a
baseline,
udp
based
dns
usage
or
doe,
and
a
randomly
chosen
off
path.
Proxy
actually
increases
this
by
25
percent,
so
the
page
load
times
move
from
somewhere
between
1.319
seconds
on
an
average
to
1.6
seconds
with
odo.
These
results
are
still
preliminary
and
we
are
optimistic
that
with
service
co-location,
these
will
get
better.
D
But
this
is
still
ongoing
work
and
to
conclude,
odo
is
a
practical
privacy
enhancing
protocol
for
dns,
and
it
has
minimal
page
load
time
impacts
and
the
performance
impacts
of
the
protocol
are
purely
like
network
topology
effects.
We
make
a
lot
of
recommendations
in
our
report
for
the
ideal
usage
in
production
systems
like
having
an
ecosystem
of
on-path,
proxies,
having
service,
co-location
and
being
able
to
and
making
the
clients.
D
You
do
connection
reuse
all
of
the
code
and
our
implementation
is
open
source
and
is
available
at
these
links
on
github
under
the
cloudflare
organization
and
we're
committed
to
move
this
standard
forward
in
the
ietf
and
hope
that
more
operators
join
us
in
providing
support
for
the
protocol
either
by
running
the
proxies
or
the
targets,
and
the
report
indicating
our
measurements
is
also
available
at
this
link
here.
Thank
you.
I'm
I'm
open
to
questions.
A
E
Thank
you.
So
I
was
just
wondering:
does
the
work
that
you
have
here
support
ecs
or
edns
client
subnet,
because
it
seems
like
the
optimization
that
you're
doing
is
really
great
for
dns
performance,
but
on
the
other
side
of
that
authoritative
name,
servers
may
be
being
used
to
try
and
do
geolocation
based
load
balancing.
You
know
for
our
actual
delivery
performance
enhancement
and
if
that
information
is
obscured,
what's
what's
the
balance?
Have
you
have
you
looked
into
that
at
all,
yet.
D
So
so
we
haven't
actually
performed
a
lot
of
measurements
for
that,
but
to
to
the
dns
resolver,
the
proxy
is
essentially
what
what
they
would
see
as
the
client.
So
any
edns
optimizations
that
that
are
applied
for
say
a
proxy
in
a
specific
geo
location
would
continue
to
be
applied
it.
It
probably
becomes
possible
for
the
client
to
choose
a
proxy
that
is
prop,
but
that
is
maybe
at
a
completely
different
geo
location
and
that
might
have
some
effect
on
edns,
but
we
haven't
actively
measured
them.
C
C
You
know
you
could
actively
choose
a
proxy
either
to
maximize
the
confusion
right
like
the
maximum
or
minimize
the
identifiability,
or
also
to
minimize
latency.
What
what
I'm
seeing
in
these
graphs,
though,
is
that
those
two
tend
to
be
look
like
they're
related
to
each
other.
You
can
either
maximize
confusibility
or
you
can
max,
or
you
can
minimize
latency,
because
the
minimum
latency
path
is
going
to
point
kind
of
in
the
direction
that
you're
pointing
in
so
I
I'm
kind
of
wondering
I
actually
would
like
to
see
the
follow-up
work
here.
C
Right,
because
I
mean
there's
the
impact
of
of
this
over
dns
over
over
53,
you
said-
is
up
to
20,
which
is
actually
kind
of
massive,
and
that's
like
that's
just
late
in
the
table.
So
I
guess
that's
more
of
a
you
know.
Please
dig
into
that.
I
I
I
in
the
future.
I
want
to
see
sort
of
a
curve
between
hey.
A
C
Right
so
you're
fixing
the
linkability
problem,
but
the
but
the,
but
I
mean,
if
you're,
in
a
situation
where
only
three
people
are
behind
a
certain
proxy,
then
you
know
you
need
to
get
the
mass
and
and
you're
you're
kind
of
you're
kind
of
flipping.
The
mass
argument
that
doe
was
intended
to
solve
in
in
the
first
place
back
around
so
comparing
other
architectural
variants.
D
Yeah,
I
I
think
I
think
that's
definitely
like
a
very,
very
valid
suggestion,
but
as
jonathan
I
think
pointed
out
in
the
chat
along
with
he
said
that
it's
not
in
either
or
in
most
cases
like
you,
don't
have
to
choose
between
one
of
them.
There
are
past,
probably
ways
in
which
we
could
scale
them,
but
it
needs
like
this
close
collaboration
to
by
a
lot
of
operators
and
network
operators
to
put
some
of
these
proxies
on
path
and
see
and
see
how
we
can
do
this
right.
D
A
Thanks,
we
still
have
time
we're
really
good
in
time.
That's
really
nice
not
used
to
that,
but
we
don't
have
anybody
in
the
queue
anymore.
So,
thank
you
very
much
for
your
presentation.
You
can
ask
more
questions
in
the
chat
everybody
else
we
will
move
on
to
the
next
presentation
and
next
we
have
sebastian
talking
about
dns
again,
are
you
able
to
share.
F
F
So
our
intent
with
this
work
is
if
we
can
do
anything
to
go
and
measure
internet
centralization,
and
you
can
pick
any
metric.
You
may
want
on
this
the
number
of
uses
the
amount
of
traffic
network
infrastructure
as
a
mailing
presented
a
little
bit
a
few
minutes
ago.
Computer
infrastructure
market
power
market
share,
but
because
of
all
of
our
three
dns
organizations,
we
focus
on
dns
traffic.
F
F
We
have
the
dns
traffic
going
to
door,
dornell
the
netherlands
with
official
language,
touch
new
zealand,
english,
maori
and
sign
language
and
be
root,
and
we
focus
our
efforts
on
and
measuring
from
five
different
cloud
and
content
providers,
so
google,
amazon,
microsoft,
facebook
and
cloudflare,
two
of
those
cloudflare
and
google.
As
you
know,
and
as
you
heard
from
the
previous
presentation,
they
have
public
dns,
so
we
would
expect
to
see
a
lot
of
traffic
from
them.
F
F
However,
the
root
servers
and
the
cctv
in
the
tld
space
are
completely
different
beats
and
you
can
see
if,
for
new
zealand,
almost
a
third
of
the
traffic
comes
from
those
five
cloud
providers
which,
for
the
netherlands
is
even
worse,
and
you
can
see
if
I
go
back
and
forth
that
the
amount
of
traffic
the
netherlands
gets
from.
Google
is
around
15
percent
of
the
total
load.
F
We
can
focus
on
different
aspects,
but
basically
we
can
see
from
ipv4
ipv6
options
and
at
the
end
of
the
slides
I
have
a
beautiful
picture
that
shows.
Google
and
cloudflare
basically
share
the
traffic
between
ipv4
and
ipv6,
but
facebook
is
starting,
sending
more
and
more
ipv6
traffic
and
the
microsoft
and
amazon
barely
use
ipv6
as
a
transport.
F
The
reason
for
that-
and
I
have
a
pretty
picture
here-
is
basically
because
google
deployed
q
name
minimization
in
december
2019,
which
leads
us
to
part
of
our
conclusions
that
if
a
cloud
provider
decides
to
go
and
adopt
a
certain
technology,
ietf
technology,
you
will
see
a
massive
change
either
dnsec
udp
versus
tcp,
etc.
So
there
are
pros
and
cons
of
centralization
and
again
I'll,
invite
you
to
go
and
check
the
video
presentation
on
imc,
ripe
or
dns
org
or
read
the.
A
F
Right
so
well,
george
is
pointing
out
cuny.
An
immunization
is
sort
of
a
country
example
of
where
a
consent,
market
concentration,
is
a
good
thing
to
have,
and
I'm
pretty
sure
there
are
other
options.
So
google
also
does
dns
validation
and
because
the
netherlands
has
a
lot
of
you
know,
domain
names,
it's
likely
an
explanation
for
why
it
isn't
receiving
so
much.
Traffic
cloudflare
is
also
that's
a
dns
equalization.
F
A
F
If
we
have
more
time,
I
can
show
you
one
more
thing
which
surprises
us.
So
most
of
the
traffic
received
by
the
netherlands
and
new
zealand
is
a
udp
traffic
except
for
facebook.
So
facebook
has
a
non
negligible
amount
of
tcp
traffic
and
by
checking
the
edns
buffer
size,
we
notice
they're
using
a
very
small
buffer
size,
so
they're
likely
querying
for
something
and
they
not.
Then
they
have
to
go
and
retry
on
tcp
the
same
query:
late.
A
H
H
H
H
And
finally,
the
last
analysis
that
I
want
to
show
you
is:
we
also
looked
at
different
applications,
how
traffic
for
different
applications
changed
and
one
of
one
important
applications
when
you're
working
from
home,
as
is
vpn,
so
we
applied
a
port
base
as
well
as
a
domain
based
technique
to
identify
vpn
traffic
and
in
this
left
part
of
the
graph
you
see
on
the
upper
part
of
the
graph.
You
see
the
traffic
volume
for
workdays.
H
So
again,
if
the
bar
is
higher,
you
have
more
traffic,
more
vpn
traffic
there
and
on
the
lower
part,
you
see
the
traffic
volume
for
weekends,
and
this
is
the
traffic
the
vpn
traffic
for
february.
If
we
now
compare
this
with
march,
we
see
that
there
is
about
a
200
increase
in
vpn
traffic,
mostly
during
during
the
working
days
in
working
hours.
H
So
what
are
our
main
takeaways
from
this
paper?
We
saw
that
traffic
increased
between
15
and
30
percent
within
just
a
few
days.
The
difference
between
the
work
days
and
weekends
starts
to
vanish
and
also
specific
applications
for
remote
work
such
as
vpn
and
video
conferencing
saw
quite
a
large
increase
in
traffic.
H
There
is
a
lot
more
in
the
paper
which
we've
presented
at
imc
2020..
For
example,
we
look
at
changes
in
transport,
ports,
different
traffic
classes.
We
also
investigate
how
does
a
traffic
in
an
educational
network
change
during
the
pandemic,
when
students
are
staying
off
of
the
campus
and
at
home,
and
we
also
compare
hyper
giants
versus
non-hyper
giants
and
much
more.
A
Thank
you
very
much.
We
do
have
like
one
or
two
minutes
for
questions.
I
also
wanted
to
mention.
I
forgot
this
earlier
that
this
is
like
only
maybe
not
fully
in
scope
from
apache,
but
we
thought,
given
the
current
circumstances
might
be
interesting.
It's
a
very
comprehensive
paper
with
a
lot
of
different
measurements
and
there
are
also
more
papers
at
imc
at
the
internet
measurement
conference.
I
H
So
that's
so
weekend,
traffic
still
looks
like
weekend
traffic
more
or
less.
So
it's
the
the
the
main
thing
that
changes
is
the
working
day
traffic.
So
I
can
maybe
show
a
backup
slide,
which
I
have
here
and
what
what
you
see
here
is
basically
we're
trying
to
classify
from
the
traffic
characteristics
whether
a
a
day
looks
more
like
a
weekend
or
it
looks
more
like
a
a
working
day
and
on
the
lower
part.
You
see
the
the
days
classified
as
working
days
on
the
upper
part.
H
You
see
days
classified
as
weekends
and
all
of
the
blue
bars
are
classified
correctly.
So
here,
for
example,
we
have
the
weekends
classified
correctly
here
we
have
working
days
classified
correctly
and
what
you
see
is
that
the
weekends
remain
classified
correctly,
so
they're
still
behaving
like
weekends.
G
A
J
J
J
However,
the
questions
still
persist,
whether
internet,
facing
or
pc
or
a
deployments
are
configured
securely,
and
you
might
ask
why
this
is
relevant
for
the
itf
as
opcwa
is
now
idf
protocol.
But
we
think
that
this
might
be
only
a
key
example
for
secure
by
design
protocols
in
general.
So,
let's
get
into
it.
J
Space
and
42
of
them
are
discovery
servers,
which
means
that
they
are
only
used
to
announce
opc,
os
deployments
on
other
ip
port
combinations,
and
we
focused
on
the
non
discovery
service
here.
As
the
security
configuration
is
only
relevant
for
the
actual
payload
transmission
and
yeah,
then
we
answer
the
question
whether
these
are
configured
securely.
J
Looking
into
the
security
configurations
of
these
deployments.
First,
looking
into
the
security
mode,
which
basically
enables
or
disables
communication
security
features,
for
example,
confidentiality
and
or
authenticity,
and
here
one
out
of
three
modes
completely
disables
the
communication
security,
and
we
found
that
one-fourth
of
all
deployments
actually
uses
this
one
mode,
basically
neglecting
all
of
the
obc
a
security
benefits
and
do
not
offering
communication
security
at
all.
J
And,
furthermore,
we
looked
into
the
security
policies
which
define
security
primitives
to
be
used
to
implement
these
selected
security
features,
and
here
three
out
of
six
policies
are
not
considerable
as
not
secure
and
two
of
them,
because
two
of
them
are
deprecated
due
to
the
usage
of
sha-1,
and
we
found
that,
despite
these
were
deprecated
in
2017,
one.
Fourth
of
all
deployments
that
offer
security
use.
These
still
use
these
deprecated
policies
and,
more
interestingly,
we
found
that
only
one
point.
J
Looking
into
the
third
aspect
of
the
security
concept,
we
also
looked
into
authentication
and
found
that
44
of
the
deployments
do
not
implement
access
control,
meaning
that
everybody
on
the
internet
can
access
these
servers
without
authenticating
itself,
and
we
also
looked
into
the
payload
data
of
these
deployments
and
found
that
these
are
actual
production
systems.
As
of
our
judgment.
J
So
our
results
underpin
that
deploying
a
secure
by
design
protocol
is
not
sufficient,
but
it
requires,
of
course,
a
secure
configuration,
and
we
think
that
also
standardization
could
somehow
help
for
that,
for
example,
by
specifying
that
implementations
have
to
ship
with
secure
by
default
configuration
yeah.
Our
papers
are
available
on
archive
and
we
also
published
our
data
set
in
our
scanner.
So
thank
you
very
much
for
your
attention.
A
Thank
you
max
sorry
that
you
now
were
a
little
bit
time
squeezed
here,
but
also,
I
recommend
really
to
read
the
paper.
I
think,
even
though
this
is
not
an
itf
protocol,
it's
a
really
good
example
about
what
can
go
wrong.
I
think,
like
you,
ended
up
with
over
90
of
deployed
systems
that
have
like
some
kind
of
a
security
flaw,
even
so
recommendations
exist.
So
I
think
this
is
a
good
lesson
learned
read.
So
people
should
read
the
paper
and
look
at
this
and
we
should
consider
this
in
future.
A
We
can
maybe
take
one
quick
question.
We
are
already
over
time,
but
if
there's
something
urgent,
I
would
grant
it
otherwise.
People
can
move
to
the
list.
Ask
for
the
questions
to
marcus,
read
the
paper
or
contact
him
directly.
Thank
you
very
much
and
with
that
we're
at
the
end
of
our
session.
Thank
you
very
much
to
all
the
speakers.
I
really
enjoyed
it.
I
was
really
happy
that
we
got
so
many
good
presentations
and
talks.