►
Description
Jenkins Open Telemetry plugins for Jenkins controllers and agents were a great start. Let’s discuss what we can do next to provide a great observability experience for Jenkins users in the CI/CD space, including tracing, metrics and logging parts.
Meeting notes: https://docs.google.com/document/d/1QLWXNG23ui-LvQXth3UREzOvLYgTMSZcv-El0H141a4/edit#heading=h.9zkqotza30hg
A
A
A
A
A
I
am
a
product
manager,
but
I
also
code
on
before
elastic.
I
was
working
at
cloudbees
on
jenkins.
I
was
a
maintainer
and
co-creator
of
the
jenkins
maven
pipeline
plugin.
So
it's
also
the
reason
why
I
wrote
some
code
when
I
continued
to
write
some
code
on
the
jenkins,
open,
symmetry
plugin
on
recently.
More
recently,
I've
done
the
maven
open,
telemetry
integration
as
well.
B
So
I'm
here
with
my
little
one,
so
you
see
her,
say
hi
so
she's
blurred
though
yeah
I
love
it.
I
put
some
background,
so
my
name
is
victor
martinez.
I
work
as
a
software
engineer
at
elastic
more
precisely
in
the
productivity
team,
so
I'm
quite
into
ci,
cd,
tooling.
I've
been
using
that
tool
for
years
and
years,
yeah
contributing
to
jenkins
for
a
while,
and
I've
been
working
with
serial
a
lot
of
in
our
free
time
to
make
this
possibility
for
jenkins,
something
that
is
tangible.
B
Besides
of
working
with
him,
I
also
enable
the
integration
with
ansible
and
open
telemetry
is
something
now
already
published
by
in
the
ansible
community.
So
it's
there
to
be
considered.
I'm
interested
to
listen
from
different
people's
point
of
view
about
the
expectation
and
to
make
something
that
can
be
sustainable
and
helpful
for
people
rather
than
something
like.
I
believe
it
will
be
helpful.
It's
worth
to
listen
people's
need
as
well,
and
that's
me
very
much.
C
And
so
yeah,
I'm
one
of
jenkins
contributors
and
core
maintainers,
I'm
very
interested
in
observability
topics.
Well
for
what
it
was.
I'm
a
author
of
docker
traceability,
plugin
for
jenkins
and
a
few
others
and
yeah
I'm
looking
forward
to
expanding,
integrations
and
yeah.
I'm
really
interested
to
connect
the
rankings
and
developers
developer
tools
to
open
telemetry
system,
because
it
seems
like
a
great
project
for
all
the
iteration
space.
So
looking
forward
to
it
and
yeah.
I
hope
you
do
some
contributions
to
create
the
imagery.
Finally,.
D
A
D
E
A
A
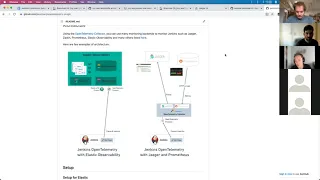
It
will
push
its
observability
matrix.
It's
a
mix
of
these
two
settings.
It
will
jenkins
will
push
its
open
damage
metric
to
an
open,
telemetry
collector
that
will
push
simultaneously
to
jaeger
onto
elastic
observability,
and
it
will
also
push
the
metrics
make
the
matrix
available
as
a
prometheus
exposition
format,
and
we
could
also
push
to
any
other
observability
vendor
a
zip
king,
lightstep
honeycomb
splunk
whatever,
because
it's
just
open
temperature
and
it
can
to
distribute
the
signals
to
many
things.
A
A
I
prepared
some-
you
will
see
here
a
maven
pipeline
execution
trust
captured
as
an
open
dimension
trace
and
you
can
see
the
end-to-end
build
took
14
seconds
this
I
look
at
with
elastic,
but
I
could
also
demo
with
a
jager
tracing.
It's
the
same,
build
my
war.
I
will
show
with
a
jager
if
you
want,
so
that
maybe
more
people
are
familiar
here.
You
see
it's
I'm
building
the
it's
on
jenkins
and
I'm
building
my
war
on
the
branch
called
maven
hotel
extension.
A
Then
there
is
a
start
phase
of
jenkins
the
reinforce
of
the
pipeline.
I
have
the
agent
allocation
that
took
160
milliseconds,
so
it's
very
helpful
to
troubleshoot
agent
allocation
problem.
Then
I
am
on
the
stage
called
git
checkout.
I
can
tell
you
that
the
git
checkout
took
1.1
second
and
then
the
build
with
a
maven
package
invocation
that
took
five
seconds
almost
and
then
thanks
to
an
integration
we
have
produced
between
jenkins
observability,
with
hotel
on
maven
observability
with
hotel.
A
I
am
able
also
to
integrate
the
step-by-step
goal
by
goal
invocation
execution
of
the
maven
build.
So
you
can
see
that
the
maven
build
itself
took
2.2
seconds.
You
can
see
that
compiling
took
to
300
milliseconds
almost
and
then
the
test
took
100
milliseconds
on
producing
the
war
file
took
500
milliseconds.
A
A
So
this
is
a
hotel,
cli
catch
control
capability
and
we
are
interested
in
in
having
more
integration
to
have
a
broader,
better
visibility
in
the
end-to-end
process,
and
I
could
show
you
also
we
integrate
on
to
the
openness
of
open
telemetry.
We
are
able
to
provide
visibility
inside
jaeger.
We
are
able
to
expose.
A
I
think
it's
this
one
yeah
so
here
you
can
see
all
my
jenkins
metrics
if
you're
familiar
with
prometheus,
we
integrate
with
various
backends.
So
I
think
this
is
the
idea
of
a
demo
that
we
wanted
to
share
with
you
so
visibility
inside
jenkins.
As
we
have
said,
you
see
your
pipeline
execution
as
a
traces
that
you
are
able
to
compare
from
one
end
execution
to
another,
because
I
have
all
my
traces
execution
here.
So
I
can
compare
the
duration.
You
can
see
that
yesterday
took
18
seconds
when
today
took.
A
A
Something
very
interesting
also
is
that,
with
this
jenkins
demo
jenkins
is
not
the
only
ci
platform
that
provides
visibility
on
its
pipelines
on
concord
ci.
They
don't
capture
a
screenshot
of
this
and
I
don't
have
one
here,
but
you
are
also
able
to
capture
the
execution
of
your
concord
ci
pipeline
as
an
open
temperature
trace,
so
that
you
can
have
similar
visibility
across
your
concourse
field
on
your
jenkins
fields.
B
This
for
the
demos-
not
much
yes,
probably
one
thing
about
this,
so
everything
is
integrated
as
long
as
there
is
a
context
propagation.
So,
within
the
jenkins,
open,
telemetry,
plugin,
every
single
transaction,
a
trace
is
pro
populated
as
an
environment
variable.
So
that's
the
way
is
easily
integrated
with
other
systems
such
as
maven
and
ansible,
because
in
that
particular
step
in
the
yankees
pipeline,
the
trace
id
and
span
id
will
be
there
in
the
context
and
that's
how
you
can
use
those
parameters.
B
A
Do
I
have
yeah,
so
is
this
yeah
we
discuss
of
this
format
as
part
of
the
open,
telemetry
specification,
so
it's
an
environment
variable
called
transparent
on
trace
state
on.
You
can
see
that
many
people,
so
we
we
present
this
maven
integration,
jenkins
of
integration
or
telc
integration
on
civil
integration.
A
There
is
a
guy
at
splunk
who
is
working
at
instrumenting
gradle.
He
also
integrates
on.
There
are
other
people
also
working
on
this
integration,
so
we
see
at
the
moment
the
creation
of
an
amazing
ecosystem
of
devops
tools
that
support
this
integration.
On
providing
this
visibility
to
cicd
practitioners.
C
A
D
C
Yeah-
and
this
is
nice
so
yeah
my
case-
yeah-
play
to
this
disintegration.
One
of
the
issues
I
missed
in
the
current
open,
telemetry
plugin
was
cloud
api
integration
because
you
know
my
case.
Many
agents
have
been
provisioned
from
the
cloud
and
they
it's
much
more
difficult
to
understand.
What's
going
on
there,
so
maybe
instrument
and
cloud
api
and
exposing
conventions.
C
B
B
B
C
Well,
there
are
options
to
create
them
to
some
extent,
but
it's
not
a
part
of
jenkins
core
api
and
it
becomes
the
main
use
case
in
cloud
ecosystem
at
the
moment.
So
maybe
what
we
actually
need
is
to
create
another
previous,
genuine
engine,
remote
within
cloud
api,
and
for
this
mode
we
can
do
much
better
tracing.
B
Yeah,
indeed,
yeah,
actually
when
something
was
failing,
if
I
recall
correctly,
when
provisioning
a
cloud,
one-shot
cloud
machine
used
to
happen
two
times
the
error
for
some
reason,
so
then
you
monitor
metrics
suddenly
for
a
failure.
You
have
two
failures.
Two
I
mean
you
know
the
counter
was
added
twice
rather
than
once.
A
Yeah,
excuse
me,
but
in
the
agenda
it
was
planned
to
talk
about
the
deployment
model,
the
architecture
and
here
I
feel
that
with
cloud
agent
visibility,
we
are
already
in
the
ideas
for
next
or
the
community
discussions.
Now,
shall
we
cover
the
department
model
for
people
who
are
not
familiar
with
it.
A
I
think
it
can
be
super
quick,
so
it's
the
deployment
model
is
pretty
lightweight,
so
there
is
an
sdk
provided
by
the
open
telemetry
community
that
we
embed
as
an
jenkins,
open
symmetry
plug-in,
and
then
your
jenkins,
with
this
plugin,
is
capable
to
first
to
collect
its
observability
signals.
Traces
metrics
on
some
logs.
B
B
A
Victor
and
I
we
work
for
elastic,
so
we
we
have
a
an
architectural
diagram
with
elastic
olex
works
with
dynatrace
on
it
as
a
replacement.
It
could
be
dyna
trace
directly
same
for
splunks
and
for
the
open
source,
no
zipkins.
They
don't
have
native
support.
You
will
have
to
go
through
an
hotel
collector,
but.
B
A
A
Bus
and
you
can
use
a
chain
with
an
open
temperature
collectors
that
can
then
convert
into
the
open
symmetry
protocol
with
jrpc
and
something
very
powerful
here
is
that
all
your
observability
signals
are
normalized
on
in
kafka,
and
so
any
devops
team
can
create
its
own
integration
just
connecting
to
the
kafka
stream
on
collecting
the
observability
signals
so
collecting
the
pipeline
traces
on
jenkins
metrics
for
examples
or
logs
when
we
implement
them.
So
here
I
forgot
to
mention
capture
pipeline
logs.
A
Initially,
we
thought
of
two
main
goals:
two
two
problems
we
wanted
to
solve
with
this
observability
in
the
ci
process,
the
first
one
was
to
help
ci
administrators
to
troubleshoot
their
platform,
because
troubleshooting,
a
ci
platform
like
jenkins,
is
very
complicated.
So
this
was
the
first
problem
we
wanted
to
solve
on
here.
Better
visibility
in
the
cloud
agent
allocation
and
life
cycle
is
typically
this.
The
second
problems
we
wanted
to
solve
was
to
help
developers
application
teams
who
uci
help
them
to
optimize
their
ci
pipeline
on
here.
A
Maybe
it's
more
improving
the
end-to-end
visibility
of
the
process,
including
not
only
the
visibility
in
jenkins,
that
is
a
solved
problem,
but
also
in
maven,
in
gradle,
in
on
cyborg,
in
terraform,
in
having
good
visibility
in
a
docker
registry,
push
an
artifactory
upload
and
one
then
for
developers.
We
also
consider
the
problem
of
improving
the
visibility
on
unit
test
to
solve
the
problem
of
a
better
identification
of
flacky
test
on
of
time-consuming
tests.
A
A
So
this
could
be
something
interesting
to
on
here.
All
the
data
of
cost
accounting
would
be
traces,
open
damage,
retraces,
and
we
could
imagine
either
to
solve
the
problem
of
compute
of
the
processing
the
cost
accounting
inside
an
observability
backend,
maybe
elastic
for
us
dyna
trace
for
oleg
or
maybe
with
a
devops
tool.
That
would
just
listen
to
the
kafka
stream
and
we
could
provide
a
kind
of
proof
of
concept
to
the
community,
to
cicd
practitioners,
creating
a
proof
of
concept
that
would
receive
whatever
cascade
streams
or
just
otlp.
A
C
A
A
What
we
have
seen
is
that
this
pipeline
is
associated
with
this
team
on
this
team.
Then
I
kind
of
a
mapping
with
the
business.
You
need
the
cost
center,
but
then
we
have
seen
also
a
pipeline,
maybe
triggered
by
another
pipeline
and
if
the
pipeline,
if
your
the
pipeline
of
your
team,
is
triggered
by
another
team
who
is
building
like
crazy
who
should
be
charged,
it's
an
open
question
on
so
here.
A
Another
problem
that
we
have
seen
discussing
with
customers
that
could
be
interesting
is
the
idea
when
you,
I
will
take
jaeger
this
time
instead
of
elastic,
so
that
we
have
under
neutron
the
idea
to
measure
the
productivity
of
teams,
because
when
you
do
your
devops
transformation,
your
digital
transformation
organization,
they
want
to
measure
the
efficiency
of
their
team
to
produce
software
on.
They
want
to
measure
the
improvements
across
time
when
they
do
their
devops
transformation,
natural
transformation
and
so
on.
A
I
have
different
phases,
which
are
called
stage
typically
in
jenkins,
which
I
can
map
to
my
business
process
like
the
development
build
like
this
qa
phase,
the
security
phase,
the
deployment
to
production
phase
until
they
are
interested
in
doing
some
reporting
on
the
ci
process
on
the
cicd
process
on
capturing
the
build
logs,
the
build
traces
sorry
could
be
a
very
good
data
source
for
them
until
we
once
again,
we
are
in
this
model
where
we
would
produce
the
observability
signals
on
a
devops
tool.
Would
look
at
all
the
jenkins
traces.
A
A
B
Can
I
can
I
just
jump
on
this
now
this
idea,
I'm
gonna
say
it
would
be
nice
about
the
implementation
details
so
the
way
we
can
map
this
obviously
can
be
happened
by
different
meanings.
You
can
go
there
more
deeper,
as
you
can
go
to
the
stage
level
or
you
can
go
to
the
step
level.
It
would
be
nice
to
have
a
way
like
the
built
in
step
or
this
pipeline
declarative
could
provide
this.
B
A
new
signature,
like
you,
can
add,
open,
telemetry
argument,
and
then
you
get
this
because
you
can
provide
a
say,
the
stage
bill
matches
or
map
with
the
team
blah
blah
blah.
But
in
order
to
do
that
at
the
moment
is
not
something
like
the
plugin
of
the
declarative
or
the
jnk
score
provide
at
all,
but
if
they
could
provide
this,
then
we
will
benefit
to
you
know
to
extend
this
particular
method
for
free.
It's,
like
you,
run
a
cell
step
and
I
interact
with.
I
don't
know,
docker
registry.
B
The
only
way
we
can
do
that
is
just
you
know,
tweaking
or
doing
something
fancy,
while
is
the
sh
step,
could
have
a
open,
telemetry
argument
by
default.
It
means
we
can
inject
more
metadata
and
create
this
information.
That
is
free.
That's
what
I'm
trying
to
say
like
if,
if
it's
already
integrated
much
more
with
the
changes
core,
we
will
be
able
to
have
more
more
details
easily.
A
This
is
the
same
family
of
a
solution
yeah,
where
we
would
be
interested
in
associated
some
kind
of
tags
or
attributes
or
labels
as
a
pipeline
level,
or
maybe
at
the
stage
level
or
at
different
levels.
In
your
cicd
process,
we
could
imagine
jenkins,
folder
jenkins,
job
jenkins,
job
steps
to
be
able
to
annotate
with
some
attributes.
A
On
the
conversation
we're
having
at
the
moment,
is
that,
should
these
attributes
be
open,
telemetry
specific
or
should
they
be
more
generate
a
bit
like
we
see
some
attributes
in
on
cloud
providers
like
aws,
you
can
put
tags
on
kubernetes,
you
can
also
annotate
your
stuff
and
so
on.
So
it's
a
conversation.
We
are
it's
something
we
actually
are
exploring
at
the
moment.
A
On
something
that
came
to
my
mind
about
the
semantic
of
of
drinking
jobs
to
report
on
typically,
the
velocity
is
what
jenkins
sex
is
capable
of
doing,
as
they
are
very
opinionated
pipelines.
There
is
a
release
pipeline.
If
I
remember
properly,
there
is
a
release
pipeline,
the
development
pipeline
and
so
on.
A
They
are
able
to
produce
some
reporting
really
on
the
team
velocity
under
the
reason
is
they
are
capable
of
this,
for
me,
is
the
foundation
of
jenkins
sex,
which
is
to
say
they
took
the
accelerate
book,
or
I
don't
know
which
book
they
took
as
a
and
they
said
jenkins
x
will
be
the
reference
implementation
of
this
book,
a
reference
implementation
of
this
book,
and
so
here,
maybe,
if
jenkins,
had
more
semantic
pipelines
like
a
release
pipeline,
something
that
is
formally
tagged
as
a
release
pipeline.
Maybe
we
could
also
extract
more
data.
A
Here
we
had
something
very
interesting
working
on
collaborating
with
the
open
telemetry
community.
Here
for
your
information,
we
have
donated
the
maven
x,
open
chemistry
extension
that
we
have
produced.
We
have
donated
it
to
the
open,
telemetry
community
itself,
rather
than
the
maven
community
on
something.
Absolutely
amazing
is
the
support
we
got
from
the
open,
telemetry
maintainers
and
typically
we
got
when
we
donated
this
maven
hotel
extension.
C
A
Yeah
until
what
we
discovered
here,
I
I
thought
for
the
program.
We
would
face
it
with
a
unit
test,
but
in
fact
we
touch
it
already.
Here
is
the
problem
when
you
have
too
many
spans
too
many,
when
your
granularity
is
too
fine,
grained,
at
least
for
the
visualization
tools
we
have
today,
and
so
what
I
thought
is
that
there
is
a
big
appetite
to
instrument
unit
test
frameworks,
because
at
elastic
we
we
generate
a
report
of
the
top
10
feeling
jobs
per
week.
A
So
maybe,
if
we
instrument
unit
test
frameworks
that
could
be
very
interesting,
then
there
are
traces
that
we
would
disconnect
from
the
pipeline
trays
themselves
to
not
break
the
visibility
on
the
tools
as
to
support
this
today,
because
yet
17k
just
for
not
even
tracking
a
unit
test.
Only
if
we
think
about
the
jenkins
core
build
how
many
unit
tests
do
we
have
many
thousands
yeah.
A
B
A
A
The
unit
test,
I
will
the
the
pipeline
phases.
I
will
capture
them
directly
in
my
observability
backend,
but
the
unit
test
I
will
reprocess
them.
I
think
this
time
I
will
reprocess
them
to
derive
them
into
different
things,
which
are
time
series
per
unit
test,
maybe
something
like
this
and
I
will
not
capture
them
as
traces.
B
A
A
C
A
A
We
just
omit
them
at
the
moment
is
what
we
are
discussing,
or
maybe
we
would
find
an
aggregation
if
I
remember
in
my
event,
there
is
a
a
coarser
grain
aggregation
which
are
the
life
cycle
phases
of
the.
Maybe
it's
the
idea,
but
it
was
an
interesting
problem
to
see
another
topic
that
I
identified
so.
A
A
A
The
names
of
many
metrics
in
urban
geometry
is
standardized
like
system
memory,
utilization
system,
paging
usage,
all
these
are
standardized
attributes,
standardized
metric
names,
and
the
benefit
is
that
whatever
is
the
observability
backend
you
integrate
with?
They
will
be
aware
of
this
metric
name
on
its
meaning,
and
so
they
will
be
able
to
provide
the
best
visualization
for
it.
A
A
A
A
A
So
here
yeah,
as
hotel
metrics
appears
their
goal.
Their
vision
is
that
they
will
replace
all
in
every
programming
language
in
java
it
would
be
micrometer
apis
on
drop,
wizard,
apis
and
so
on.
It
would
be
one
layer
on
top
of
another
on
top
of
another.
So
here
we
have
covered
many
metrics
on.
If,
if
when
we
looked
at
the.
A
C
A
C
Metrics
yeah
so
yeah
for
me,
metrics
plugin
is
another
question
in
terms
of
api,
so,
for
example,
if
other
plugins
want
to
contribute
to
events
and
traces
well,
yeah
trace
system
is
something
completely
different,
but
for
metrics
it
might
be
reasonable.
So,
for
example,
if
cloud
starts
plug-in
and
wants
to
contribute
some
metrics
currently
it
happens
through
metrics
api.
C
C
A
There
is
a
lot
of
value
for
a
project
like
jenkins
or
every
large
project,
with
modularity
to
standardize
to
provide
an
sdk
for
contributors
to
instrument
their
application,
collecting
logs
stressors
metrics
on
in
the
past,
the
sdk
to
collect
this
was
very
diverse.
You
had
a
logging
framework.
It
was
easy.
It
was
standardized,
but
for
metrics,
maybe
on
some
project
it
was
a
drop
wizard
mothers.
It
was
micrometers.
Some
some
now
have
decided
to
standardize
on
the
prometheus,
simple
client
on
four
traces.
C
C
A
C
So
yeah,
maybe
another
thing
which
could
be
potentially
discussed
in
terms
of
what's
next.
It
didn't
open.
Telemetry
cli
just
said
that
the
egyptian
images,
because
it
might
be
reasonable
to
consider
eating
open
telemetry
cli
to
standard
agent
images.
So,
for
example,
when
you
invoke
shell
step
etc,
it
can
implicitly
invoke
open,
telemetry,
cli.
A
A
C
A
B
Maintaining
the
ci
ecosystem
might
be
hard
sometimes,
so
they
want
more
visibility
and
insight
holistically.
What's
going
on
at
all
levels
for
them
is
when
they
apply
new
patches
in
the
ci
workers.
They
would
like
to
have
a
visibility
what's
going
on
in
that
particular
process,
or
when
there
is
a
miss
of
you
know,
working.