►
Description
Meetup details: https://www.meetup.com/Jenkins-online-meetup/events/257773927/
Happy New Year! It's been awhile since our last online meetup. To highlight some of the cool stuff our Jenkins contributors has been working on, we've asked Dr. Ullrich Hafner to share with us his latest project on the next generation warning plugins for Jenkins which is quite impressive as it dramatically improve user experience for static analysis results.
A
Hello:
everyone
welcome
to
a
Jenkins
online
me
up.
I'm
Leo,
Newman
I'm
joined
today
by
mark
weight
and
Ludi
Hoffner,
we'll
be
talking
about
the
static
analysis
plug
in
the
new
next-generation
version
of
it
for
the
for
Jenkins.
Before
we
get
started,
I
have
a
couple
of
announcements,
we'll
be
taking
questions.
If
you
have
any
going
on
at
home,
you
can
go
to
the
IRC
channel,
the
Jenkins
hashtag
Jenkins
IRC
channel,
or
also
on
the
Gator
channel
for
for
Jenkins
Jenkins,
ci,
Jenkins
and
I'll
be
keeping
track
of
that
and
asking
your
questions
as
needed.
A
Other
announcements,
the
CFP
for
DevOps
world
Jenkins
world
has
opened,
can
go
and
submit
your
your
talks
about
Jenkins,
similar
to
the
one
that
you're
going
to
hear
today.
If
you're,
using
Jenkins
for
cool
stuff
found
things
interesting,
that
you've
enjoyed
doing
or
have
some
big
challenges
that
you
solve
with
Jenkins
hop
on
hop
on
over
there
and
and
submit
your
talk
ideas
also
coming
up
there'll
be
a
bunch
of
activities
around
FOSDEM
at
the
beginning
of
February.
Just
before
fall,
then
we'll
be
doing
some
workshops
in
in
Brussels.
A
A
The
these
are
two
really
interesting
core
courses
if
you've
been
using
pipelines
for
a
while,
aren't
you
know
familiar
with
everything?
This
is
a
great
place
to
start
and
let's
see
what
else
I
think
that's
everything
beforehand.
So,
just
to
say
again,
we've
got
will
be
monitoring
the
Gator
and
IRC
channels
for
any
questions
and
Olli.
B
So
I
would
like
to
start
with
some
slides
so
that
everybody
gets
some
an
overview
of
my
plugins
and
then
I'll
show
you
the
plugins
in
detail
with
a
demo,
and
then
we
can
have
some
questions
or
you
can
have
the
questions
in
the
middle
of
the
talk.
Let's
see
and
start
so
the
static
analysis,
plugins
yeah,
a
typical
use
case
of
them
is
I.
B
Think
everybody
using
this
or
you
have
a
normal
at
chop
in
Jenkins,
where
you
check
out
your
code
and
you
compile
the
code
and
test
the
code
and
deploy
the
code.
And
if
you
do
this
without
my
plugins,
you
normally
use
a
console.
I
look
to
visualize
the
results
of
your
build,
and
then
you
see
the
test
results
in
the
chat.
You
need
view.
B
For
instance,
when
my
plugins
came
into
play,
what
they
are
doing,
they
take
the
console
log
and
replace
the
console
log
with
something
nice
and
beautiful,
like
the
test
results,
so
I'm,
taking
the
results
of
the
console,
a
lock
toss
them
with
some
pauses
and
then
present
the
results
in
a
detail
view.
So
this
is
one
aspect
of
my
plugin
and
we
can
generalize
this.
This
aspect
in
basically
I,
don't
own
I,
don't
only
scan
the
console
in
log
I
can
scan
everything
you
would
like
to
know.
B
So
you
can
can
check
star
warnings,
you
can
scan
spot
box,
result
chase
and
every
static
analysis
tool.
You
would
like
to
scan.
You
can
scan
with
my
tool
now.
Actually
we
have
now
almost
100
tools
recorded
actually
most
tools
being
supported
by
some
volunteers.
So
it's
always
good.
If
you
have
a
new
tool
which
you
would
like
to
have
support
for,
for,
please
provide
a
pull
request
and
I
will
integrate
it
into
this
tool.
B
So
the
analogy
is
sweet.
The
oil
system
consists
of
about
yeah,
10
or
12
plugins,
which
basically
provided
results
for
Android
textile
spot
parts,
warnings,
PMD
and
so
on.
They
have
been
provided
by
individual
plugins,
so
one
thing
for
users.
This
was
a
little
bit
difficult
and
for
me,
as
a
developer
of
these
tools,
it
was
also
a
little
bit
complicated.
B
This
has
the
advantage
that
I'm
using
a
new
plug-in
I,
can
drop
all
these
dependencies.
I
don't
need
any
more
and
I.
Don't
need
to
look
for
backward
compatibility
compatibility.
So
the
new
plug-in
now
consists
of
these
new
process,
which
are
support,
yeah,
almost
100
different
tools.
So
that's
the
background
for
the
plug-in
and
what
I
would
like
to
show.
You
are
now
some
new
features
of
the
new
plugins
and
these
features
I
think
are
best
shown
and
on
a
real
instance.
B
B
A
B
A
B
B
B
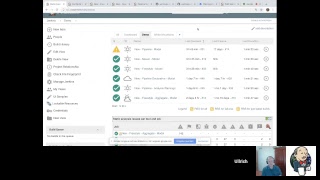
So
in
order
to
see
the
results
of
the
plugins,
you
need,
for
instance,
to
go
to
a
top
and
click
on
the
top,
and
if
you
open
the
top,
you
will
see
the
first
results
of
my
plugins
on
the
left
side.
You
see
the
links
to
the
results,
so
you
see
the
build
now
button
and
now
you
see
travel
warnings,
error-prone
warnings,
checks,
Taiwan
is
these
are
the
ones
you
need
to
configure
in
your
build
so
I'm
building
with
Chama.
So
there
are
a
lot
of
tools
available
that
can
be
rendered
with
my
plugins.
B
If
you're
using
textile
or
JavaScript,
you
get
only
one
link,
for
instance,
with
your
results
so
from
here
you
can
navigate
to
the
results
of
the
latest
build
and
what
you
also
see
on
the
top-level
page
of
a
job.
You
see
the
trend
chance,
so
you
see
how
you
are
warnings
behave
over
the
builds,
so
you'll
see
then
mornings
increased
a
lot,
and
yes,
sometimes
I
have
some
more
time
to
make
some
clean
code.
Then
I
reduce
the
warning.
B
So
so
you
can
see
here
a
trend
of
all
these
tools,
for
they
are
configured
in
your
system.
This
is
one
of
the
new
things
at
the
trend.
Chance
I'm
using
here
not
generated
on
the
client-side
using
javascript
libraries,
and
this
is
the
test
with
soy
trend.
This
is
still
the
old
type
of
charts.
These
are
generated
on
the
champions
master,
so
I
think
having
them
on.
The
client-side
is
a
little
bit
better
because
yeah,
you
have
better
frameworks
to
use
and
what
I'm
going
to
add
in
future
releases
is.
B
B
So
we
have
the
test
results
and
now
here
for
every
tool,
I'm
having
you
see
one
of
these
boxes,
where
you
see
an
overview
of
the
warnings
of
the
special
tool,
so,
for
instance,
error-prone
we
have
15,
one
is
check,
start,
1,
warning
and
so
on.
So
you
see
for
every
tool.
You
get
one
of
these
boxes.
If
you
want
what
you
can
also
have,
this
is
here
for
Chama.
You
can
also
have
a
box
or
a
result.
B
So
on
this
page,
you
have
links
to
the
results,
so
I'll
follow
the
link
a
little
bit
in
a
moment.
So
what
we
also
see?
We
have
some
kind
of
icons
here
here
we
have
a
quality
guide.
That
means
this
bill
is
unstable.
This
is
a
feature
of
the
plug-in
which
I
already
had
in
the
old
version.
That
means
you
can
create
a
quality
gates
for
a
built
and
say.
Ok.
B
B
If
you
have
such
a
quality
gate,
you
also
see
of
the
reference
bill.
That
means,
if
you
compute
new
warnings,
you
must
say
new
to
what
and
what
is
the
number
of
the
build
we
am
using.
So
here,
for
instance,
I
have
reference,
build
that
in
number
27
and
here's
a
reference
build
a
number
30,
so
the
plug-in
is
capable
of
deciding
which
is
the
best.
A
reference
build
and
computes
the
new
one
is
based
on
these
reference
builds
the
details
about
choosing
a
reference.
Build
are
quite
complicated,
so
drop
that
for
a
moment.
B
So
if
you
have
later
some
questions,
I
can
go
into
more
detail
on
how
this
reference
build
is
computed.
So
what
we
also
have
is
this
small
I
can
here
with
an
info
or
a
narrower.
So
normally
you
look
into
the
console
a
lock
every
time
you
want
to
see
something
important
for
a
plug-in,
I
integrated
it
now
into
the
plug-in.
So
you
see
every
console
a
lot
messages
from
my
plug-in
are
shown
on
an
individual
screen,
so
you
don't
need
to
go
to
the
console,
I
log
and
scan
for
error
prone.
B
You
just
have
the
warnings
here
what's
going
on
and
what
happened.
So
these
are
the
information
things.
Sorry
and
if
you
want
to
see
the
results,
you
need
to
click
the
main
link
here
and
then
you
are
navigated
to
the
results
of
the
analysis,
and
here
we
have
the
error
prone
compiler,
which
shows
the
warnings
which
are
in
my
billet.
Now
these
results
are
split
into
three
parts.
B
Diagram
which
shows
the
new
outstanding
and
fixed
warnings,
so
here
it's
a
little
bit
boring.
We
have
only
oh
it
warnings
which
have
been
in
the
previous
build
as
well,
but
if
you
have
new
warnings,
I
think
I
have
it
for
textile
yeah.
You
see
it's
it's
red.
That
means
the
previous
build.
We
had
no
warning
and
now
in
the
wrapper
in
this
build,
we
have
one
new
warning.
B
A
B
A
B
B
It
sounds
simple,
but
if
you
look
at
it
a
little
bit
more
in
detail,
you
will
see
it's
not
so
simple,
the
cost,
so
the
problem
is,
and
that
is
not
yet
implemented
and
I'm,
not
sure
if
it's
doable
at
all.
So
if
we
have
builds
on
the
master,
they
contain
a
lot
of
subsequent
commits
so
not
for
every
commit.
B
C
B
This
is
by
the
way
one
thing
I
would
like
to
have
a
student
for
working
on
it.
If
we
should
get
this
even
better
to
compute
something
that
we
maybe
we
build
two
times
so
we
build
with
a
commit
branch
point,
and
then
we
build
with
a
pull
request,
final
presence
and
compute
the
data.
That
means
we
need
to
put
two
bills,
but
if
we
actually
do
these
two
bills,
we
will
get
results
which
are
correct
and
currently
the
other
results
are
correct,
the
most
time,
but
not
every
time.
B
So
maybe
that
is
also
interesting,
I'm
switching
to
the
configuration,
so
we
see
how
we
can
choose
to
the
reference
build.
So
it's
a
little
bit
scrolling
because
it's
here
this
is
a
freestyle
configuration
of
the
same
job.
So
if
you
configure
your
job-
and
there
is
this
section
called
reference
analysis-
and
here
you
can
select
the
reference
job.
B
So
here
you
can
select
one
of
these
chops
where
your
master
is
building
and
the
plug-in
chooses
the
best
result
of
this
master
job
and
the
best
result
depends
so
I
have
two
options
to
select
the
best
result,
so
you
can,
for
instance,
you
can
ignore
failures
and
look.
Only
a
fun
set.
Successful
builds
and
you
also
can
select
if
the
master
build
should
take
the
previous
build
from
the
master
or
the
previous
build.
That
has
been
interests
and
status
of
successful.
B
So
these
are
some
options
you
can
use
to
select
the
reference
build
so
get
back
to
the
result.
Let's
go
to
error-prone
because
there
was
a
little
bit
more
warnings.
So
here
we
have
some
yeah
charts.
The
history
is
also
visible
here:
I'm
using
bootstrap
to
visualize
the
results.
That
means
I
now
have
the
capability
to
use
some
rendering,
which
is
different.
If
your
screen
is
larger
or
screen
is
on
of
your
mobile
phone,
the
support
is,
they
are,
but
I
have
not
yet
the
time
to
implement
something.
B
So
currently
everybody
sees
the
same
page
if
it's
on
a
big
screen
or
a
small
screen,
but
I'm.
What
I'm
going
to
add
is
if
you
have
a
really
large
screeners
I'm,
not
really
using.
Maybe
we
can
have
three
of
them
or
the
history
is
larger
than
the
overview.
This
is
sent,
something
which
is
called
responsive
design
which
still
needs
to
be
implemented.
B
Exactly
so,
I
had
a
bachelor
thesis
which
we
called
a
little
bit
evaluating
some
UI
frameworks
and
we
wanted
to
evaluate
them
on
a
real
project.
So
we
chose
at
Jenkins
or
my
Jenkins
plugins,
and
we
tried
to
replace
the
old
user
interface,
which
is
yeah
quite
old-school.
Let's
say
in
Jenkins
with
something
new
and
as
a
student
replaced
and
added
these
detail
views
to
the
plugins
that
that's
really
cool.
You.
A
Know
all
the
initiative
and
a
number
of
other
people
are
working
on
doing
google
Summer
of
Code.
If
you
have
any
things
that
you're
talking
about
I
want
to
add
this
I
want
that
the
this
would
that
be
a
great
opportunity
to
maybe
submit
a
project
to
that
and
see
if
someone's
interested
in
doing
that.
D
A
C
Maybe
not
right
now,
but
I
would
love
to
hear
any
any
insight
you
have
if
we've
got
time
at
the
end
of
the
presentation
about
your
experience
developing
inside
the
Jenkins
infrastructure
with
something
that
to
me
looks
quite
quite
different
than
how
Jenkins
usually
does
UI
components.
So
that's
not
really
the
warnings
plug-in
per
se,
I
guess
but
I'm
fascinated
by
what
you've
done.
That's
really
an
amazing
piece
of
work.
Mm-Hmm
yep.
B
B
If
you
have
a
lot
of
issues,
you
can
navigate
into
the
packages
or
types
of
files,
so
you
can
sort
out
the
interesting
ones
and,
for
instance,
I
would
like
to
see
these
issues.
Then
I
can
navigate
here,
and
you
see
here
at
the
top
I'm
navigating
into
this
subfolder,
let's
say,
and
then
you
see
only
the
details
of
these
issues.
B
B
What
I'm
also
considering
is
to
replace
this
thing
here
to
a
detail
tab
here
at
the
top,
but
I'm
not
sure
if
that
makes
sense.
So
what
I
also
use
we
use
here,
a
new
table
and
a
JavaScript
table,
which
makes
sense
mostly
here
for
the
issues
here-
are
all
these
issues.
I
have
found
my
build
this
table,
which
is
something
new.
You
can
search
for
something
much.
B
Searched
for
characters,
and
then
you
see
something-
and
this
is
something
I
did
not
click
program
at
all.
It's
just
a
JavaScript
library,
I
take,
took
and
said:
ok,
let's
apply
it
to
Jenkins
and
it
worked
out
of
the
box.
So
what
we
have
sorting
and
things
like
that
that
works
just
out
of
the
box
without
any
great
programming
which
would
share,
which
libraries
that
it's
data
tables
for
such
a
query,
data
table
so
and
or
I
have
should
have
said
it
normally
works
out
of
the
box
in
Jenkins.
B
B
B
Currently,
the
pagination
is
rendered
on
the
client
side.
This
works
well
for
my
projects.
I,
don't
have
so
much
warnings,
but
I
already
had
some
bug
reports
where
people
have
ten
thousands
of
morning's
and
then
we
should
implement
pagination
on
the
server.
That
means
we
don't
we
shouldn't,
read
everyone
10,000
issues
at
once
so,
but
that
still
needs
to
be
done.
B
B
Every
element
here
is
clickable,
so
you
can
show
all
issues
in
this
package,
so
you
see
only
the
issues
in
this
package
and
you
can
only
select
the
type
and
so
on.
What
you
also
see
is
you
can
open
some
details
for
each
issue
and
the
details
you
see
are
a
little
bit.
You
depend
on
the
tool,
so
here
we
have
error
prone.
B
These
details,
which
are
shown
below
the
warnings-
these
are,
let's
say,
hard-coded.
That
means
for
these
100
tools.
I,
have
you
need
to
provide
the
information
for
each
tool
by
programming
so
by
programming
in
error
prone?
It
was
quite
easy.
It's
just
a
link
which
was
on
the
console.
I
can
show
for
fine
packs,
textile
and
PMD
I'm,
using
some
descriptions
from
the
projects
and
for
all
other
tools.
You
don't
have
anything
so
if
you
have
a
tool
that
has
a
lot
of
descriptions
on
a
webpage
feel
free
to
create
a
pull
request.
B
So
we
can
include
these
information
also
here
in
Jenkins,
so
okay
I
started.
We
have
aggregation
about
types
files,
you
see
the
issues
and
what
we
also
have-
and
this
is
as
well
as
student
work.
One
of
my
students
had
on
bachelor
thesis
about
integrating
the
get
lock
or
get
blame
with
the
warnings.
That
means
for
each
one.
B
B
A
B
Is
also
a
not
work
by
student
by
the
work
of
a
volunteer
we,
you
can
also
navigate
to
the
warning
itself.
That
means
we
have.
The
source
code
is
also
visible
where
this
warning
occurred
and
this
display-
or
this
view
is
also
new,
and
this
view
also
uses
a
JavaScript
library,
prison,
no
chess,
and
now
we
have
a
syntax
highlighting
for
every
language,
not
only
Java
I
think
it's
over
100
languages,
our
support
now
and
you
have
a
highlighting
of
the
warning
here
and
you
can
also
see
okay.
B
B
B
B
If
you
are
interested
in
the
mornings,
maybe
because
you
want
to
write
mails
to
somebody
or
you
want
to
extract
them,
you
can
create
with
the
REST
API
a
list
of
all
issues
means
you
have
for
every
issue
here.
We
have
two
issues.
You
have
the
possibility
to
extract
everything
to
REST
API,
and
this
is
something
what
I'm
using
with
on
student.
Currently,
he
is
writing
an
application.
B
B
What
is
this
for
a
fire
is
how
many
commits
has
this
file
or
how
many
authors
worked
on
this
file,
so
some
warnings
or
the
same
warning
may
be
quite
different
if
there
are
100
people
working
on
the
same
file
or
if
you
have
a
warning
in
a
file
which
is
added
to
just
by
a
single
person,
it
doesn't
really
care
if
there
is
a
warning.
So
these
are
information
I'm
currently
trying
to
acquire
with
a
new
master
thesis.
A
B
B
If
the
rest
api,
where
you
see
the
information
of
the
issues
that
is
already
existing,
the
combination
with
git
is
not
existing,
yet
no
work
in
progress.
So
we
are
still
writing
and
separate
application,
which
is
reading.
Kenkon,
Stata
and
reading
get
data
and
combining
the
result.
And
if
the
master
thesis
is
ready
to
go
live
then
we
need
to
pull
it
back
and
into
the
Jenkins
plugin,
but
with
sweet,
sometimes
interesting,
interesting
yeah.
So.
C
D
B
B
B
Sorry,
a
record
issues
is
the
command
of
basically
in
step
or
actually
it's
a
freestyle
post,
stop
a
post
step
publisher
and
it
is
available
in
the
step
as
well,
and
then
you
have
some
flags
and
basically
we
have
20
different
flags,
because
plugin
is
getting
complex
and
even
complex,
and
but
the
main
interesting
thing
is
used,
you
need
to
say,
okay,
which
tool
I
want
to
pass.
So
here
we
have
a
symbol
and
for
each
of
the
tools
I
have
you
must
select
the
corresponding
sender.
B
So
if
you
want
to
pass
in
the
Maven
console
in
lock,
you
need
the
tool
consoling.
Look.
If
you
say
you
want
to
set
C
the
Java
warnings
of
the
Java
compiler.
You
need
that
you
can
put
multiple
tools,
then
you
need
here
the
tools.
If
you
want
want
to
really
take
this
step,
and
you
also
sometimes
it
depends
a
little
bit
on
your
configuration
need
to
provide
the
encoding
of
source
files
because
the
source
files
are
visualized
afterwards,
you
need
to
provide
the
encoding
of
the
report
files.
B
There
are
a
lot
of
parameters
you
can
use,
but
the
new
thing
is
that
we
in
the
plugins,
you
had
something
like
find
facts,
etc.
This
is
now
replaced
with
a
single
step,
and
the
thing
which
is
variable
is
the
tool
which
you
give.
Yes,
for
instance,
you
say:
ok,
this
is
check
start
with
a
pattern
target
check
style
and
even
the
open
tasks
cannot
it's
a
little
bit
more
complicated.
You
can
say:
okay,
which
files
I
want
to
scan
for
to
deuce
I
scan
for
Java
files.
I
don't
want
to
scan
in
the
target.
B
C
C
B
A
B
D
A
B
A
You
know,
Jesse
was
actually
Jessica's
I'm
get
her
talking
about
this
and
he
actually
commented
about
that.
There's
a
bug
for
the
for
the
editor
window,
resizing
already,
of
course,
so
any
help
people
want
to
hop
in
on
that.
I'll
include
that
in
some
of
the
links
that
we
do
out
of
this,
but
that's
also,
it
was
interesting
to
see
it.
I
mean
from
from
a
Jenkins
developers
perch.
B
B
If
you
have
a
pipeline
and
want
to
configure
it,
and
some
people
have
different
ideas
on
this-
is
from
death.
Okay,
that
Mela,
you
can
split
this
command.
The
record
come
out
into
two
commands
where
you
can
create
issues
and
then
publish
issues,
so
you
can,
if
you're
working
in
parallel,
you
can
even
split
this
step
into
two
steps
to
have
some
special
requirements.
A
B
Every
parameter
you
can
choose
from
three
starters:
you
can
also
choose
in
pipelines,
awesome
great
right.
It
is
something
you
get
out
of
the
box,
so
I
did
not
do
anything
for
it.
So
I
have
just
provided
a
publisher
which
works
for
freestyle
pills
and
I
just
need
to
implement
one
interface,
and
then
everything
is
working
out
of
box
for
pipelines
right.
B
This
is
a
slight,
let's
jump
into
it.
So
what
you've
seen
now
is
this
pipeline
support,
the
simple
mode
where
you
have
scanning
for
warnings
and
the
publishing
are
two
different
things,
but
if
you
use
these
free
card
issues
command,
you
get
everything
in
one
place
and
some
projects
want
to
use
an
advanced
mode.
That
means
you
can
scan
in
different
parallel
steps,
and
you
want
to
publish
only
one
report
and
you
or
you
want
to
compile
for
Ubuntu
and
compile
for
other
Linux
systems,
and
then
you
want
only
a
single
report.
B
D
B
C
B
A
plugin
now
the
dashboard
view
I'm,
using
very
often
in
projects
which
contains
several
types,
or
you
see
the
tests,
the
analysis,
everything
is
aggregated
and
the
thing
is
but
few
plug-in,
which
hang
here
so
I
think
yeah
I
have
supported
the
token
macro.
If
you
need
that,
so
some
small
things
are
in
the
plugins,
you
yeah,
you
actually
don't
see,
they
are
just
there.
I
think
one
thing:
let's
see
what
happened?
Okay,
one
thing:
I
talked
the
packing
already
supports
100
different
tools.
B
If
your
tool
is
not
supported,
you
have
a
to
base
to
support
it.
One
way
is
to
write
a
new
plugin
and
provide
a
Java
parser
for
this
tool.
It
should
be
quite
simple
and
it's
even
simpler.
If
you
have
a
simple
format,
you
can
define
a
parser
on
the
come
on
the
user
interface,
so
you
I
have
in
the
Jenkins
system
configuration
you
can
define
new
passes
where
you
have
to
define
a
name
and
an
ID,
and
then
you
have
an
regular
expression,
some
kind
of
groovy
script,
and
then
you
can
pass
for
instance.
B
A
C
B
Actually
I
program
it
that
way
that
there
is
they
can
coexist,
so
you
can
have
in
one
chop
the
results
of
the
monix
tracking
handle
results
of
the
warnings
next
generation
plug-in
so
used.
You
always
will
see
the
audit
results.
I
think
it
was
necessary
because
it
it
you
know
it
takes
a
lot
of
time
to
write
a
my
creation
of
the
old
data
and
I
did
not
find
the
time
to
do
that.
So
it's
still
was
able
to
use
both
things.
B
It's
a
one
thing
or
one
problem
we
haven't
Jenkins,
is
that
we
have
the
problem
of
symbols
with
the
same
name
and
I
think
we
already
had
this
problem
in
the
PMD
plug-in
and
I
think
the
Android
lint
cracking.
They
used
the
same
symbol
on
step.
So
then
the
parser
of
the
decorative
pipelines,
yeah
don't
work
anymore.
So
if
you
continue
to
use
the
Android
lint
plug-in
and
my
plugin
altogether
and
in
parallel
it's
a
little
bit
complicated
because
you
sometimes
get
problems,
but
others.
C
Alright,
so
some
of
the
old
plugins
may
not
make
it
easy
to
coexist.
I
know:
I
didn't
encounter
any
problems
personally,
but
it
sounds
like
you
found
some
some
sort
of
in
each
cases
or
corner
cases
where
a
prior
plug-in
and
the
new
clog
in
they
have
some
conflict
that
a
user
or
administrator
may
detect
yeah.
C
B
I
think
this
is
a
separate
topic
when
I
started
writing
the
new
extensions
I
wanted
to
do
it
with
blue
ocean,
but
actually
I
asked
a
lot
of
times
in
the
mailing
list
if
they
are
ready
for
extension,
but
I
think
they
are
still
not
ready
for
extension.
So
there
isn't,
there
isn't
yeah
I
think
they
wanted
to
make
something
that
is
extendable,
but
it's
not
yet
finished
and
I'm
not
sure
if
it's
feasible
at
all,
so
blue
ocean
makes
a
total
different
model.
B
Yeah
I
think
one
or
a
good
way
to
integrate
these
new
libraries
would
be
to
provide
some
kind
of
new
user
interface
plug-in,
which
provides
these
libraries.
Currently
everything
is
coded
into
my
plugin.
So
if,
if
you
want
to
use
these
libraries,
you
either
either
need
to
include
it
in
your
plugin
or
yeah,
you
can't
use
it
from
my
plugin,
so
this
is
a
little
bit
complicated
and
I
think
this
is
where
the
work
really
starts.
B
A
Am
so
impressed,
thank
you,
yeah
I'm,
and
really
it
what's
what's
interesting
to
me
about
this
is
the
level
of
like
this
plugin
is
really
great
and
does
great
stuff,
and
that
that's
you
know
it's
a
whole
next
generation
of
this
this
work
and
yet,
at
the
same
time
like
you,
could
have
a
whole
nother.
We
have
a
whole
nother
online
Meetup
just
about
the
work
that
you
did
to
add.
Add
these
very
add
the
some
these
technologies
that
you're
using
in
there
on
just
going
to
do
just
just
that
on
its
own
mm-hmm.
D
B
Yeah,
even
the
trend
charts,
for
instance,
these
are
called
hard-coded
in
my
plugin,
but
it
would
be
I
think
really
useful
if
we
have
a
trend
chart
plug-in
which
is
configurable
using
some
kind
of
API,
where
you
can
create
these
nice
charts,
and
these
just
worked
out
of
the
box,
you
have
configuration
on
the
client-side
etc.
This
is
nothing
which
should
be
part
of
my
plugin.
It
should
be
part
of
a
greater
plugin,
so
yeah,
absolutely
yeah.
There
are
client
programmers
available
feel
free
to
join.
A
All
right,
well,
I,
think
that's
that's
almost
our
time
and
also
also
what
we're
we
have
to
work
on
talked
about
for
the
day.
I
will
include
links
to
a
bunch
of
this
stuff
that
we
talked
about,
and
hopefully
the
slides
as
well
in
the
in
the
description
of
the
the
video
and
Lewton
thanks
so
much
for
being
here
and
and
presenting
this
really
really
great.