►
From YouTube: 2020 06 03 GSoC Git Plugin Performance Project
Description
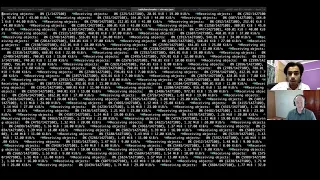
Jenkins and Google Summer of Code meeting of the git plugin performance improvement project. Rishabh showed how he has been able to cut benchmark execution time in half by changing the initialization sequence and showed how he has used Java Flight Recorder to confirm that the 'git fetch" command is the dominant part of operations with large repositories.
B
A
B
Okay,
that's
great
so
so
I
I
did
this
with
the
local
linux
instance.
I
have
the
same
thing,
so
I'm
going
to
show
you
first,
the
change
I
I
perform
so
so
in
a
benchmark
test.
If
you
can
see
here,
we
can
divide
the
benchmark
tests
into
two
into
two
parts.
The
this
is
the
part
which
is
important
to
us,
which
is
where
we're
testing.
This
is
a
benchmark,
we're
testing
this,
whatever
we
want
to
test
the
operation
inside
this
function
before
this.
B
All
of
this
is
this
is
a
place
where
we
it's
it's
the
overhead
cost
of
three
of
performing
this
operation,
so
the
previous
gsoc
project,
the
the
role
strategy
plug-in
guys
they
what
they
did
they
they
created
a
state,
a
static
class
of
the
a
customer,
a
customizable
state
which
is
which
is
called
jenkins
state,
which
I
can
yeah
I
can.
I
can
take
it
from
the
test
harness
it's
available
there,
so
the
jenkins
state
what
it
does
is.
B
If,
if
one
of
any
of
my
operations
use
uses
jenkins
instance
for
our
operation
for
gate
operations,
I
believe
we
don't
need
a
jenkins
instance
right
now,
so
that
or
we
will
not
need
it
because
we're
comparing
click
it
and
jk.
So
so
with
the
state,
the
stat,
so
a
state
is
a
static
class
and
what
happens
is
so.
We
have
two
functions
inside
two
methods
inside
this
class
which
we
which
we
use
to
create
and
then
destroy
whatever
operations.
B
Whatever
variables
we've
created,
so
the
scope
I've
set
for
this
is
iteration.
It's
actually.
I
needed
a
combination.
So
what
so?
What
is
happening
is.
Let
me
let
me
rephrase
everything,
so
I
have
two
states
now
I
had
one
state,
so
what
I
needed
was
I
needed
a
git
client.
I
need,
I
need
a
new
git
client
for
each
operation
and
that
click
git
client
should.
B
I
should
have
a
fresh
local
repository
for
for
it
to
fetch
or
clone
or
do
anything
it
should
it
that
should
be
fresh
for
each
invocation
of
the
bench
benchmark.
It
should
not.
They
should
not
share
that
that
local
repository,
which
which
is
used
to
make
the
git
client
so
so
that
means
that
I
need
to
invoke
the
setup
function
at
each
iteration.
B
But
if
I
have
just
one
state
where
I'm
also
cloning,
the
upstream
repository
and
then
providing
it
to
the
client
it,
that
was
what
which
was
making
our
benchmarks.
The
duration
was
too,
it
was
too
long.
So
so
I
I
read
the
documentation,
and
I
and
some-
and
I
got
to
understand
that
I
can
create
multiple
states
for
multiple
scopes.
B
For
my
for
an
example,
I
created
a
new
state
called
clone
repos
state,
so
this
state
is
specifically
it's
it's
created
for
providing
the
client
with
the
with
the
upstream
repositories,
a
local
clone
of
the
upstream
repository,
the
four
repositories
we
we
need
to
benchmark
the
get
fetch
client
so
operation,
so
so
this
so
this
state
it
basically
runs
for
a
trial.
The
scope
is
style.
B
The
trial
is
it's,
it's
the
number
of
times,
I'm
going
to
run
the
benchmark
for
one
fork
of
the
jvm,
so
so
so
now
what
happens
is
so
I'm
going
to
show
you
how
the
results
the
the
new
way
we
are
generating
the
results.
Now
this
is
how
the
results
are
going
to
look
if
you
now,
if
you
check
the
the
json
file
in
the
artifacts,
this
is
how
they're
going
to
look
so
the
firs.
The
first
thing
it's
going
to
tell
you
is
the
parameters
we
have
set.
B
The
first
is
we're
testing
it
for
get
for
a
particular
repo,
which
is
the
first
url
we
have
so
I
have
set
2
4,
which
means
the
the
process
of
benchmarking,
the
iterations.
We
have
it's
going
to
run
twice
and
for
the
first
book
you
can
see
the
default
iterations
for
warm-up
are
five,
and
then
we
have
five
iterations
where
we're
measuring
the
git
operation,
so
it
also
tells
what
the
execution
time
for
each
iteration.
So
it's
really
helpful
to
go
along
now.
A
a
side
note
here.
B
One
thing
I
noticed
yesterday
was
this:
these
results
are
seeing
right
now.
It's
it's
from
my
local
machine,
my
macbook,
which
seems
pretty
different
from
what
the
results
we've
been
seeing.
So
this
is
like
50
millisecond
per
operation
for
a
less
than
1
mb
repository.
So
I
so,
and
then,
if
I
compare
it
with
the
results
of
my
linux
instance,
it's
it's
clearly
very
different.
This
is
from
my
linux
instance.
B
If
you
can
see
the
the
iterations
are
in
the
order
of
98
milliseconds
and
this
in
a
macbook,
it's
it's
it's
much
more
than
that.
So
I
kind
of
understood
the
importance
of
not
relying
on
the
results
from
my
local
machine
because
and
the
reason
I
think
this
this
is
happening
is
because
I
was
actually
running
the
jmh
benchmarks,
as
well
as
profiling.
B
A
Here
do
we
have
a
question?
I
I'm
not
even
sure
I
called
it
skewed.
I
think
your
experience
on
your
mac
os
is
every
bit
as
valid
as
the
experience
on
linux,
but
it
hints
that
there
are
many-
and
this
is
a
good
thing-
that
you're
already
showing
there
are
many
different
things
that
affect
the
the
performance
of
an
operation
on
your
mac.
A
I
assume
it's
affected
by
the
max
choice
of
file
system
and
the
max
choice
of
of
of
how
they
operate
against
files,
they're,
probably
closer
to
the
freebsd
type
people
where
they
say
look
preserving
your
data
is
the
biggest
most
powerful
thing.
We
must
do
and
they're
willing
to
slow
down
file
operations
a
little
bit
to
do
it.
A
B
Yeah,
so
so,
then
I
and
one
more
thing
I
saw
with
the
local
machine
tests
I
was
I
was
running-
was
that
at
some
point
at
the
time
one
of
the
tests
when
it
was
cloning,
the
300
mb
repository
the
the
test.
It
gave
me
an
exception
when,
when
it
was
fetching
the
repository
so,
which
is
something
I
I
think
it
was
it
was
down,
it
was
enumerating
objects
in
in
between
it
was
interrupted,
and-
and
I
and
I
try
to-
I
try
to
search
what
was
the
problem
here.
B
What
could
have
happened
and
as
far
as
I
can
understand,
this
is
because
of
the
net
network,
or
probably
this
is
because
of
the
network.
So
this
is.
This
is
a
concern
I
possibly
we
could
have
that
our
benchmark
is
going
to
rely
on
the
network.
A
lot
and
stability
is
going
to
rely
on,
although
with
the
linux
instance
or
on
the
ci
jenkins,
I've
never
seen
it
fail,
but
with
my
local
machine,
I've
seen
it
fail
once
or
twice
so
it's
maybe.
B
A
And
I've
seen
failures
like
this,
and
and
so
so
this
is
what
you're
seeing
is
looks
similar
to
things
that
I'd
seen
and
for
me
it's
another
hint
running
in
multiple
locations
and
collecting
the
results
will
give
us
will
increase
our
chances
of
detecting
these
kind
of
failures.
I
can't
predict
why
they're
failing
because
to
me
it
seems
like
well,
if
and
oh,
oh,
it's
clone
upstream
yeah,
okay.
B
Yeah,
so
this
is
one
of
the
things
I
also
saw,
and
so
these
are
the
results
from
my
linux
instance
now.
So,
as
you
can
see,
we
have
two
forks
and
it
calculates
for
a
particular
repository
the
results,
and
then
it
gives
us-
and
I
was
also
talking
about-
if
you
remember,
mark
confidence,
interval
providing
and
it
calculates
all
of
that
it
does
does
for
for
us.
It
assumes
it
as
a
normal
distribution
and.
A
Yeah
now
good
thing
that
you
include
the
the
data
there
on
the
jvm,
the
jvm
version
you're
running
on
that
linux
machine
is
quite
a
bit
out
of
date,
so
java
jdk
1.80
underscore
131
is
about
two
years
out
of
date.
If
I
remember
correctly-
and
there
were
major
changes
to
the
java
8
environments
about-
or
there
were
important
changes-
major-
maybe
the
wrong
word,
but
there
were
important
changes
at
about
180
and
we're
now
at
252.
A
A
I
was
not
concerned
about
different
versions
of
the
jdk
just
because,
if
someone's
not
running
the
current
version
of
the
jdk
one
of
the
first
acts
we'll
tell
them
is
run
the
current
jdk
telling
someone.
Oh
we're
going
to
do
special
effort
to
support
an
outdated
jdk,
I'm
not
willing
to
make
that
special
effort.
Personally,
I
barely
am
willing
to
make
the
effort
to
support
all
the
different
versions
of
command
line
kit
that
we
support.
B
Okay,
okay,
so
so,
as
I
was
saying
so
we
can,
you
can
see
the
progress
of
bit
by
bit
each
each
step
with
each
repo
url
it
takes
outer
pro.
It
takes
an
outer
product
of
the
parameters,
so
we
have
gate
and
jet,
and
then
we
have
another
parameter
which
is
which
are
the
four
repo
urls.
So
it's
going
to
step.
A
On
that
one,
it
looks
like
pretty
consistently
the
the
variability
during
the
warm-up
iteration
and
during
the
iteration
is
not
huge
when,
as
I
just
look
at
those
numbers,
the
the
warm-up
iteration
stays
in
this
case
within
a
within
easily
a
millisecond
of
each
other.
In
fact
much
less
than
that.
They're,
like
two-tenths
of
a
millisecond
of
each
other
and
likewise
for
the
actual
iteration,
so
good
that
nice
to
see
that
the
data
feels
right.
B
A
Okay
and
now
that
all
right-
that's
that's
okay!
So
so
this
is-
and
that's
that's!
Okay
and
you
would
you
had
told
me
that
earlier
that
you
had
seen
this,
this
really
reinforces
it
that
absolutely
there,
the
preheat
phase,
the
warm-up
iteration,
is
crucial
for
getting
believable
and
repeatable
j
get
results,
and
it
may
indicate
that
we
need
to
forewarn
people
if
they're,
using
a
one-shot
executor.
A
B
Jk
does
not
because,
and
in
the
end
we
have
the
results
the
average
result.
So
right
now
you
were
seeing
individual
results,
and
now
we
have
the
average
results
for
the
two
folks.
Ideally,
when
I
was
reading
about
performance
benchmarking
in
general,
they
the
jmh
the
developers,
they
said
they
were
recommending
that
we
should
have
as
much
folks
as
possible.
B
They're
also
saying
someone's
saying
the
five
folks
is
is
a
good
number,
so
we
we
have
more
observations
and
does
our
data
is
probably
more
reliable,
but
it's
something
I
think
with
our
test
currently
the
way
it's
configured,
it's
going
to
add
a
lot
of
time.
It's
basically
going
to
double
the
time
because
we're
cloning,
the
repositories,
so
it's
something
we
might
have
to
think
about,
because
this
this
is.
I
think
this
is
a
hyper
parameter,
the
the
number
of
folks
we
want
to
create.
B
We
want
to
select,
because
it's
not
something
we
can
decide
it's
it's
not
correlated
to
get
operations,
but
it's
something
we
need
to.
We
need
to
experimentally
test
and
find
a
good
number,
so
it's
a
parameter
where
we
need
to
experiment,
maybe
with
one
and
then
two
and
three
and
four
and
five
and
then
see:
where
are
we
getting
the
best
results?
B
So
so
I
think
I
should
differentiate
parameters
with
hyper
parameters,
parameters
which
are
something
we
can
only
where
we're
sure
about
them
once
we
experiment
with
those
parameters-
and
I
think
we
have
a
lot
of
gmh
parameters
in
that
sense,
like
the
number
of
iterations
we
are
performing,
so
we
have
five
warm-up,
iterations
five,
the
execution
iterations.
We
can
change
that
number.
We
can
have
ten
warm-up,
ten
normal
iterations.
A
And
you,
it
seems,
like
you,
have
data
here
that
might
even
guide
your
decision
there.
So
so
just
this
as
I
look
at,
for
instance,
the
on
your
screen,
now
we've
got
the
warm-up
iteration
one,
two,
three,
four:
five
and
notice
how
already
after
iteration
two
so
from
three
through
five,
the
variation
is
becomes
minimal
right.
It's
as,
as
I
see
warm
up,
iteration
one,
two,
two,
three,
nine
iteration,
two,
two
three
six
and
now
we're
at
two
three
one:
eight
and
two:
three:
zero,
nine
and
two
three
one:
two.
A
A
A
B
A
B
B
A
Yeah
so
in
terms
of
variability
right
right,
right,
interesting,
okay,
so
so
there's
yeah.
So
I
think
you
have
the
right
question.
I
don't
think
we
have
the
answer.
Yet.
The
question
is
how
many
warm-up
iterations
do
we
need
and
what
are
the
things
that
control
the
warm-up?
How
many
iterations
we
should
use
is
it?
Is
it
the
size
of
the
repository?
B
I
get
to
understand
how
many
iterations
we
would
need
once
I'm
seeing
a
constant
amount
of.
If
there's
no
variance,
then
we
understand
that
okay,
these
are
the
number
of
required
iterations,
okay,
so
this
is
how
each
of
our
benchmark
is
going
to
run
now
with
this.
I
think
this
is
a
good
display
of
information
when
it
comes
to
understanding
the
process
of
our
jmh.
B
A
I
would
I
would
I
love
having
a
visual
representation,
because
I
learned
many
things
when
you
showed
the
visual
representation,
but
for
my
for
for
yours
and
my
and
the
other
mentors
evaluation
purposes,
this
data
seems
sufficient
right.
I
think
there's
I
I
like
there
are
times
when
the
the
visual
presentation
can
make
it
even
clearer
than
the
numbers
here.
We
see,
we
see
bars
and
we
see
the
relative
size
of
the
bars
without
being
distracted
by
the
the
digits
and
the
numbers.
A
Yeah
so
and
my
thought
was,
I
can
certainly
install
the
you-
can
install
the
jmh
plug-in
on
your
mac.
I
can
install
the
jmh
plug-in
on
my
environment
and
we
can
do
parallel
experiments
to
see
hey.
Are
we
getting
what
we
expected
out
of
this?
Are
we
learning
what
we
wanted,
then?
If
we
reach
the
point
where
we
say
yeah,
this
is
valuable.
We
can
deploy
the
plugin
to
ci
jenkins.io.
B
Okay,
so
for
now
the
the
first
coding
task
I
had
was
to
run
a
benchmark
on
a
benchmark
and
went
from
on
a
jenkins
infrastructure
on
the
sierra
jenkins.
So
I
think
in
terms
of
generating
report,
we
we're
done
with
that
process.
Now
this,
the
second
step
of
this
task
would
be
to
explore
if
we
can
integrate
it
with
the
jmh
visualization
plugin
right.
B
Yes,
and
also
okay,
so
the
next
a
sub
task.
I
think
before
this
was
the
j,
the
jfr
profiling
step.
I
discussed
this
before
because
I
was
pretty
excited
what
happened
there,
so
I
think
now
I'm
going
to
discuss
my
experience
with
this
was
the
second
agenda.
I
had
okay
for
the
meeting
great,
I
don't
have
a
lot
of
time,
but
so
it's
so
I
I
ran
jfr
on
jdk
11
with
on
the
jenkins
wall.
Let
me
just
show
you
my.
B
Observations:
okay,
so
how
did
I
profile
the
java
application?
So
we
provided
an
additional
argument.
We
start
a
flight
recording
and
we
give
some
options
to
it.
The
file,
the
file
name
for
the
recording,
the
size
of
the
recording
and
what
are
we
doing,
we're
profiling
it,
and
then
we
specify
the
jar
which
we
want
to
profile
and
then
to,
and
then
I
profiled
it
with
with
running
jenkins,
the
scm
checkout
step.
I
did
that.
B
This
is
for
jj
and
one
of
the
first
things
I
understood
from
the
the
thread
stack
here
is
that
I
have
to
look
for
the
executors,
because
those
are
the
threads
which
would
be
which
would
be
working
on
the
build.
So
that
was
where
I
was
looking
and
as
I
as
I
as
I
was
looking
at
the
stack
trace.
I
could
understand.
Okay,
j
git
is
working
here
and
what
is
jk
doing
so
I
could
understand
it's
performing
in
the
retrieve
changes
where
we
are
actually
figuring
out.
B
We're
downloading
we're
fetching
the
git
objects
pulling
them
so
so
I
could
see:
okay,
the
the
meta,
the
method
being
used
to
do
to
do
a
fetch
operation.
So
right
now,
I'm
I'm
actually
not
very
well
versed
with
how
to
understand
the
data
I
have
here.
I
could
see
I
I
can
see
that
I
can
see
the
threads
which
are
taking
a
lot
of
I
o
time,
but
I
still
have
confusions
on
on
things.
I
can
understand
the
from
the
sem
checkout
step
profiling.
B
B
I
could
run
it
here
with
git
sem
checkout,
but
I
need
to
expand
the
profiling
where
I
maybe
I'm
scanning
multiple
branches,
I'm
doing
things
which
may
show
me
different
places
of
git
plugin,
because
right
now,
I'm
just
I'm
just
focusing
on
the
checkout
step
of
the
git
plugin
and-
and
I
think
I
I
I
already
know
the
the
operations
which
I
can
I
can
get
from-
I
can
get
so.
The
objective
of
profiling
is
to
find
out
what
operations
we
need
to
benchmark
then
with
checkout.
B
I
I
think
I
understood
that,
but
if
the
object,
but
also
if
the
objective,
the
objective
is
also
to
profile
and
understand
the
hot
code
parts
where,
where
our
code
is,
you
know
taking
more
time
and
things
like
that
for
that,
I
think
I
need
to
study
this
data
more.
I
need
to
understand
profiling
better
because
the
initial,
whatever
current
knowledge
I
have
I
could.
I
could
understand
that.
Okay,
this
is
the
thread
I'm
concerned
with.
These
are
the
methods
I'm
running,
but
I
know
that
git
fetch
is
going
to
be
called
twice.
B
Checkout
is
going
to
be
called
once
and
so,
and
I
also
compared
it
with
cli
gets
profiling
result,
and
here
I
can
clearly
see
get
fetch
is
being
called
for
some
time
I
can.
I
can
see
that
for
14
minutes
get
fetch
is
get
fetch
is
called
because,
of
course,
it's
a
large
repository,
we're
fetching
here
and
let
me
just
yeah
for
14
minutes
55
seconds,
so
I
know
okay.
This
is
this
is
an
operation
which
is
taking
a
long.
You
know
checking
a
long
duration
of
time,
so
so
yeah
so
mark.
A
A
A
A
So
therefore,
I
would
at
least
my
sense
would
be
you
note
this
noted
in
your
noted
in
your
report
that
look,
here's
the
evidence
from
java
flight
recorder.
It
shows
clearly
that
get
fetch
is
the
dominant
operation
and
it's
dominant
by
it
looks
like
by
one
or
two
orders
of
magnitude
dominant
right,
there's,
nothing
else
that
has
nothing
else
which.
C
B
A
Great
which,
which
reinforces
which
makes
it
even
worse
right
now,
the
story
is
even
more
dramatic.
It's
like
guess
what
we
we
thought
get
fetch
would
be
the
dominant
thing
of
the
time
on
these
on
a
large
repository,
and
we
were
right
here,
it
is
and
here's
the
evidence
and
capture
this
evidence,
but
then
I
think
your
focus
on
on
the
jmh
benchmarking
is
the
is
the
high
value
focus
for
now,
because
now
we're
going
because
you're
going
to
use
that
to
tune
what
options
we
pass
to
get
fetch.
B
Yes,
mark
and-
and
I
think
the
following
question
to
this-
is
that
so
I
move
forward
with
with
the
current
tasks
I
have
in
my
hand,
but
also
do
I
now
when
I
understand
that
okay,
git
fetch,
is
an
issue,
so
we
have
an
existing
performance
issue
we
are
going
to
solve.
That
is
the
double
gate,
fetch
redundant
issue,
and
but
let's
say
I,
I
also
try
git
checkout,
and
so
what
should
I
do?
B
Should
I
first
should
I
try
out
operations
with
jmh
and
note
my
observations
try
to
understand
why
that
is
happening.
Should
we
do
that
first
or
should
we
also
look
at
how
once
we
know?
Where
are
the
places
we
want
to
switch
the
implementations?
We
should
know
how
to
do
that.
The
implementation
of
implementation,
part
of
of
the
result
we'll
have
that
is
the
performance
enhancement,
the
actual
performance
enhancement.
B
So
do
we
select
an
operation,
select
an
operation
and
work
towards
implementing
its
the
performance
enhancement,
or
do
we
first
make
sure
that
we
have
covered
the
operations
we
thought
our
are:
are
a
blocker
for
the
gate,
plug-in
performance
and,
and
now
we've
realized.
These
are
the
these
are
maybe
some
options
we
have
and
then
we
move
forward
with
implementing.
B
Maybe
the
idea
I
had
that:
let's
keep
it
as
as
as
an
opt-in,
feature,
performance
improvement
and
we
work
upon
implementing
that,
and
so
how
should
we
or
maybe
it's
a
week?
A
good
strategy
would
be
to
parallelly
do
both
to
because
I
think
we'll
have.
This
is
a
research
kind
of
a
thing
to
find
operations
to
understand
why
an
operation
is
taking
more
time.
B
A
A
For
that
one
capability,
the
for
me,
the
benefit
of
doing
that
is,
it
means
you'll
have
to
do
a
lot
of
things
at
many
different
levels.
You
got
to
figure
out
how
to
do
the,
how
to
do
a
switch
in
the
code.
You've
got
to
figure
out
how
to
do
how
to
do
get
it
shipped
to
production.
How
to
get
it
released
as
a
as
a
new
release
of
the
plug-in
and
all
those
things
on
the
vertical
are
are,
are
intensely
valuable
and
will
give
immediate
benefit
to
people.
C
A
We're
going
to
do
that
so
yeah,
I'm
much
less
interested
in
attempting
to
do
things
in
parallel.
For
me,
it's
it's
if
you've
identified,
something
that
is
80
or
90
percent
of
of
the
performance
focus
should
be,
and
therefore,
let's
put
everything
we
can
behind
getting
that
thing
all
the
way
to
all
the
way
to
users.
B
A
That
is
well
there,
so
I
would.
I
would
describe
that
one
as
your
work
on
jmh.
Benchmarking
is
proceeding
in
parallel,
while
the
code
review
of
parallel
fetch
of
the
the
fix
for
redundant
fetch
is
happening.
So
your
your
jmh
work
is
is
not
blocked
by
my
my
needing
to
review
the
the
redundant
fetch
removal
and
not
blocked
by
friend
needing
to
remove
review
redundant,
fetch
removal.
So
with
those
those
things
there
is
some
parallel
work
happening,
but
it's
it's
not
you
attempting
to
work
in
parallel.
B
Yeah
yeah
that
that
would
be
great,
so
so
the
next
step
I'll
create,
is
to
think
about
how
I'm
going
to
implement
I'm
going
to
dive
into
the
way.
I
can
implement
this,
the
opt-in
feature
and-
and
I
think
I
guess
one
of
the
things
one
of
the
main
major
things
is
to
figure
out
how
to
calculate
the
size
of
the
repository
and
then
switch
jk
target,
because
that
is
the
most
important
parameter
we
have
here
where
we
have
to
decide.
A
B
B
A
B
Yeah,
the
last
thing
was
the
status,
so
I
I
have
I'm
looking
at
the
test.
The
failure
on
the
tests
we
have
for
the
fix
I
created
and
fran
gave
me
some
suggestions
on
on
the
tests.
So
I
have
I've
added
those
suggestions
and
now
I'm
going
to
look
at
the
tests
and
we
talk
about
the
clone
options,
I'm
going
to
do
that
as
well.
A
Excellent,
I
owe
one
of
the
expectations
that's
been
set
for
me
is
that
I
should
be
spending
six
to
eight
hours
a
week,
at
least
on
helping
you
as
a
student
and
in
the
in
the
project,
and
it
feels
like
right
now.
The
most
crucial
thing
I
can
help
with
is
reviewing
and
then
analyzing
the
double
fetch
performance
chains
that
you've
the
redundant
fetch
change.