►
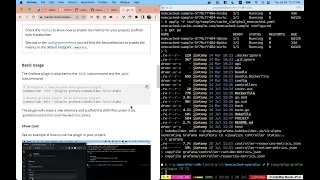
Description
Record from the Kubebuilder, Controller-Runtime, & Controller-Tools meeting on Jul 28, 2022
To know more about see:https://master.book.kubebuilder.io/plugins/grafana-v1-alpha.html
If you would like to propose changes or report issues over the plugin, please raise an issue in the repo: https://github.com/kubernetes-sigs/kubebuilder
Author: https://github.com/Kavinjsir
A
Okay,
so
hi
everyone,
so
my
name
is
Tony
and
I'm.
Currently,
a
university
student
studying
for
like
computer
science
and
I
was
getting
lucky
to
get
admitted
by
the
group
Builder
project
in
this
summer
for
the
gsoc
project
and
I'm,
currently
working
with
camiller
and
brochure
on
developing
the
grafana
plugin,
which
is
a
pretty
new
one.
A
The
control
runtime
has
provided
a
rich
number
of
metrics
for
different
perspectives,
which
is
pretty
good.
So
when
you
go
to
our
documentations,
so
you
can
see
that
in
the
Matrix
references
you
can
see
that
there's
a
lot
of
numbers
of
metrics,
that
being
provided
by
default
from
the
control
runtime.
This
is
a
good
thing,
so
also
we
think
that
maybe
it's
for
some
author
of
the
operator.
Maybe
they
don't
necessarily
need
to
get
that
much
familiar
with
these
default
metrics.
A
So
ultimately,
we
hope
that
our
we
hope
that
our
plugin
can
help
users
to
visualize
the
status
of
the
controller,
help
to
improve
their
control,
to
make
it
more
easier,
more
safe,
more
robust.
So
that's
the
basic
idea,
the
original
idea
to
have
this
to
introduce
this
with
a
plugin,
so
I'm
going
to
give
a
very
brief
Showcase
of
the
current
usage
of
this
plugin.
A
It
is
not
very
complicated
and
it's
pretty
new,
so
it's
in
a
very
early
stage,
so
the
basic
usage
of
it
is
to
trigger
by
the
init
sub
command
or
the
edit
sub-command.
So
as
the
definition
of
these
two
sub
commands
by
init,
it
means
when
you
initialize
a
new
project.
You
can
introduce
this
for
final
plugin
and
then
you
will
have
some
manifest
given
IELTS.
So,
similarly,
if
you
have
the
you,
you
have
you
directly
have
an
existing
project.
A
A
So
since
this
memcache
operator
is
already
an
existing
project
scaffolded
by
operator
SDK,
we
can
use
this
edit
sub
commands
with
to
introduce
the
new
plugin
I'm
gonna.
Do
a
computer
edits
the
plugins
and
then
you
would
have
the
a
grafana
folder
inside
the
project
and
we
give
the
Json
file,
which
is
directly
the
Manifest
of
the
profana.
So
here
we
have
the
control
resource,
metrics,
Json
file
and
the
control
runtime
Matrix
Json
file,
so
indicated
by
the
name.
So
they're
like
trying
to
give
the
dashboards
for
different
aspects.
One
is
the
resource.
A
A
And
then
in
my
grafana,
I
can
just
directly
click
the
import
and
paste
the
content
of
the
Json
file
and
I
can
choose
the
relative
folder
for
it.
So
here
I
just
simply
to
use
the
operator.
Ops
availability
and
I'll
choose
the
relative
data
source,
which
is
Prometheus
and
I
import
it,
and
now
we
have
the
we
will
have
the
panels
for
the
the
status
of
the
memcache
operator,
so
I
can
switch
to
different
time
space
time
period
to
see
what's
happening
in
history.
A
So,
as
you
can
see
in
the
current
status
of
the
plugin,
the
runtime
Matrix
Json
file
will
bring
you
to
Raw.
One
is
the
reconciliation,
one
is
called
over
queue
and
in
this
reconciliation
we
simply
give
the
total
count
of
the
red
constellation
and
the
error
color
of
the
reconciliation
and
scan
the
next
rule.
For
the
word
queue
we
bring
four
panels
on
the
left
side.
A
We
give
the
statistical
result
of
the
seconds
of
the
items,
stayed
in
the
work
queue
before
they've
been
requested,
and,
alternatively,
we
also
give
the
seconds
of
the
items
get
processing
by
the
work
queue
and
on
the
left
side
we
have
the
ad
rate
for
The
Virtue
and
the
retress
rate
inside
of
work
queue.
So
that's
basically
what
the
control
runtime
metrics
Json
file
can
bring
you
about
the
status
of
the
the
your
operator,
and
so
we
can
do
simply
the
same
things
for
another
Json
file.
A
A
A
A
So
that's
we
want
to
see
like
what
is
the
most
important
one
so
that
we
can
bring
in
the
plugin
to
show
and
also
and
the
previous
one
in
the
current
status.
It's
like.
We
try
to
separate
the
panels
into
different
dashboards.
Also,
we
try
to
separate
the
panels
into
different
roles,
so
we
also
want
to
see
like
if
different
dashboards
is
what
you
expect
or
you
think
that's.
The
role
is
good
so
that
we
can
have
those
different
panels
integrated
into
the
same
dashboard
but
separated
by
different
roles.