►
From YouTube: 2023-05-25 Kubernetes SIG Scalability Meeting
Description
Agenda and meeting notes - https://docs.google.com/document/d/1hEpf25qifVWztaeZPFmjNiJvPo-5JX1z0LSvvVY5G2g/edit?usp=sharing
A
B
B
B
As
an
example,
here
we
have
a
client
doing
a
request
to
the
back
end
and
the
bank
can
doing
a
few
subtasks,
so
the
events
would
be
the
client
starting
a
request
and
then
ending
their
request,
and
then
the
web
app
starting
the
processing
and
then
ending
the
processing.
And
with
all
of
these
events,
you
can
create
a
sequence
diagram
that
represents
the
critical
path
of
your
request.
B
B
It's
kind
of
a
black
box
and
so
kernel
tracing
allows
you
to
better
understand
why
the
task
was
plugged.
So
in
the
second
example
you
see
you
can
see
here
that
using
kernel
chasing,
you
could
see
that
Task
1
was
plugged
by
a
task
one
from
trace
a
because
it
was
waiting
for
a
few
texts
and
basically
a
kernel.
Tracer
collects
system
calls.
So
that
way
you
can
know
more
about
your
system
and
using
a
tool
like
Trace
can
pass.
You
can
better
understand
the
critical
path
of
each
processes.
B
B
B
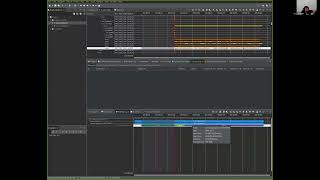
As
an
example,
I've
traced,
a
a
simple
deployment
of
a
single
pod
on
kubernetes,
using
my
user
space
instrumentation.
You
can
see
all
the
lives,
the
events
in
the
life
cycle
of
a
dispute
creation.
You
can
see
the
deployment
being
created,
you
can
see
the
replica
set
being
created
and
you
can
see
the
Pod
being
created.
So
you
can
see
all
the
faces
to
create
the
path
you
can
see
it
being
pulled.
You
can
see
it
being
started
and
you
can
see
it
being
killed
in
this
pod.
B
I've
created
on
purpose,
I've
put
a
really
low
quota.
So
when
you
can,
when
you
zoom
in
on
the
pad
being
started,
you
can
see
the
small
Spike
here
that
indicates
that
it
was
being
throttled,
which
is
a
common
case,
and
when
you
look
at
the
control
flow
of
your
system,
you
can
see
that
all
my
processes
were
preempted
which
basically
showed
that
Mike
pudd
was
being
traveled.
Also
I
can
look
at
in
this
case.
B
B
B
View
here
of
the
critical
path-
and
you
can
see
the
reason
why
it
was
slow.
So
in
this
case
you
can
see
that
it
was
printed
a
lot
for
like
on
pick
Z
other
container
D
processes.
It
itself
was
printed
a
lot.
It
waited
a
lot
almost
also
on
the
timer
and
a
bit
on
the
network,
so
yeah
so
essentially,
Trace
can
pass
and
kernel
tracing
allows
you
to
get
more
information
on
what
was
actually
happening
on
the
Kernel.
B
A
B
B
So
basically
lttng
can
collect
a
every
system
called
being
called
and
recorded,
but
it's
also
there's
a
library
called
the
lib
lttng
UST
that
allows
you
to
send
events
to
record
events
from
user
space,
so
what
I've
done
is
added
I've
created
my
basically
I've
added,
like
a
few
call
to
that
library.
Inside
of
kubernetes
I've
compiled
my
own
kubernetes
and
from
kubernetes
I've
called
the
kernel
Tracer
to
add,
like
a
life
cycle
event
like
being
pulled,
started,
killing
Etc.
A
B
E
E
Let's
make
some
code
changes
to
the
components
to
kind
of
permit
certain
events
and
stuff,
so
I
think
it
will
be
interesting
to
see
if
the
same
kind
of
or
the
similar
method
as
possible
with
the
with
the
open
Tracy
people.
That
goethic
is
talking
about
with
the
statistic:
instrumentation
is
now
the
things
that
have
changed
here:
do
they?
How
would,
if
can
they
also
be
plugged
into
the
other
solution
that
the
community
today
is
thinking
about?
A
I
think
one
more
interesting
thing
from
our
perspective
would
be
to
see
it
for
the
control,
plane
notes
and
not
the
worker
like
from
user
perspective.
Usually
probably
they
care
about
like
why
the
Pod
was
starting
slow
but
from
scalability
perspective,
I
think
it
would
be
also
cool
to
see
it
for
the
control
plane.
A
B
B
So
the
thing
so
essentially
the
kernel
space
information
instrumentation
you
get
it
like
for
free.
You
just
have
to
install
a
kernel,
module
and
you'll
be
able
to
collect
every
Trace
event
that
you
want
from
the
kernel
for
the
user
instrumentation.
So
in
this
case
this
view
the
issue
is
that
the
library
is
in
C,
so
I
had
to
use
cigo
to
call
it,
but
otherwise
it's
like
pretty
easy.
It's
just
like
a
system
call.
E
I
I
know
lots
of
users
at
least
a
class
of
customers
today
that
do
at
least
the
kernel
inside
of
tracing
using
EVP
of
probes.
I
think
you
also
mentioned
YouTube
here,
so
you
can
install
you,
can
fuses
probes
and
permanent
probes,
for
instance,
right
and
I.
Don't
know
how
much
of
this,
for
example,
celium
celium
I,
believe,
does
a
bunch
of
EPF.
E
Yeah
yeah,
so
I
I
think
I
I,
guess
from
what
I
sense
where
the
community
is
ending
and
I
might
be
totally
wrong.
Is
for
the
for
these
kernel
operations
right
or
even
user
space
operations,
like
let's
say,
changing,
IP
templates
and
stuff
like
that
which
is
or
let's
networking
configuration
and
stuff
using
evpf
to
gather.
E
E
E
B
B
B
E
Okay,
okay,
let
me
see
overall,
I
I
think
it
is
a
super
cool
to
watch
as
well.
The
other
part
I
think
we
haven't
talked
much
about
is
the
how
you
are
visualizing
this
like
this
tool
for
visualizing?
Is
this
also
a
part
of
entity
or
is
this?
Can
this
work
like
in
general,
the
open
tracing
standards
like
it
can
inject
traces.
B
B
E
E
B
A
Also
but
I
think
I'm
wondering
like
if,
if
the
cube
verdict
like
two
weeks
ago,
we
had
exactly
similar
conversation
with
the
issue
of
debugging
kind
of
like.
Why
does
it
take
so
much
time
for
for
VM
to
spin
up
in
Cube
Verde
and
they
were
actually
like
interested
in
tracing
I'm,
not
sure,
if,
like
they
need
like
kernel
tracing,
it
might
be
helpful.
A
E
Yeah
yeah,
yeah,
I,
guess
I
think
where
this
collection
is
heading
I
believe
is
maybe
a
okay,
but
if
Benjamin,
this
is
something
you
want
to
take
a
stab
at
you
and
you're
interested
in
actually
kind
of
taking
some
of
these
changes
you
might
want
to
see
if
there's
some
parts
of
it
at
least
that
you
can
try
integrating
with
our
tests
or
testing
I,
guess
the
changes
where
you
have
to
go
make
add
this
response
in
the
qubitis
code.
Those
will
be.
F
E
E
Let
him
speak
more
about
it,
but
I
I
think
the
main
I
guess
the
main
thing
which
kind
of
was
coming
out
of
it
for
me
was
that
change
if
we
tested
it
using
our
test
today,
we
the
load
density
test
that
we
run
today,
I
think
it
wouldn't
have
actually
exercised
this.
You
know
because
artists
don't
create
really
any
load
to
put.
D
We
were
testing
it
a
little
bit
like
out
of
tree
internally
in
Google,
but
can
you
explain
what
the
actual
issues
were
because
like
yeah?
Certainly
it's?
There
are
things
where
it
can
be
improved,
but
that
I
want
to
understand
where?
Yes,
because
we
also
seen
a
bunch
of
cases
where
it
actually
helps
a
lot
and
like
the
cluster
will
fall
down
without
this
yeah
and
it
survived
with.
C
So
yeah
thanks,
so
the
particular
The
Edge
case
that
we
are
seeing
is
if
a
customer
is
making
or
if
a
user
is
making
large
number
of
list
calls,
and
now
they
are
upgrading
from
a
version
which
didn't
have
this
functionality,
which
is
122,
and
this
was
added
in
123..
So
what
they
are
seeing
is
their
list
calls
are
now
taking
large
number
of
seats.
C
So
some
of
the
other
calls
that
fall
in
the
same
bucket
are
basically
getting
429s,
because
there
are,
there
are
no
more
seats
for
those
calls,
which
was
not
the
case
in
122.
so,
and
this
started
happening
right
after
they
upgraded
from
122
to
123
and
in
The
Matrix.
We
can
see
that
the
429s
and
the
reject
calls
those
also
increase
as
a
result
of
the
upgrade,
but
from
their
side
there
was
no
other
increase
in
the
load
or
the
list
call
pattern
that
we
checked.
D
Yeah
I
think
that
that,
in
general,
like
because
we've
seen,
we've
seen
that
too
and
the
reason
for
that
is
primarily
that
we
are
not
tuned
well
enough,
especially
in
terms
of
like
defining
the
capacity
of
the
API
server.
So
so,
basically,
defining
or
increasing
the
number
of
in-flight
seeds
in
the
API
server
is.
Is
the
or
adjusting
this
this
this?
This
value
is
like
how
how
we
believe
it
should
be
solved.
D
E
Put
more
seats,
I
feel
that
probably
the
Miss
with
that
PR
is
when
doing
this,
because
it
is
also
sharing
the
bucket
with
other
papers,
which
means
like
mutating
requests,
which
will
be
hydrating.
Maybe
we
should
have
done
that
in
along
with
maybe
separating
the
bucket
for
let's
calls
altogether,
because
in
the
end,
we
actually
ended
up
doing
that.
E
For
this
customers
we
created
another
bucket,
which
will
divert
the
list
topic,
and
you
can
separately
throttle
that
without
affecting
the
question,
so
maybe
but
I
see
also
how
it
may
be
hard
to
come
up
with
search
engine
pocket
with
respect
to
how
many
concurrency
shares
and
stuff
to
have.
But
maybe
do
you
think
it
makes
sense
that
this
change
would
have
should
have
gone
along
with
that
sort
of
a
change.
Yeah
I'm.
E
D
Yes,
so
I
guess
I
I
think
it's.
It's
certainly
a
reasonable
mitigation
to
that
problem
too.
I
wouldn't
do
that
by
default
for
everyone,
because
in
a
typical
use
case,
where
customer
or
the
the
user
is
not
actually
overloading
or
overloading
in
some
sense,
the
API
server
I
think
they
they
generally
don't
want,
or
they
generally
want
to
share,
share
the
priority
level
between
like
different
types
of
calls,
I
mean
both
mutating
and
reads
so,
I
think
what
what
we.
E
C
Original
comment
about
around
testing
so-
and
you
also
mentioned
that
the
estimation
is
still
not
perfect,
so
let's
say
we
in
APF:
we
go
and
improve
the
estimation
algorithm
and
tomorrow,
like
from
Maximum
seats.
For
any
reason
it
is
now
we
are
bumping
up
to
like
20
or
50
seats.
Then
again
we
might
run
into
this
issue
writer
like
unless
we
have
these
kind
of
testing,
which
can
include
this
case
from
like
either
cluster
loader
or
some
kind
of
perv
test.
D
E
D
You
can
also
talk
to
Abu
from
Red
Hat
I
will
I
will
paste
you
his
his
Elder
here
on
the
chart
like
because
he
was.
He
was
actually
also
looking
into
that
and
and
performing
a
bunch
of
like
tests
internally
in
Red,
Hat,
I,
I,
think
I've
seen
some
demo
or
presentation
or
summary
from
him
at
some
point
like
those
two
years
ago.
F
A
D
A
G
E
F
E
D
Yeah
I
guess
it's
too
late
now
to
to
add
it,
because
no
one
will
read
this
release
note
now,
given
that
120
2
is
already
out
of
123,
will
be
soon
out
of
support
window
even
but
I.
Think
updating
the
documentation
in
general
is
something
that
we
we
still
can
do,
and
that
is
something
that
people
are
looking
at.
E
Yeah,
so
okay
sounds
good,
all
right
so
for
the
testing
gaps
and
like
this
idea
about
really
split
list
calls
okay,
now
defaults
itself
to
a
separate
bucket
dial
open
is
British.
You
need
to
discuss
this,
but
in
general,
actually
the
fact
that
this
change
went
out
and
besides
two
customers,
not
many
people
saw
this
actually
is
a
good
sign
that
the
state
is
actually
the
right
change
and
this.
This
is
not
these
particular
cases,
which
is
three
corners.
Foreign.