►
From YouTube: Kubernetes SIG Testing - 2020-09-22
Description
A
A
A
A
A
B
A
A
A
Is
the
project
board
for
all
of
the
ci
policy
things
I'm
gonna
see
if
I
can
find
my
way
to
the
umbrella
issue,
to
remind
everybody
what
we're
talking
about
and
why
so
there
was
a
c
there
was
a
policies
to
improve
kubernetes,
aci
proposal
that
we
discussed
here
earlier
and
it
basically
involved
things
seem
really
seemed
really
bad.
During
the
119
code
freeze,
it
seemed
like
that
was
both
a
combination
of
resource
exhaustion
and
also
just
tests
being
really
flaky
in
general,
which
the
resource
exhaustion
was
making
worse.
A
So,
as
a
result,
this
was
one
of
the
reasons
that
the
v119
milestone
was
left
in
place
or,
like
code
freeze,
was
left
in
place.
All
the
way
into
the
119
was
released,
and
this
is
the
reason
that
the
120
milestone
restriction
was
also
left
in
place,
so
that
the
gigantic
backlog
of
prs
that
were
ready
to
merge
into
e120
could
actually
merge
by
people
sort
of
piece
by
piece,
adding
the
prs
into
tides,
pool
and
ensuring
that
that
could
all
merge.
A
A
Those
are
both
still
in
progress.
The
reason
they
are
still
in
progress,
as
far
as
I
know,
is
that
the
bazel
bazel
build
and
test
jobs
and
the
build
jobs
have
not
been
migrated
over.
The
reason
for
this
is
because
I
really
wish
I
had
this
link
somewhere.
Maybe
I
do
I
do
not
I'm
going
to
find
it,
but
basically
these
jobs
write
to
a
google
cloud
storage
bucket,
called
kubernetes
release
or
kubernetes
release
dev
and
that
bucket
lives
in
a
project
called
google.
A
Here
we
go
so
the
bucket
lives
in
a
project
called
cubicle
containers.
There
is
no
that
that
project
has
a
restriction
that
only
google.com
accounts
can
write
to
this
bucket
and
part
of
what
we've
been
doing
as
we
move.
The
jobs
over
is
to
move
them
to
a
community-owned
cluster
that
lives
in
the
kubernetes
dot,
io
google
cloud
organization,
so
I've
gotten
as
far
as
proposing
that
we
use
alternate
buckets
boy.
There's
really
just
no
comment
here
that
cleanly
describes
this.
A
A
This
is
going
to
require
kind
of
a
slow
migration
of
jobs
from
one
bucket
to
the
other.
It
may
involve
setting
up
a
canary
job
that
pushes
to
the
community-owned
buckets
in
parallel
and
then
gradually.
We
can
actually
update
job
definitions
to
consume
from
the
new
community
owned
bucket
instead
of
the
old
google
owned
bucket.
A
A
So
the
the
situation
with
merge
blocking
jobs
is
much
better.
We
have
many
of
them
migrated
over
the
ones
that
are
not,
let's
see
well.
This
is
a
lot.
That's
actually
been
migrated
over
this
grpc
job.
If
I
remember
correctly,
is
an
example
of
why
it's
difficult
to
mess
with
a
job
if
it's
already
kind
of
flaky
and
failing,
we
basically
found
that
the
job
intermittently
fails
or
times
out
for
whatever
reason.
A
So,
if
you're
just
looking
at
right
this,
so
this
is
all
of
the
runs
of
the
job
over
time.
Higher
up
is
later
over
down
is
earlier,
and
so
it's
kind
of
tough
for
me
to
tell
when
something
changed
related
to
this
job
and
if
things
got
better
related
to
this
job,
I
mean
okay,
there's
a
big
block
of
red
down
here.
So
maybe,
if
I
go
earlier,
okay,
there
was
a
lot
of
failure,
but
I
think
this
was
related
to
a
job
configuration
issue.
A
A
A
A
The
way
we're
simulating
kind
of
similar
resource
usage
on
the
build
cluster
is
to
give
this
job
seven
cpus,
which
is
a
lot
of
cpu.
All
this
job
is
doing,
is
running
unit
tests
twice.
Well,
this
part
was
three
times
this
part
is
twice
because
this
was
also
really
to
look
at
kind
of
pushing
us
to
notice
that
back
here.
A
A
We've
made
great
progress
on
deflaking
that,
but
things
are
still
a
little
flakier
than
before,
because
we've
actually
uncovered
that
our
unit
tests
are
clicky.
So
this
is
a
similar
situation,
where
it's
tough
to
tell
if
things
were
appropriately
green
or
not
beforehand,
and
if
we're
making
the
situation
worse
or
better
or
you
know
not
making
not
having
that
much
of
an
impact.
But
that's
a
good
thing
and
it's
the
same
story
with
bazel
build
with
the
google
cloud,
storage
bucket
issue
and
rdp.
A
So
between
those
top
three
were
considered
the
most
urgent
and
important
things
to
get
done.
So
there's
a
bunch
of
other
stuff
that
I
feel
like
we
could
get
community
help
with.
If
anybody
is
interested,
we
kind
of
decided
once
we
had
taken
care
of
the
permanent,
critical
jobs
that
we
were,
and
I
am
not
actually
sure
how
I'm
going
to
get
out
of
screen
share
here.
This
is
great.
Let
me
stop
sharing
just
so
I
can
see
your
faces
for
a
second,
that's
better.
A
I
feel
weird
talking
throughout
look
like
straight
a
bunch
of
windows,
so
that
was
taking
care
of
the
critical
jobs.
The
next
part
is
to
like
ask
everybody:
hey
since
you're,
getting
the
benefit
of
using
community
resources
to
run
ci,
please
make
sure
it
actually
passes
and
please
make
sure
you're
actually
declaring
your
resources,
and
so
what
we
need
help
with
is
identifying
and
implementing
a
policy
that
says
hey
if
your
job
is
failing
for
some
arbitrary
threshold.
A
A
So
I'm
pretty
sure
if
somebody
was
handy
with
yaml
or
jq
or
yq
or
something
they
could
come
up
with
a
report
that
kind
of
makes
a
best
guess
at
assigning
everything,
and
then
we
could
probably
blast
out
a
notification
to
kubernetes
dev
and
tell
people
like
look.
Your
sig
is
getting
this
job.
If
you
don't
want
it
or
you
don't
agree
with
it.
Please
comment
on
this
pr.
A
A
C
A
I
mean
client,
I
mean
the
when
we
were
back
in
august
or
july,
and
things
were
really
bad.
I
would
have
been
more
inclined
to
be
draconian
about
this
and
say
everything's
getting
shut
down,
and
then,
let's
see
who
comes
screening
out
of
the
woodwork
to
claim
their
jobs.
I
think
things
are
not
quite
as
critical
as
that.
So
in
order
to
be
a
little
more
collaborative
or
cooperative,
I
feel
like
it's
better
to
give
people
a
heads
up
and
say
like
look
we're
making
these,
like.
A
But
I
also
kind
of
feel
like
recovering
things
from
deletion
is
what
source
control
is
for,
and
so,
as
people
are
like
searching
around
trying
to
find
what
jobs
are
doing,
what
it's
better
to
just
delete
jobs
if
we're
not
actively
using
them.
But
I
agree
with
your
point
that
if
people
don't
claim
their
jobs
passed,
a
certain
deadline,
we're
just
gonna
delete
them.
C
A
The
failing
thing
I
think
we
we
wrote
that
up
into
three
parts,
the
first
part
is
like
figure
out,
take
a
guess
at
who
owns
which
jobs
and
then
the
really
permanent
fit
look
at
the
really
egregiously
failing
job.
So
I
think
everybody's
eyes
popped
out
of
their
heads
when
I
talked
about
how
we
had
a
job.
That's
been
failing
for
700
days
in
a
row
or
something
like
that.
A
So
there
is
an
issue
if
anybody
wants
to
go,
take
a
look
at
the
list
of
jobs
that
are
failing
and
delete
the
really
permanent
failing
ones.
That
sounds
great.
We
should
give
a
shout
to
like
kubernetes
dev,
to
give
people
a
chance
to
claim
these
and
say
no,
please
don't
delete
that
and
then
we'll
know
who
owns
it.
A
But
yes,
I
am
a
fan
of
like
let's,
let's
stop
the
bleeding,
it's
pretty
obvious
that
there
are
some
jobs
that
are
wasting
resources
and
will
never
be
paid
attention
to,
but
there
are
a
lot
of
other
jobs
where
maybe
it's
less
clear,
whether
they're,
necessary
or
not,
and
I
think
that
having
humans
sweep
through
and
do
this
is
great
and
all.
But
I
think
the
policy
is
really
only
going
to
be
adhered
to.
A
If
there's
automated
enforcement
of
this,
so
the
closer
we
could
get
to
having
a
bot
kind
of
by
having
the
the
contact
info
encoded
in
the
job
and
since
the
bot
sort
of
knows
how
to
query
which
jobs
have
been
permanently
failing,
it
can
sort
of
put
two
and
two
together
and
notify
that
email
address
and
say:
hey
caution.
If
you
don't
do
you
know
if
the
job
has
been
failing
for
more
than
100
days
or
more
than
four
weeks,
I'm
going
to
open
a
pr
to
delete
it.
C
A
A
A
C
A
C
A
Yeah
that
that's
really
fair,
I
think
I'm
sort
of
I'm
wary
of
assigning
tasks
to
to
individuals
just
because
they
may
or
may
not
be
present.
I
think,
though
we
could
try
like
we
could
try
using
github
teams,
like
I
think,
every
single
sig
is
required
to
have
a
github
team,
that's
named
after
the
sig,
and
so
we
can
make
an
educated
guess
based
on
which
sig
named
dashboard
a
test
belongs
to.
A
Is
this
bad
and
I'm
not
sure
that
we
we
have
that
at
the
moment,
so
we
have
another
issue
open
for
like
try
and
identify
some
metrics
or
stuff
that
we
keep
we
could
use
and
I'm
really
open
to
like
any
and
all
brainstorming
ideas.
People
have
on
this
I'll
go
back
to
talking
to
windows
for
a
second
to
share
some
of
the
stuff.
I've
got.
A
A
So,
if
you're,
a
member
of
the
kate's
infra,
proud
viewers
group,
it's
in
a
yaml
file
in
the
kate's,
I
o
repo.
You
are
all
welcome
to
pull
yourselves
in.
You
can
see
this
dashboard
here
I'll
sign
in,
as
my
personal
account
just
to
prove
like
this.
This
account
doesn't
even
have
a
google
like,
I
don't
pay
any
money
or
anything
on
this
account.
A
A
A
A
You
can
see
that
that
grows
elastically,
because
we
have
auto
scaling
set
up
for
this
cluster
we've
also,
and
so
here
you
can
see
the
size
of
the
node
pool,
that's
scaling
up
or
down
you
can
see.
We
get
really
peaky
like
we've
gotten
as
high
as
having
120
nodes
available
all
the
way
down
to
having
like
27
minutes
ago.
A
A
A
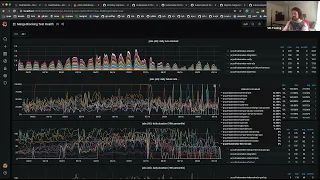
So
you
can
see
the
text
is
probably
really
small,
but
I
said
that
kubernetes
kubernetes,
94
196,
has
had
37
jobs
in
the
last
in
a
one
hour
interval
that
this
graph
is
sampling
over.
So
somebody
probably
hit
retest
a
lot
or
pushed
a
lot
of
commits
repeatedly
or
something
like
that,
and
so,
if
things
start
to
tip
over
or
we
feel
like,
there's
excessive
resource
consumption,
we
may
be
able
to
find
whether
there
are
culprit
prs
or
whether
there
are
just
a
lot
of
prs
all
happening
at
once.
A
Granularly
now
we're
looking
at
a
five
minute
interval.
There
was
a
period
of
time
where
yeah,
supposedly
this
counted
36
pods,
I'm
like
when
we
start
to
get
down
to
that
super
granular
level.
I'm
less
less
aware
of
what
this
really
means.
There
were
36
pods
running
simultaneously
or
like
36
containers
all
running
continuously
or
whether
there
were
36
pod
resources
visible
to
the
cluster
in
some
shape
or
form
like
this
doesn't
necessarily.
A
The
other,
the
other
handy
thing
on
the
dashboard,
is
just
breaking
it
down
by
job
type,
so
we
can
see
whether
maybe
a
configuration
has
changed
for
a
particular
job
or
maybe
something
about
that
job
jobs.
Resource
consumption
is
causing
it
to
behave.
Oddly,
it's
basically
the
scalability
jobs,
the
100
node
pull
request
jobs;
they
tend
to
hang
around
for
a
while
because
they
take
basically
the
longest.
A
I
think
so.
This
is
one
dashboard
we
can
use.
My
my
concern
is
like
it's
a
lot
of
graphs
and
I'm
trying
to
sit
here
and
read.
The
tea
leaves
in
front
of
y'all,
I'm
not
confident
enough
in
any
in
any
one
of
these
things
to
say:
let's
try
and
set
up
alerts
on
this
I
feel
like
this
is
more
like
just
humans
have
something
else
to
look
at
which
they
should
I'm
glad
we
have
it
another
way
to
look
at.
A
So,
as
a
result,
I
can
see
that
these
were
the
before
times.
This
is
when
everything
was
really
bad.
This
is
when
we
were
running
way
too
many
jobs
for
way
too
many
jobs
period,
probably
and
certainly
way
too
many
jobs
for
the
resources
we
had
available
for
these
jobs.
So
just
the
sheer
shape
of
it.
You
can
see
that
the
number
of
pre-submit
jobs
is
way
way
larger
than
anything
else.
A
So
we
discovered
during
the
bad
times
that
proud
jobs
that
couldn't
work
for
resource
issues
ended
up
in
the
error
state.
So
if
I
look
at
the
crowd,
jobs
by
state
and
click
on
the
air
graph,
I
can
see
that,
yes,
we
had
a
really
bad
time
during
code
freeze
and,
yes,
things
have
gotten
substantially
better,
since
we
switched
to
crowd
jobs
to
explicitly
declaring
their
resources
and
we
move
proud
jobs
over
to
a
cluster
that
you
know
scales
appropriately
based
on
those
resources.
A
So
here
I
think
I
can
say
things
have
gotten
a
lot
better
in
terms
of
measuring
like
how
far
we
have
to
go.
So
this
is
broken.
This
does
not
break
down
by
jobs
right,
so
this
is
all
pull
request,
jobs
and
all
periodic
jobs.
This
is
the
number
of
jobs
that
run
on
the
google.com
default,
build
cluster
and
then
this
yellow
line
here
is
the
number
of
jobs
that
run
on
the
community
owned.
Kate's
infra
crowd
build
cluster.
A
You
can
see
like
over
time,
we've
added
a
lot
more
jobs
to
the
point
where
we're
actually
handling
more
jobs
on
the
community
cluster
than
we
are
on
the
google.com
build
cluster,
which
is
great,
but
I
feel
like
we're
not
really
going
to
be
fully
done
until
we've
migrated
this
green
line
all
the
way
down
to
zero
anyway.
Those
are
those
are
the
things
I
have
for
metrics
at
the
moment,
something
else
I've
been
noodling
on.
A
I've
started
iterating
on
just
standing
up
the
latest
and
greatest
grafana
on
my
own
system
and
then
setting
up
a
bigquery
data
source.
So
just
talk
to
bigquery
directly
to
see
if
I
can
sort
of
recreate
that
you
like.
If
I
get
far
enough
with
this,
we
could
investigate
whether
you
know
we
could
replace
velodrome
with
this
see
if
the
security
is
any
better.
A
I
just
I
haven't
quite
gotten
as
far
as
would
work,
late,
identity
work
with
this
or
do
I
need
to
upstream
some
changes
to
grafana
to
get
that
attacked,
but
I'm
showing
the
job
data
over
the
last
six
months.
And
so
again
we
can
sort
of
see
like
the
number
of
jobs
that
were
triggered
for
merge,
blocking
jobs,
climbed
up
substantially
over
time
and
then
fell
down.
So
this
is
both
pr
traffic
going
down
and
us
deciding
there
were
certain
jobs
that
we
no
longer
wanted
to
execute.
A
Trying
to
look
at
the
daily
failure
rate
of
jobs
looks
super
noisy
because
some
jobs
go
from
being
perfectly
fine
to
failing
100
of
the
day,
because
they
don't
fail
that
much,
but
you
can
sort
of
see
that
the
failure
rate
kind
of
climbed
up
for
all
of
these
jobs
and
it's
kind
of
gotten
a
little
more
tightly
coupled
down
below
aside
from
jobs,
sort
of
periodically
peaking
up
and
failing
100
of
the
time.
I
would
quantify
these
as
like
jobs
that
aren't
triggered
that
often
so
the
variability
is
really
high.
A
I've
also
been
trying
to
take
a
look
at
the
duration
of
the
jobs,
seeing
if
that's
improved
over
time
as
we've
migrated
jobs
over
I'm
trying
to
scroll
here.
So
just
looking
at
the
99th
percentile
75th
and
50th
durations
things
are
kind
of
getting
better.
The
top
of
this
graph
is
two
hours.
Nothing
should
take
more
than
two
hours
to
run,
especially
if
it's
a
pull
request,
job
and
our
times
have
improved.
I
wanted
to
call
out
the
verified
job
has
gotten
a
lot
better.
A
I
think
I
forget
what
his
actual
name
is,
but
hashed
stan
when
he
was
doing
ci
signal
for
119
managed
to
improve
the
verified
child's
execution
time,
and
that
really
shows
here
which
is
really
cool,
especially
if
you
start
to
look
at
like
the
75th
percentile
or
the
99th
percentile,
like
it's
all
gotten
a
lot
better
ever
since
he
did
that
change,
so
I
feel
like
metrics
like
this
might
be
really
helpful.
This
is
me
just
playing
around
with
other
panels.
So
that's
all
I've
got
on
that.
A
A
Like
you
can
see
that
jobs
are
flaky
here,
but
I
can't
necessarily
see
how
how
flaky
they
are.
I
could
kind
of
go
with
these
numbers,
but
then
I
can't
necessarily
see
how
these
are
changing
over
time.
So
it
may
be
difficult
for
me
to
know
when
we
did
this
change
at
time
x.
We
saw
this
effect
on
the
flakiness
unless
we
did
the
right
thing
versus
the
wrong
thing.
A
B
C
B
C
So
what
the
gist
of
this
is
basically
getting
pro
up
and
running
without
you
touching
gcp
service
accounts
yourself
like
if
you
follow
the
installation
instructions.
This
apply.
This
yaml
create
a
service
account
here,
apply
disk
and
we'll
create
a
service
account
here.
The
installer
takes
care
of
that
for
you,
if
you
give
it
a
service
account
so
like
you
literally,
are
down
to
one
service
account
and
the
rest
of
us
is
created,
it
creates
buckets
for
you
and
everything
with
the
right
permissions
and
gets
your
prowl
running.
C
I
just
wonder,
like
I,
just
posted
a
link
in
the
chat
as
well.
If
this
is
something
that
anyone
is
interested
in
us
pushing
upstream,
we
might
have
to
spend
some
more
work
on
the
code
itself,
but
once
it's
upstream,
I
guess
we
also
have
to
think
about
adding
the
s3
stuff
to
it
for
people
that
are
interested
in
that.
A
I
can't
necessarily
speak
for
eric
he's
more
on
the
team
that
works
on
crowd,
but
pretty
sure
they
have
a
goal
of
making
like
prow
as
easy
to
install
as
possible,
and
so
I'm
sure
they
would
be
interested
on
collaborating
with
you
on
this,
like
I
don't
necessarily
know
that
it
needs
to
be
a
hundred
percent
perfect
before
you
get
it
upstream.
I
think
getting
it
upstream
and
iterating
on.
It
would
probably
be
acceptable.
A
A
C
A
C
Just
fyi,
so
we
don't
use
any
bazel
and
hopefully
makes
it
easier
to
understand
and
and
install
for
you
as
well.
So
I
mean
I
guess,
people
have
to
try
it
out
and
see
if
the
code
is
okay,
but
I
don't
know
if
there's
an
issue
already
for
this,
like
prowl
installation,
make
it
easier
somewhere,
where
I
could
start
discussions
on
this
or
I'm
also
not
sure
what
eric
thinks
of
it,
because
he
I
mean
he
saw
it,
but
I'm
not
sure
if
he
looked
at
it
really.
A
But
I
think
this
aligns
with
with
goals
if,
if
we
can
get
past
the
lack
of
basil
or
whatever,
because
that
sounds
fine
to
me,
I
think
my
other
two
questions
from
things
I
know
proud
does
lately
perspective-
are
whether
this
configures
workload
identity
and
sets
pro
up
to
use
workload,
identity
and
then
also
whether
this
uses
the
sort
of
the
automated
web
hook.
Management
feature
that
pronoun
has.
C
A
B
C
A
Okay,
I
think
it
would
getting
that
included,
would
would
probably
help
a
lot.
We
may
still
be
in
a
situation
where
there
are
parts
of
prowl
that
that
can't
function
with
workload
identity
at
the
moment
like
I
know
we're
trying
to,
if
at
all
possible,
stop
having
a
service
account
key
stored
in
the
cluster
as
a
secret
and
instead
just
rely
entirely
on
workload
identity,
but
we
may
not
be
there
yet.
So
I
would
view
and
cole
would
have
more
information
about
the
the
web
hook.
A
Hmac
rotation
thing,
but
I
think
it
would
be
really
beneficial
if
we
could
all
decide
on
the
best
like
one-click
way
to
install
prow.
We
may
not
be
able
to.
I
don't
know
there
might
be
differences
of
opinion
on
on
how
to
best
manage
prowl
going
forward,
and
maybe
some
of
those
decisions
affect
how
you
choose
to
install
prow
from
the
get-go,
but
I
think
it
would
really
benefit.
A
C
For
us,
it
was
mainly
the
need
for
like
setting
up
test
clusters
easily,
for
whenever
I
want
to
try
something
with
prow.
I
can
use
this
and
have
a
cluster
up
and
running
in.
I
guess
like
10-15
minutes,
just
pointing
it
at
gcp
and
then
tearing
it
down
next
week.
If
I
want
to
try
something
out,
I
guess
that
was
the
main
motivation
for
us,
but
definitely
for
for
new
users,
and
I
don't
know
how
many
people
out
there
are
actually
having
their
own
prow
instance.