►
From YouTube: Kubernetes SIG Testing - 2020-08-25
Description
A
Hi
everybody
today
is
tuesday
august
25th.
You
are
at
the
kubernetes
sig
testing
bi-weekly
meeting.
I
am
your
host
aaron
krickenberger
and
this
meeting
is
being
publicly
recorded
and
will
be
posted
to
youtube
later.
So
you
can
all
watch
yourselves
adhere
to
the
kubernetes
code
of
conduct
by
being
your
very
best
selves
and
not
being
jerks
on
the
agenda.
For
today's
meeting,
we
have
jordan
liggett
who's
going
to
give
us
a
deflating.
A
Demonstration
of
how
he
and
others
have
deflated
many
a2e
and
integration
tests
over
the
past
couple
of
weeks,
and
if
we
have
time
after
that,
I
thought
I
would
update
everybody
on
the
progress
we've
made
on
implementing
the
kubernetes
ci
policy
improvements.
We
discussed
a
couple
meetings
back
so
with
that,
I'm
getting
a
handoff
to
jordan,
all
right.
A
C
C
So
my
goal
for
today
is
to
sort
of
help
you
get
into
the
mindset
of
deflaking
and
fixing
flakes
and
then
show
you
some
ways
to
find
things
to
fix
and
give
you
some
tools
and
techniques
to
make
you
more
effective
at
fixing
flakes
and
avoiding
them
in
the
first
place.
So
I
thought
I'd
start
with
the
mindset
in
general.
C
A
flake
means
that
we
have
a
problem
and
the
problem
can
be
in
one
or
more
places,
but
a
failing
test
is
not
a
thing
we
want
and
building
that
into
our
mentality
as
a
community
will
help
us
a
lot,
and
so
thinking
about
where
the
problem
is,
it
could
be
in
the
thing
that's
being
tested.
That's
the
ideal
right
like
if
a
test
fails.
We
really
want
that
to
be
a
good
signal
that
we
have
a
thing.
C
We
need
to
fix
in
code
that
we
ship
and
run,
but
sometimes
there's
a
problem
in
the
test
itself,
the
test's
making
bad
assumptions
or
is
written
in
a
fragile
way,
and
then
the
third
possibility
is
that
the
thing
running
the
test
has
a
problem.
So
like
infrastructure
issues,
and
so
as
developers,
the
temptation
is
to
assume
that
our
code
is
perfect
and
our
tests
are
perfect
and
the
problems
are
always
in
the
infrastructure
and
sadly,
that
has
been
more
or
less
true
at
various
times.
C
But
we've
worked
really
hard
over
the
past
month
to
improve
ci
infrastructure
consistency
to
make
it
a
better
signal
when
a
test
fails.
So
the
goal
is
in
an
ever-increasing
way
when
a
test
fails.
That
means
there's
a
problem
in
the
thing
being
tested
or
in
the
test
itself,
and
it
really
needs
to
be
looked
into
so
then
the
next
temptation
is
to
assume
that
flakes
are
a
test-only
issue.
So
if
the
test
is
timing
out
well,
we
should
just
increase
the
timeout
on
the
test.
C
That's
not
always
the
case
we've
discovered
times
where
a
test
by
pulling
or
waiting,
we
were
actually
changing
what
the
test
was
verifying.
Another
example
is
lengthening
timeouts,
so
I
have
a
couple
examples
here.
So
this
is
an
example
of
a
test
which
was
depending
on
garbage
collection,
and
it
was
running
in
our
ede
tests
and
in
our
e2e
test.
C
C
Up
this
thing,
but
this
thing
doesn't
seem
to
exist
anymore,
I'm
gonna
kind
of
wait
for
30
seconds
and
resync,
and
so
it's
not
unexpected
that
garbage
collection
would
sometimes
take
30
seconds
longer
than
other
times
in
an
e
to
e
test,
and
so
a
test,
that's
depending
on
garbage
collection,
should
in
in
our
parallel
e
to
e
tests,
should
tolerate
a
delay
like
that.
So
in
this
case
adding
a
timeout
was
appropriate
in
another
example.
C
C
So
adding
timeouts
in
the
appropriate
places
are
fine,
but
we
want
to
make
sure
we
understand
the
root
cause
before
we
do
that,
and
then
the
last
thing,
I'll
call
out
is
just
make
sure
that
the
changes
you
make
to
the
test
are
still
testing
what
you
expect.
So
this
was
one
we
discovered
recently
where
there
was
a
flaky
test
in
the
plug-in
watcher
and
by
changing
the
test
by
initializing
things
in
a
different
order.
We
could
make
the
test
run
consistently,
but
by
initializing
things
in
a
different
order.
C
We
actually
weren't
exercising
reality
like
in
reality,
the
cubelet
starts
and
it
could
start
before
or
after
or
during
plugins,
and
so
our
test
shouldn't
care.
What
order
we
start
things
in
it
should
be
resilient
to
any
order,
and
so
michelle
did
a
really
good
job
of
noticing
that
the
initial
fix
was
actually
breaking
what
we
were
supposed
to
be
testing
and-
and
we
ended
up
fixing
a
real
bug,
and
so
this
turned
into
a
bug
fix.
C
C
Good
places
to
start
issues
that
people
have
already
reported,
we
have
a
label
kind
flick.
So
looking
for
issues
that
have
already
been
reported,
and
that
can
help
you
see
if
someone's
already
working
on
this
or
how
much
this
is
getting
mentioned.
If
people
are
saying
yep,
I
saw
this.
I
saw
this.
I
saw
this
that's
one
place
to
look
and
you
can
filter
these
by
sig
label
to
see
flakes
relevant
to
your
sig.
C
This
actually
looks
better
than
it
has
in
a
long
time,
which
is
excellent
so
used
to
you
would
open
these
up
and
there
would
be
like
five
or
six
really
bad
flicks
in
each
job.
So
that
is
less
the
case
now,
which
is
excellent,
but
that's
one
place
to
look.
Of
course.
We
all
have
encountered
flakes
in
our
own
pull
requests,
so
that
is
also
a
place
to
start.
C
Here's
our
gce
container
d
test
grid
and
you
can
make
this
super
small
and
then
you
can
see
which
tests
have
been
failing.
It
looks
like
we
kind
of
have
a
variety
there's,
not
like
one
test.
That's
repeatedly
failing
except
this
one,
which
we
already
have
an
issue
for,
but
this
can
be
a
good
way
to
sort
of
identify
once
you
zoom
out
and
see
like
several
weeks
worth
or
weeks
worth
of
runs.
C
C
A
good
thing
to
filter
on
so
that,
if
you're
looking
for
things
specific
to
your
sig,
that's
a
good
way
to
to
find
them,
and
then,
lastly,
is
the
triage
board.
I
love
this.
This
just
got
really
rewritten
in
go
it's
much
faster
now
and
this.
This
is
one
of
the
most
powerful
tools
that
I
use
it
lets
you
filter
by
sig.
C
Now
these
are
the
sig
titles
associated
with
the
tests,
so
that
doesn't
always
show
you
exactly
what
you
want,
but
it
can
be
a
good
starting
place,
but
then
it
also
lets
you
filter
on
failure,
text
or
the
job
name
or
the
test
name
or
any
combination
of
those
things
and
then
exclude
specific
things.
So
if
I
wanted
to
find
something
related
to
that
cube,
control.
C
So
that
is
a
good
place
to
start
as
an
example.
As
an
example,
I
went
through
some
of
the
sig
off
attributed
failures
and
found
some
really
noisy
tests
that
had
been
marked,
flaky
and
just
kind
of
ignored
for
a
long
time
and
actually
cleaned
those
up.
So
the
sig
off
filter
signal
is,
is
much
clearer
now
and
we'll
be
working
on
getting
these
cleaned
up
as
well
all
right.
So
what
are
good
things
to
put
in
a
flake
report?
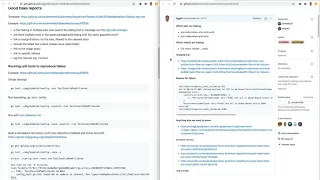
C
Let
me
pull
this
over
and
we
can
talk
through
some
of
the
helpful
things
to
put
in
if
something
is
failing
in
multiple
jobs.
We
see
this,
especially
in
our
end-to-end
tests,
where
we
have
different
variants
of
them:
different
container
runtimes,
different
network
setups,
if
something's
failing
in
multiple
jobs,
that's
helpful
to
know
if
we're
seeing
something
fail
in
only
one
variant.
That's
also
helpful
to
know,
because
it
might
be
something
specific
to
that
variant.
C
If
there's
more
than
one
test
that
is
having
the
same
failure
text,
that's
helpful.
The
triage
board
is
great
for
figuring
this
out
and
then
specific
links
to
the
test
grid
queries
the
reason
for
the
failure
so
that,
when
you
search
github
for
like
some
random
text
and
failure,
you
find
it
links
to
the
triage
board
and
then
specific,
failed
examples.
All
of
these
are
super
helpful
for
helping
someone
who
wants
to
dive
into
fixing
this
get
context
right
away
and-
and
most
of
this
is
in
the
flake
template
the
flake
issue
template.
C
C
You
have
to
watch
out
for
the
go
cache,
it
will
cache
test
results,
and
so
you
can
bypass
that
by
telling
it
some
uncashable
argument
like
how
many
times
you
want
it
to
run,
so
that
is
no
longer
our
cash
result,
but
it's
still
passed.
So
that
means
we've
definitely
got
a
flake
like
it's
it's
passing
for
me.
C
C
My
favorite
tool
this
year
is
the
stress
tool,
and
so
I
linked
to
that.
I
already
have
it
installed,
but
what
that
lets
you
do
is
build
a
binary
for
the
test
so
go
test.
I
want
to
build
it
with
race
detection
enabled
and
instead
of
telling
it
what
test
I
want
to
run.
I'm
going
to
give
it
the
dash
c
argument,
and
that
is
telling
it
to
compile
the
test,
and
that
is
going
to
create
this
binary
in
my
current
directory.
C
C
I
can
run
it
standalone
and
it
still
passes.
But
now,
if
I
stress
it,
this
is
going
to
run
a
bunch
of
instances
in
parallel
over
and
over
and
over
and
over
so
in
about
five
seconds.
It
ran
almost
300
instances
of
that
test
and,
as
you
can
see,
it's
flaking
immediately
like
the
thing
that
we're
observing
reproduces.
C
That's
super
super
useful
and
it's
just
sitting
there
like
running
300
times,
and
so
now
we
have
a
reproducer.
Now
we
can
start
to
dig
in
and
you
know
try
to
figure
out
where
the
where
the
problem
is.
So
that's
that's
what
I
love
doing
for
unit
tests
integration
tests,
you
can
actually
do
really
similar
things.
Most
of
our
integration
tests
expect
an
std
instance
to
be
started,
so
you
can
do
that
pretty
simply
by
just
starting
atd
in
another
tab.
C
C
So
for
just
simple
flakes:
where
we're
seeing
an
integration
test,
failure
that
same
approach,
works
works
pretty
well.
One
interesting
issue
that
I
ran
into
was
a
deadlock
or
a
timeout.
That
would
fail
the
entire
package
on
an
integration
test
and
when
that
happens
it
it
barfs
out
about
10
trillion
routines
and
you
have
no
idea
which
test
even
failed.
C
The
question
was
why
it
could
be
compiled
into
a
banner.
So
it's
it's
actually
compiling
the
tests
for
that
package
into
a
binary,
and
the
reason
is
so
that
we
can
invoke
that
with
stress.
So
it's
not
re-recompiling
the
tests.
Every
time
we
build
the
tests
once
and
then
we
invoke
them
a
bunch
of
times
in
parallel.
C
C
When
we,
when
we
just
stressed
the
whole
package
like
this,
we
could
see
it
was
completing
10
runs
of
the
package
and
it
was
completing
nine
runs
of
the
package
at
a
time.
Then
eight
runs
at
the
time,
then
seven,
then
five,
but
gradually
the
test
runners.
I
think
it
defaults
to
eight
or
ten
in
parallel.
Gradually
the
test
runners
were
getting
hung
up
on
some
deadlock
and
then
fewer
and
fewer
were
completing
at
a
time
and
then,
finally,
after
two
minutes,
we
got
a
timeout.
C
So
the
way
that
I
broke,
this
down
was
to
stress
individual
tests.
So
first
I
would
just
run
one
test
in
the
package
and
I
would
see
how
long
does
this
test
take
normally,
and
so,
if
it
took,
you
know
a
tenth
of
a
second
normally,
then
I
would
stress
that
one
test
and
I
would
give
it
generously
like
a
hundred
times
as
long
as
it
normally
takes
to
complete,
and
this
way
I
didn't
have
to
wait
for
two
minutes
for
the
timeout
to
happen.
C
When
I
stressed
it
with
a
timeout
of
10
seconds
after
10
seconds
immediately,
I
was
getting
timeout
clicks,
and
so
that
gave
us
a
particular
test
to
look
at
once.
We
had
a
particular
test
to
look
at
our
job
is
much
smaller,
we're
just
trying
to
break
the
problem
down
and
find
where
the
particular
problem
is
so
looking
at
that
test.
It
was
timing
out
on
this
weight.
So
then
we
start
adding
debug
logging
to
the
places
where
we
could
return
early
or
see
the
thing.
C
That's
going
to
unblock
this,
and
once
we
once
we
did
that
the
issue
was
pretty
quick
to
resolve.
It
turns
out.
We
weren't
we
weren't
waiting
for
all
of
our
caches
to
be
synced
before
we
were
starting
the
test,
and
so
the
event
we
were
waiting
for
in
the
test
happened
before
we
kicked
off
the
wake
all
right.
So
now,
everybody's
favorite
topic
ede
tests.
C
Okay,
so
remember
we
said
the
problem
in
a
flake
could
be
the
thing
that's
being
tested
right.
Well,
the
bad
news
is
for
an
e
to
e
test.
The
thing
being
tested
is
everything
pretty
much
so,
on
the
one
hand,
that's
good,
because
we
do
actually
want
to
make
sure
our
system
works
when
you
run
the
whole
thing.
We've
all
seen
like
the
comic
of
like
unit
tests
passed,
integration
tests
fail
with
like
two
drawers
that
each
open
individually,
but
you
can't
open
them
at
the
same
time
or
whatever.
C
C
The
problem
is
that
the
namespace,
the
test
was
using,
got
deleted
by
something,
and
so
like
the
setup
for
the
test
failed
because
the
namespace
was
being
deleted
and
so
just
be
aware
that
you
can't
just
look
at
the
title
of
the
test
for
an
ed
test.
You
actually
have
to
dig
into
what
the
problem
is,
and
so
the
takeaway
is
prefer
unit
and
integration
tests.
If
those
are
sufficient
to
test
the
thing.
C
You're
looking
at
and
then
yeah,
don't
assume
the
title
of
the
ede
test
identifies
the
problem,
so
the
steps
that
I
follow
for
deflating
an
ede
test
first
step
is
just
gathering
information
right,
so
this
link
is
gonna,
go
stale
because
we
reap
our
artifacts
from
edu
runs.
But
hopefully
you
get
the
idea.
There's
a
lot
of
things
we
capture
from
ede
runs.
C
So
if
you
are
used
to
seeing
a
screen
like
this
with
some
random
failure-
and
you
click
on
this-
and
you
think
well
now
what
like
this
is
clearly
not
enough
information
to
figure
out
the
problem.
This
artifacts
tab
is
your
friend
under
here
we
have
the
build
log
which
is
all
of
the
output
from
the
test
when
it
was
running,
but
then
under
artifacts
we
capture,
tons
and
tons
and
tons
of
logs.
So
for
the
control
plane.
C
We
capture
logs,
like
the
api
server
audit,
which
will
tell
you
in
detail
every
request
that
was
made
and
who
made
it
and
what
order
it
was
made
in
and
don't
forget
that
there's
archived
rotated
versions
of
them.
These
are
big.
But
if
you
need
to
know
what
order
things
happened
in
they're,
very
useful,
the
api
server
log,
the
controller
manager
and
the
scheduler,
those
are
the
main
logs
that
you
normally
care
about
on
the
control
plane
and
then
for
each
node
and
most
of
our
ed
tests
set
up
three
node
clusters.
C
C
So
once
you
have
those
things
gathered,
the
next
step
is
to
filter
and
correlate
that
information.
So
if
your
first
step
is
to
kind
of
pick
likely
candidates
like
the
the
things
you
know
that
interact
around
this
issue
might
be,
the
test
is
doing
something.
So
you
care
about
the
test
log
and
the
api
server
log,
and
then
the
controller
manager
is
going
to
do
something
and
the
cube
is
going
to
do
something.
C
So
you
can
filter
the
logs
for
the
relevant
things
I
like
to
keep
timestamps
at
the
beginning
of
the
logs
and
then
right
after
the
timestamp
put
something
that
identifies
the
component
and
then
merge
all
the
files
into
one
file
and
sort
by
time,
and
so
you
end
up
with
something
like
like
this:
let's
see,
if
I
can
find
there,
we
go
so
this
was
when
we
were
trying
to
debug
a
garbage
collection
issue,
so
you
see
the
time
stamp.
So
this
is
the
api
log.
Api
log
cube
controller
manager.
C
I
thought
I
put
cubelet
in
here.
Maybe
it
was
just
those
two,
oh
yeah
and
then
so
this
was
the
output
from
the
ede.
So
this
was
the
test
code,
that's
running
so
when
the
test
started.
Looking
for
the
thing
to
go
away,
maybe
I
put
maybe
that
was
it,
but
but
you
get
the
idea
you
take
the
logs
from
the
relevant
components.
C
C
C
So
this
is
an
example
of
a
bug
in
run
c,
which
was
actually
an
old
version
of
run
c
configured
on
this
particular
job,
and
so
the
clue
to
this
was
the
line
numbers
of
the
message.
So
in
the
error
message
know
we
see,
process
linux
line,
449
and
then
stuff
happening,
and
if
we
look
at
the
version
of
process
linux
that
we
have
in
kubernetes,
that
line
number
doesn't
match
what,
where
that
message
comes
from,
and
so
tracking
that
line
number
down
actually
pointed
at
the
run
c
component.
C
C
So
the
first
thing
does
the
test
assume
that
something
that's
happening.
Asynchronously
is
happening.
Synchronously,
so
is
the
test
gonna
do
something
and
then
immediately
check
a
condition
when
really
the
thing
that's
gonna
make,
that
condition
pass
might
not
run
right
away,
and
then
there
are
ways
to
stimulate
this.
So
if
the
test
is
kicking
off
a
go
routine
or
the
component,
that's
being
tested
is
kicking
off.
A
go
routine,
put
a
sleep
at
the
top
of
the
go
routine
and
that
will
simulate
the
go
routine.
C
C
B
C
A
couple
rules
of
thumb
tests
that
assume
things
are
going
to
be
fast,
something
that
takes
like
a
second
or
less
locally
could
take
a
few
seconds
in
ci
environments.
For
a
couple
reasons,
ci
environments
normally
have
more
resource
constraints
than
like
a
local,
powerful
death
machine,
and
often
we
run
multiple
tests
in
parallel.
So
maybe
it
happens
really
fast
when
you
run
just
your
test,
but
if
you
run
10
or
15
or
20
tests
in
parallel
things
slow
down
a
little
bit.
C
So
unless
your
test
is
specifically
a
performance
or
timing
test,
don't
put
super
tight
tolerances
weight,
dot
forever
test
timeout
is
set
to
30
seconds.
That's
a
reasonable
thing
to
use,
for
you
know,
quote
unquote
things
that
should
not
take
very
long,
that's
useful
when
we
don't
want
to
test
to
hang
for
10
minutes
before
failing.
We
wanted
to
actually
fail
quickly,
but
we
don't
care
for
the
purposes
of
this
test
if
it
takes
one
second
or
five
seconds
or
ten
seconds.
C
Another
thing
we
see
a
lot
of
is
assuming
deterministic
output,
so
these
are
just
your
friendly
reminders
that
map
iteration
and
go
is
non-deterministic,
and
so,
if
there
is
something
being
a
list
being
compiled
or
a
set
of
steps
being
done
by
iterating
over
a
map,
those
are
going
to
happen
in
non-determined.
Stick
order
so
either
sort
and
compare
or
tolerate
any
order.
So
there's
a
link
to
an
example
of
that
this
was
a
fun
one
that
we
found.
Sometimes
we
have
things
that
will
do
random
allocation.
C
C
So
in
this
case
it
was
a
real
bug
we
could
fix
and
then
the
last
one
I
was
going
to
call
out
if
you're
using
a
fake
client-
and
you
have
like
an
informer
watcher
on
it,
it
can
do
a
read
list
in
a
rewatch
at
any
point,
and
so,
if
you're,
making
fake
client
calls
and
then
expecting
like
exact
actions
to
be
output,
those
can
get
interleaved
spuriously
with
the
informer.
In
the
background,
so
it's
better
to
look
for
the
specific
things
you
wanted
to
happen
instead
of
just
asserting
exact
matches.
C
Once
you
know
the
tools
and
kind
of
get
a
workflow
to
where
you
can
do
the
gathering
and
the
filtering
and
correlating
that
usually
takes-
I
mean
just
that
bit
once
you
get
it
down
takes
you
know.
Five
minutes
like
it
takes
a
while
to
get
that
workflow
down,
but
once
you
have
something
correlated,
it
really
varies.
Sometimes
the
issue
will
jump
out
at
you
immediately.
C
A
Right,
I
totally
understand
it's
kind
of
kind
of
a
long
tail
for
some
of
these
things,
but
it's
just
sort
of
a
gut
check
like
I
feel
like
I've
seen
you
and
some
other
folks
go
through
an
impressive
number
of
these
lately.
So
it
does
feel
like
there's
a
bit
of
a
rhythm,
at
least
as
far
as
uncovering
some
of
the
lower
hanging
fruit
in
unit
and
integration
tests.
C
Yeah,
the
unit
and
integration
tests
are
way
way
easier
and
faster
to
figure
out.
Just
because
of
the
rapid,
you
know
make
a
change
reproduce
make
a
change,
reproduce
make
a
change
reproduce,
so
those
you
can
actually
normally
resolve
or
at
least
root
cause
within
you
know
a
couple
hours
sometimes
once
you
find
the
root
cause
the
root
cause
is
this
test
is
fundamentally
wrong
and
we
need
to
rewrite
it,
and
so
that
can
be
tricky
but
root,
causing
unit
and
integration
issues.
A
C
Yeah
I
mean
the
the
more
realistic.
The
setup
of
the
test
is
the
better.
So
if
you
can
use
the
same
constructors
to
set
up
the
the
controller
or
the
component
that
you
know
are
really
being
used
when
we
run
the
thing
in
production,
that's
nice
sometimes
we'll
see
issues
where
the
setup
code
was
faulty
and
we
were
sort
of
hacking
together,
fake
clients
and
artificially
running,
go
routines
and
waiting
for
cache,
syncs
and
informers
in
totally
different
orders
than
happen.
C
Instead
of
sort
of
this
extremely
fragile,
like
I
expect
this
call
to
be
made,
then
this
call
will
be
made.
This
call
will
be
made.
It
must
happen
in
this
order.
It
must
happen
with
this
timing
and
like
for
a
functional
test.
That's
probably
not
what
we
care
about
like
we
want
an
invariant
of.
I
create
a
thing,
and
then
this
happens
to
that
thing,
and
so
the
more
you
can
scope
the
test
to
just
those
things
better.
A
A
C
A
A
So
I
will
share
my
screen
for
this.
Maybe
not
all
of
this
is
cleanly
documented
in
linkedin
places.
I
will
work
on
following
up
and
landing
this
stuff,
but
I've
been
using
an
umbrella
issue
called
kubernetes
ci
policy
to
sort
of
find
my
way
to
all
of
the
appropriate
work
streams.
Lori
apple's
also
put
together
a
ci
policy
improvement
project
board,
which
is
another
way
of
sort
of
keeping
track
of
what
works
in
progress.
And
what
are
we
monitoring?
A
A
I
created
a
tool
to
generate
a
csv
which
can
then
be
imported
into
google
sheets,
and
I
did
some
unconditional
formatting
filtering
here,
but
what
you
see
is
anything
everything
on
here
is
in
a
dashboard
that
has
the
word
blocking
on
it,
and
I've
specifically
manually
excluded,
like
the
relinj
blocking
dashboard
and
a
few
other
things.
This
should
cover
all
the
critical
jobs.
A
B
A
These
are
all
the
pre-submit
jobs
that
are
scheduled
and
like
they,
both
kind
of
go
down
at
roughly
the
same
rate,
but
around
about
the
time
that
we
decided
we're
doing
this
and
we're
implementing
we're
declaring
resources.
The
number
of
jobs
that
have
ended
up
in
air
state
has
not
gone
directly
to
zero,
but
it's
significantly
flatter
and
less
correlated
to
pr
traffic
than
before.
So
I
feel
like
you
can
use
this
to
say.
Yes,
we
have
made
a
difference.
A
A
B
D
A
A
Some
of
them
are
related
to
building
kubernetes
and
they
involve
pushing
it
to
google
cloud
bucket
that
only
google.com
clusters
have
access
to
there's
an
open
issue
where
I'm
working
with
the
release
engineering
team
to
try
and
migrate
to
a
different
bucket
that
the
community-owned
infrastructure
can
write
to,
but
that
there's
no
progress
being
made
on
that
until
119
is
out
the
door
there's
also
the
bazel
test
job
which
probably
can
be
moved
over,
but
I
didn't
want
to
change
the
behavior
of
how
basil
runs
its
unit
tests.
While
jordan
was
deflaking.
A
For
slightly
more
context,
many
of
the
bazel
jobs
that
run
against
kubernetes
today
use,
what's
called
remote,
build
execution.
It's
an
alpha
feature
that
google
cloud
offered
for
a
little
while,
but
I'm
not
sure,
is
publicly
available
anymore
or
basil
would
do
some
gathering
of
resources
and
what
not
locally,
but
then
ship
them
all
off
to
some
remote
execution,
environment
somewhere
and
that's
where
all
of
the
running
of
tests
or
building
of
kubernetes
would
actually
happen.
A
So
we
can
move
on
that
once
we
sort
of
feel
like
jordan's
fought
off
all
the
unit
test,
flakes
that
you
can.
That
is,
as
far
as
I
know,
the
story
with
these
merge
blocking
jobs.
So
there
are
a
whole
bunch
of
issues
related
to
migrating,
merge
blocking
jobs,
just
click
through
to
one
for
verify.
For
an
example,
most
of
these
have
been
taken
by
people.
As
far
as
I
know,
I
tried
to
describe
what
to
do.
A
How
to
do
it
and
then
different
dashboards
or
tools
to
look
at
and
questions
to
ask
yourself
as
you
look
at
these
dashboards
to
see
if
the
job
has
become
healthier
or
not.
I
haven't
swept
through
to
see
how
people
feel
about
all
these,
but
in
aggregate
I'm
starting
to
have
concerns
that
we
are
bumping
into
quota
issues.
A
So
I've
been
trying
to
bump
up
those
quotas
and
not
have
much
success.
So
in
the
interim
there
are
a
number
of
suggestions
I
put
here
on
ways
we
could
work
around
this.
I
would
really
love
to
just
do
the
simple
thing
and
raise
the
photos
and
forget
about
this,
but
in
the
event
that
we
can't,
I
have
concerns
that
when
we
sort
of
open
the
floodgates
and
allow
pr
traffic
for
v120
in
the
kubernetes,
we
might
start
to
bump
into
these
quota
issues
again.
So
I
feel
like
we
need
to
take
mitigating
steps.
A
I
kind
of
didn't
want
to
do
that
just
right
now,
while
we
do
have
the
capacity
so
that
we
can
get
more
data
about
how
these
jobs
are
behaving,
because
if
we
move
them
back,
we
lose
visibility
into
what
the
jobs
are
doing
and
why
they're
failing
the
the
cluster
that
lives
in
google.com
was
stood
up
many
years
ago
and
uses
a
different,
different
monitoring,
different
metrics.
So
the
dashboards
that
some
of
you
have
been
using
to
keep
track
of
how
the
jobs
are
doing.
A
You
don't
have
equivalence
to
that,
even
as
googlers,
so
it
is
more
difficult
for
us
to
troubleshoot.
What's
going
on.
So
as
an
example,
one
of
the
things
we
tried
to
do
to
maybe
mitigate
these
quota
issues
was
instead
of
having
more
smaller
vms.
What
if
we
had
fewer
larger
vms,
larger
vms,
get
more
io,
so
maybe
that
would
mitigate
the
effect
of
stacking,
more
jobs
onto
larger
vms.
A
You
can
see
that
we
started
having
a
lot
of
throttled
read
operations
when
we
were
running
on
those
fewer
smaller
nodes,
so
we've
migrated
back
hooray,
I'm
still
sort
of
keeping
an
eye
on
our
node
pool
size
because
we're
still
kind
of
we
can't
get
too
far
over
60
vms.
At
our
current
limit,
I'm
trying
to
correlate
what's
causing
these
things
to
spike
up.
A
We've
got
more
metrics
available
for
like
the
pods
and
jobs
that
are
running
on
the
various
nodes.
This
graph,
for
example,
shows
you
that,
like
more
pre-submits
sorry,
this
should
be
highlighting
when
I'm
moving
over,
but
a
lot
of
pre-submits
started
spiking
around
this
time,
which
correlates
pretty
closely
to
the
number
of
vms
spiking
as
well.
So
why
were
there
so
many
pre-submits
running
like
they're
down
here?
I
can
sort
of
see
the
pre-submits
aggregated
by
which
pull
request
was
triggering
those
pre-submits.
A
A
So
I
just
sort
of
feel
like
if
I
look
at
the
the
I
lost
the
graph.
If
I
look
at
the
graph
that
sort
of
showed
precipitate
traffic
going
down
over
time,
I
feel
like
even
at
this
reduced
level
of
traffic,
we
are
already
killing
our
vms
and
hitting
so
we
may
need
to
consider
mitigating
that,
but
otherwise
I'm
hoping
these
graphs
have
been
more
useful
to
the
ci
signal
team
and
everybody
who
has
joined
the
crowd
viewers
group
to
sort
of
better
understand.
What's
going
on,
and
I
will
stop
talking.
B
A
So,
like
I
said
I,
I
tried
to
describe
a
bunch
of
potential
workarounds
in
the
the
linked
comment.
That's
linked
off
of
what's
like.
What's
stopping
merch
blocking
jobs
from
moving
forward
and
my
bandwidth
has
been
limited
to
move
on
these
or
to
further
spell
them
out,
so
that
other
people
might
move
on
them.
A
The
longest
term
solution
would
be
to
get
our
quota
raised,
which
I
am
attempting
to
escalate,
both
internally
and
externally,
and
if
anybody
here
has
suggestions
or
ideas
on
how
to
do
that,
I
would
appreciate
that
help.
An
even
longer
term
solution
would
be
to
re-architect
how
we
do
our
build
cluster.
A
A
A
A
B
B
A
A
Yeah,
I
think,
sort
of
trying
to
continue
to
figure
out
how
we
can
identify
and
measure
the
pain
that
we
are
experiencing
would
be
more
helpful.
I
still
feel
like
we're
doing
an
awful
lot
of.
Maybe
it's
this
or
maybe
it's
back
and
forth,
which
can
make
it
scary
to
change
things.
I
would
like
to
figure
out
how
we
can
change
things
with
confidence
rather
than
doing
like
big,
slow,
very
cautious
moves,
but
that's
just
a
stylistic
choice.