►
From YouTube: SIG - Performance and scale 2021-07-15
Description
Meeting Notes: https://docs.google.com/document/d/1d_b2o05FfBG37VwlC2Z1ZArnT9-_AEJoQTe7iKaQZ6I/edit#heading=h.u0jl6a1n3b1m
A
Okay,
welcome
to
sixth
scale
july
15th.
I
added
the
our
notes
to
the
to
the
chat
and
yourself
as
an
attendee
and
please
add
items
to
the
agenda.
So
let
me
see
I
added
a
few,
so
I've
been
tracking
a
few
things.
I
think
there
are
a
few
pr's,
a
few
new
pr's
that
we
can.
We
can
talk
about
and
highlight
so
please
add
those
if
you
want
to
talk
about
them
all
right.
So
why
don't?
A
B
A
A
A
A
A
C
C
E
B
Yeah,
if
you
can
open
it,
just
some
quick-
you
know
comment
about
that,
so
I
run
some
well.
I
would
not
say
per
escape
test.
It's
only
300
vms
that
I
could
create.
So,
first
of
all,
it's
only
300
because
I
have
three
nodes
and
there
is
a
limit
of
110
pods
and
then
I
increase
that
to
actually
200
something
pods,
but
our
convert
also
has
needs
to
be
configured
to
allow
to
create
more
vms
in
the
in
the
node,
so
more
than
110
vms.
B
In
the
know,
I
didn't
try
to
do
that,
so
I
will
play
that
later.
I
don't
know
if
the
convert
ci
has
some.
You
know
easy
metric,
some
environment
variable
that
we
could
configure
that,
if
not
maybe
it's
worth
you
know,
including
that
it
will
make
it
easier
to
deploy,
convert
with
enabling
more
vms,
deploy
more
vms
per
node,
because,
as
we
mentioned,
we
want
to
create
a
much
more
vms
per
node
for
our
escape
test
yeah.
B
This
is
something
that
we
need
to
look
and
then
I
run
like
this
test.
I
create
this
dashboard.
Maybe
I
can
share
it.
I
don't
know
where,
with
you
guys,
it's
graph
on
the
dashboard,
it's
pretty
much.
It's
focus
on
covert,
so
it's
with
the
work
kill.
I
oh
it's.
I
think
we
forgot
to
mention
here.
We
have,
I
enable
well,
it
was
something
it.
There
was
like
some
other
logic
to
have
the
work
q
metrics.
B
A
So
do
you
do
you
want
to
walk
through
each
of
these
I
mean
we
can,
even
if
you
have
the
dashboard
around
and
be
cool
even
to
see
like
you
share
your
screen
and
even
go
through
some
of
these.
If
people
can't
see
this,
I
mean
I
can
try
and
zoom
in
or
something,
but
do
you
want
to
walk
through
like
each
of
these,
like
talk
a
little
bit
about
like
what
we're
seeing.
B
A
B
Yeah
and
then
I
create
like
many
different
scale
tests
starting
from
10,
then
20
and
I
put
like
a
slip
of
five
minutes
between
each
run.
That's
why
you
see
these
bumps
and
it
will
be
like
10,
vms,
20,
vms
30,
vms.
If
you
throw
a
little
bit
in
the
upper
part,
no,
the
yeah,
it's
10,
20,
40
and
so
on
up
to
three
so.
D
B
E
B
B
G
B
B
A
A
F
B
B
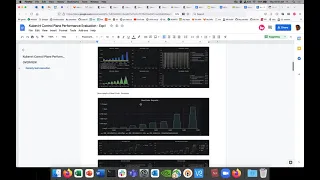
That
is,
you
know,
increasing
with
actually
the
vert
controller
bmi
and,
and
then
one
thing
that
it's
interesting
also
is
with
a
work.
Queue
is
adding
more,
you
know,
events
which
actually
the
disruption
budget.
I
don't
know
what
this
controller
is
doing,
but
it
seems
to
be
the
most
intensive
one,
and
maybe
it's.
E
Yeah,
that's
surprising,
so
the
destruction
budget
controller
is
adding
a
disruption
budget
for
every
vmi.
That's
a
mixer
strategy
to
live
migrate
to
ensure
that
the
pod,
the
vmipod
can't
be
evicted
or
just
killed
and
we're
hooking
into
that
to
cause
a
lot
of
migration,
and
that
does
track
with
what
you're
saying
with
404s
and
things
like
that.
It's
probably
likely
related
to
that
disruption.
Budget,
controller.
A
Someone
mind
like
writing
a
few
notes,
while
I
about
some
what
we're
seeing
while
I'm
like
sharing
sharing
over
here,
because,
like
I
like
this,
is
interesting.
We
have.
This
is
an
interesting
correlation.
Like
all
these
crafts,
they
all
look.
The
same.
We've
got
more
key
depth
increasing
and
almost
at
the
same
rate
as
all
these
things
are
increasing.
We've
got
also
got
this
over
here.
It's
kind
of
interesting.
A
E
A
Yeah
well,
it's
interesting
to
see
like
you
have
here
are
you've
got
we've
got
handler
working
depth,
that's
not
increasing,
or
is
this
yeah
then
we've
got
the
controllers
kind
of
exploding
fairly
quickly.
I
don't
know
I
mean
it's
hard
to
say
like
what
we
got.
A
bunch
of
we've
got
a
ton
of
data
here,
what
it
is,
but
there's
like
wait.
What
would
be
our
expectation?
I
guess
that
would
be
the
question
like
we
would.
We
would
like
to
see.
We
would
like
to
see
very
small
increases.
B
C
I
guess
it
all
goes
back
to
what
ryan's
colleague
said
regarding
to
the
queries
per
second
in
the
client
red,
so
it
completely
makes
sense
from
the
perspective
and
we'll
see
that
on
everything
I
mean
it's,
the
the
404s
are
indeed
very
surprising
as
you
as
already
said,
but
apart
from
that
it
looks
like
all
goes
down
to.
We
have
many
objects.
We
try
to
create
a
lot
of
objects,
but
we
are
readily
making
ourselves.
A
B
No,
I
didn't
check
that
so,
but
we
can
we.
I
can
try
to
see
another
thing
that
it's
interesting.
If
you
go
stealing
the
work
you
they
go
below
yeah,
you
go
a
little
bit
more
down
yeah,
so
the
work
you
have
also
just
unfinished
work
and
longest
running
process.
Although
it
looks
like
similar,
they
represent
different
things,
so
the
work
q
latency-
it's
it's
interesting
also
is
we
were
talking
about
before
how
long
it
takes
to
process
event?
Isn't
it
in
the
work
queue?
It's
almost
constant
tense.
B
B
B
B
A
B
B
Yes,
this
is
so
this
is
official
metrics,
okay.
So
it's
not
it's
it's
nothing
that
I
came
up
from
myself.
So
it's
official
metric
from
work
to
you
so
what
they
say
that
and
they
unfinished
work.
They
say
like
how
many
seconds
of
work
has
done
that
it's
in
progress
and
hasn't
been
observed
by
the
work
you.
B
So
it's
something
that
it's
processing
and
and
it's
it's
not
you
know,
maybe
what's
my
different
dish,
you
guys
can
help
with
that.
But
it's
it's
something
that
it's
processing
and
it's
not
being
finish
so
and
then
what
they
say
here
is
a
larger.
A
larger
number
of
that
means
stuck
threads
straight
threads.
That
are,
you
know
some
lock.
I
don't
know
something,
but
it's
processing
to
chew
is
low
and
it's
keeping
here.
A
Would
be
a
good
example,
I
don't
know
if
anyone
thinks
of
an
example
of
like
you
know
if
we
had
a
key
that
we're
doing,
maybe
maybe
we're
like
reconciling
or
maybe
we're
trying
to
add
change
the
state
from
scheduling
to
running
or
something
and
we're
processing
it
and
it
gets
stuck.
Is
that
is
that
what
this
is
like?
Like.
A
E
A
E
B
E
E
H
I
think
this
is
sounds
like
a
symptom
of
rate
limiter
on
the
on
the
kubrick
side,
because,
like
this,
this
number
of
seconds
usually
mean
that
that,
when
you
make
like
this
update
or
create
call
the
rate
limiting
will
will
just
throttle
you
for
a
couple
of
seconds.
If
you
are
making
too
many
requests.
D
B
C
H
These
requests
you,
you
also
need
to
remember
that
there
will
be
a
reconcile,
so
you
will
have
like
five
more
requests.
That
will
happen
due
to
like
updates
right.
So
you
may
have
this
sleep
every
every
creation,
but
then
you
need
to
also
like
take
into
consideration
that
there
will
be
more
requests
happening
for
for
a
single
vmi.
H
So
even
though
there
you
you
are
trying
to
to
like
you
know
like
to
to
lessen
the
burden
of
on
the
api
server,
there
will
be
still
this
this
happening
so
and
the
qp
is,
as
it
was
mentioned,
is
it's
quite
low?
It's
like
five
so
and
burst.
I
think
default
is
ten,
so
it's
like
five
requests
per
per.
Second,
it's
like
nothing
right.
So
then,
then
the
sleep
comes
in
and
it
will
like
throttle
for
a
couple
of
seconds.
A
single
request
right.
B
C
C
C
E
A
A
B
E
E
C
E
A
E
As
soon
as
we
can
start
reproducing
this
individually,
I
think
we're
gonna
see
a
lot
of
progress
get
made,
because
you
know
what
I
hear
of
this:
okay,
the
404
issue,
for
example.
I
immediately
want
to
figure
out
what's
going
on
there
with
this
dashboard,
I
can
immediately
if
I
can
import
this
and
I'll
immediately,
see
results
with
my
own
stress
testing.
B
Yeah
definitely
so,
if
you
guys
point
me
where
to
to
put
this,
you
know
the
source
of
this
dashboard
again,
I
can
put
there
yeah
so
and
just
also
we
can
see
you
know
the
things
that
are
interesting.
Just
it's
the
we
were
discussing
before
how
long
it's
taking
to
to
process
a
key.
It's
you
know
the
the
the
right
side
of
the
unfinished.
They
stuck
the
unfinished
work
of
the
work
queue
we
have
now
the
histogram.
B
If,
if
you
write,
if
you
can
yeah
the
longest
run
is
process
you
see,
this
is
the
time
that
it's
taking
to
process
the
key
and
it's
I
would
say,
200
milliseconds,
it's
fast
enough,
isn't
it
so
the
problem
is
with
the
the
task.
There
are,
you
know
waiting
for
something,
and
maybe
this
is
related
to
the
500.
You
know
four,
it's
it's.
You
know
waiting
to
get
something
some
some
calls
and,
and
then
it's
waiting
too
much
again.
A
B
B
B
B
B
A
Yeah,
it's
just
like
one:
okay,
that's
yeah,
okay,
yeah!
I
see
it.
Okay,
yeah,
that's
kind
of
really
fun.
Okay,
the
the
handler
over
here,
so
we're
saying
that
it
expects
we
expect
it
to
grow
memory
usage
as
we
get
more
vmis.
Well,
what's
interesting
about
this,
like
so,
let's
say
I
would
be
interested
in
this
at
scale
like
let's
say
we
had,
because
we're
gonna
hit
a
limit
eventually
right,
a
node
is
going
to
have
a
certain
amount
of
vmis
that
it
can
that
you
can
have
on
it.
A
B
A
A
If
we're
doing
200-
and
we
have
two
nodes-
we'd
hit
the
limit
right
here
and
353
nodes,
we're
filling
the
whole
thing.
What
I'm
wondering
is,
like
you
know,
based
on
scale,
if
we
increase
scale,
we
just
kind
of
keep
filling
up
our
data
center
with
vms.
Does
this
graph
continue
to
climb,
because
I
would
expect
it
to
stay?
A
A
C
A
I
I
B
A
I
A
Okay,
well,
I
mean,
I
think,
we've
gotten
through
so
this
was
so
top
one
is
with
david's
forward
on
change
bottom
ones.
Without
so
I
will
what
I
want
this
like,
because
I
just
we
see
a
lot
as
a
lot
of
things
in
here.
I
can
create
issues
around
like
all
of
them
in
terms
of
what
we
expect
from
each
of
these
scenarios
or
something
or
maybe
marcel.
You
can
help
me
with
some
of
these,
because
I
I
see
like
a
ton
of
things
that
we
could.
A
A
A
E
So
the
idea
would
be
to
create
a
tool
that
would
be
able
to
pull
the
prometheus
queries
that
we're
interested
in
over
the
duration
of
the
test,
create
a
report
out
of
that
and
then
programmatically
be
able
to
compare
that
to
previous
results
to
determine
if
the
delta
is
outside
of
our
performance
threshold,
which
would
then
fail.
So
we
would,
you
know,
take
this
a
little
bit
further.
If
we
continue
with
this
direction,
we
would
come
up
with
a
way
of
determining
the
delta.
E
E
And
then
maybe
just
to
talk
about
the
tool
of
it
further,
maybe
maybe
we
could
get
a
little
bit
of
discussion
going
on
here.
We
have
time.
Does
the
approach
that
I'm
taking
here
make
sense
to
everyone
like
this
is
something
that
we
should
continue
with
and
you
know
begin
putting
more
behind
it
or
I,
I
guess,
look
at
that.
Workflow
that
I
have
here
maybe
go
down
a
little
bit
in
the
example.
E
Just
so
you
can
see
the
whole
thing:
yeah,
yeah,
yeah,
so
starting
a
tasking
start
time
running
your
stress
test,
getting
the
the
end
time
and
then
capturing
results
over
that
time
period.
Is
that
the
way
we
want
to
do
this,
or
is
there
a
different
way
that
people
would
be
interested
in
capturing
these
results
and
reporting
them?
I
just
want
to
make
sure
that
we're
all
kind
of
come
to
some
sort
of
consensus
that
this
makes
sense
for
us.
E
Yeah,
it's
all
it's
all
optional!
So
right
the
api
has
three
ways
of
representing
time.
You
can
give
it
a
start
time
and
end
time.
It's
going
to
capture
over
that
period.
You
can
give
just
an
end
time
and
duration.
It's
going
to
have
the
end
time
and
then
subtract
that
duration
to
calculate
the
start
time.
So
you
didn't
want
to
do
that
or
you
can
give
it
nothing
and
it'll
just
get
like
the
last
10
minutes
or
something.
A
Yeah,
so
we're
retroactively,
we're
looking
back
and
we're
scraping
metrics
and
we're
getting
data
generating
a
report,
the
the
other,
the
other
thing
I
I
think
I
sent
you
that
like
we
could
also
look
at
doing
count
like
we
could
do.
I
think,
that's
like
the
only
other
metric
I
can
think
of
like
the
number
of
items
that
we
could
look
at
and
doing
like,
so
that
we
could
find
like.
I
want
the
last
100,
because
I
don't
know,
I
don't
know
when
that
was
run.
C
B
C
I
see
multiple
ways
you
can
could
run
it
this
way
or
you
just
say
to
it
in
this
case.
We
know
that
the
cluster
is
probably
not
running
too
long.
You
would
just
say:
look
at
the
metrics
from
the
last
day
or
whatever
it
can.
If
it
knows
what
the
test
label
metric
looks
like
it
can
out,
could
auto,
detect
the
tests
and
just
should
fetch
them
all
and
create
reports
without
any
further
essay
config
all
possible,
but
I
mean
it
can
be
more
or
less
smart.
I
don't
know.
A
Yeah
the
direction,
though
I
think
what
we
were
asking
before,
that
that
seems
to
make
sense
like
we
we're
doing
it
after
the
fact
and
and
we're
getting
all
the
data
like.
I
think
our
assumption
was
that
we
can
do
it
after
the
fact,
because
we
expect
everything
to
be
in
previous
and
if
we,
if
we
feel
like
we
need
to
do
it
during,
we
have
the
possibility
to
do
it
later.
A
A
Yeah
we're
getting
to
standard
out
so
like
we
can
from
here
we
can
like.
I
can
run
this
as
just
a
dev
like
I've
got
my
I
didn't
make
cluster
up.
I
just
committed
a
pr
I
tested
it
worked
and
I
just
want
to
check
okay.
What's
my
do
I
meet
the
performance
thresholds
just
like
I
would
run.
You
know,
make
tests
just
to
verify
that
all
my
unit
tests
pass
or
my
functional
test
pass.
So
same
kind
of
thing
get
that
information,
and
then
we
can
do
all
sorts
of
things
with
this
later.
B
E
Think
it
definitely
makes
sense.
Okay,
so
there's
the
next
step.
Would
it
make
sense
to
how
do
we
compare
the
delta?
Is
that
something
that
should
be
programmatically
done
within
the
test
and
let
the
test
kind
of
figure
this
out
itself,
or
does
it
make
sense
to
create
code
external
like
accompanying
this
tool
with
the
delta
binding
tool?
B
I
think
I
think
you
need
to
have
like
some
input
for
the
for
the
the
thresholds
in
it
that
we
are
expecting
so
because
it
can
change
for
the
environment.
You
know
depends
on
your
cluster.
How
powerful
are
your
vm,
your
bare
metal
nodes
or
whatever
you
are
running,
it
will
change
so
it
I
think
it
just
needs
to
be
configurable.
B
E
E
Do
you
think
that
this
I
should
create
a
tool
that
knows
how
to
interpret
two
results
and
determines
like
a
configurable
delta
between
the
two
or
is
that
something
that
the
test
is?
Are
we
comfortable
with
the
test
just
kind
of
implementing
this
logic
itself,
or
should
I
create
some
sort
of
reusable
logic
to
calculate
deltas
based
on
thresholds?
A
Yeah
so
either
like
so
either
you
know
I
just
I
could.
I
just
ran
this
test.
I
got
my
run
times
here
in
seconds,
my
worst
95,
my
150.
I
want
to
know
if
I
have.
I
want
to
know
if
I've
met
a
threshold
and
I
could
compare
I
could
find
out
if
I
met
the
threshold
by
comparing
against
my
last
run,
or
I
could
compare
it
against.
Let's
say
we
have
a
baseline
for
all
of
cuber
for
a
specific
release.
A
A
I
want
a
way
to
do
that,
so
I
mean
I
I
wanted.
I
want
to
know
outside
of
the
test.
I
guess
the
only
thing
I'm
just
trying
to
figure
out
is
like
whether
it
should
be
like
as
a
part
of
this
like.
Maybe
we
just
maybe
we
posted
both
like
maybe
we
posted
the
the
precise
we
post,
we
post
a
report,
the
data,
and
we
also
compare
it
to
our
baseline
for
a
specific
release.
We
have
them
both
here,
maybe
and
then
what.
E
A
B
But
what
I
mean
about
the
cube
baseline
is:
it
will
be
like
in
the
environment
that
we
control,
but
if
you
are
testing
your
laptop,
for
example,
will
be
completely
different.
So
then
it's
not
comparable.
That's
that's
what
I
was
saying,
but
if
you
run
that
like
before
your
you
know
your
chains
and
after
you're
changing
your
laptop,
then
of
course
you
can
compare.
You
know
it's
the
same
environment,
but
then
it's
very
small.
This
is
it
so
you
can
just
get
the
file
the
two
files
and
and
look
so
but
yeah.
B
A
A
A
A
B
Yeah
then,
in
this
case
the
delta
is
nice,
because
you
can,
just
you
know,
actually
show
the
percentage
how
bad
it
became,
because
we
could
expect
some.
You
know
if
it's
become
ten
percent
worse
in
your
laptop,
it
can
make
it
it.
Can
you
know
around
ten
percent
worse
in
the
other
environments?
Isn't
it
so
yeah?
Maybe
the
delta
might
be
nice,
however,
the
developer
when
it
they
push
the
pr
they
will
see
this
test
there.
Isn't
it
and
that's
the
goal
to
have
so
they
can
go
to
the
job
and
and
check
their
exactly.
A
We'll
get
it
we'll
get
it
on
the
pr
that'll
be
like
our
our
our
gate
like
that'll.
Have
that
will
be
consistent
every
time
so
yeah.
So
I
guess,
then,
this
focus
for
in
terms
of
the
developers
persona
is
that
it
is
meant
to
be
run
before
they
do
they
they
attach
their
code
and
then
and
then
after
to
get
to
the
delta.
So
like
just
to
you
know,
measure.
D
A
Yeah,
I
yeah,
I
mean,
I
think
it's
valuable.
I
I
don't
know
if
everyone's
going
to
use
it
but
like
if
you're
doing
perf
work,
then
this
is
a
valuable
tool
like
because
this
is
exactly
what
you're
targeting.
So
I
think
it
opens
the
possibility
for
people
who
are
who
are
looking
to
find
that
information.
We
can.
We
can
quantify
it
for
them
before
they
even
push
the
change.
A
A
Yeah
and
then,
and
then
also
it
would
extend
to
the
ci
too,
because
we
just
like
you,
said
dave,
we
just
you
know
we
default
the
config
file
whatever
to
the
baseline
and
ci.
So
it's
not
like
it
changes
the
the
workflow
at
all.
We
just
kind
of
now
we're
just
comparing
it
and
we
just
we're
always
going
to
make
sure
we're
comparing
up
the
samples,
whether
it's
the
dev
persona
or
the
ci
yeah.
That
makes
sense
okay,
yeah.
So
whatever
config
option
is
what
it
sounds
like
we
could.
A
I
think
I
mean
sorry
to
summarize,
like
I
think
it
makes
sense
in
this
tool.
We
have
a
config
option
so
that
you
have
the
opportunity
to
run
this
twice
with
your
delta
to
c
to
measure
improvement
and
then
ci
would
do
the
same
exact
thing
they
just
would
point
to
see.
I
would
point
to
a
baseline
that
we
have
somewhere
committed
in
repo
and
that
would
be
its
baseline
for
the
delta.
E
Take
two
results.json
in
this
case
and
you
would
be
able
to
generate
based
on
those
two
because
well
let
me
back
up
for
a
second.
I
expect
this
results.json
file,
that's
generated
from
this
perfscale
audit
tool
to
become
more
complex,
like
it's
probably
going
to
have
a
lot
of
things
in
it
a
whole
lot
of
things.
E
If
we
really
want
to
get
detailed
so
having
a
tool
that
can
take
two
of
these
files
to
these
results
files
and
give
you
just
kind
of
an
understanding
of
what
the
delta
is
and
let
that
be
used
as
a
pass
or
fail.
I
think,
having
a
separate
tool
that
can
do.
That
is
probably
what
I'll
end
up
doing
so.
You'd
retroactively
have
two
files
feed
it
into
this
tool
and
it
was
spelled
spit
out
at
delta.
A
So
yeah
you
just
you
you,
instead
of
instead
of
putting
it
all
just
kind
of
continuing
to
build
into
this
results
based
on
we're,
basically
gonna
we'll
keep
them
separate
and
we'll
have
one
file
for
the
deltas
one
for
the
transition
for
some
titles
or
whatever
it
is.
We
end
up
in
this
results
based
on.
B
Okay,
so
maybe
an
idea
instead
of
have
like
two
different
tools,
this
tool
has,
you
can
have
like
an
option
like
collect
and
then
you
can
have
another
option.
You
know
like
compare
you
know
or
something
like
that,
and
then
you
have
just
the
same
binary
tool
to
do
those
things
you
know
collect
and
compare
different.