►
From YouTube: SIG - Performance and scale 2022-01-27
Description
Meeting Notes: https://docs.google.com/document/d/1d_b2o05FfBG37VwlC2Z1ZArnT9-_AEJoQTe7iKaQZ6I/edit#heading=h.yg3v8z8nkdcg
A
Okay,
this
is
sixth
scale
january
27th.
Okay,
so
I'll
go
with
this
again.
Let
me
open
the
explanation,
so
the
the
period
job
we
talked
last
week
about
what
has
been
bothering
us
with
the
periodic
job
trying
to
get
the
answer
to
the
http
request,
counts
and
and
trying
to
figure
out
what
we
should
be
seeing.
So
what
I
did
was
like
marcelo
had
that
explanation.
Where
he
talked
about
you
know,
should
we
prime,
should
we
have
to
prime
our
our
job
so
that
we
can?
A
Actually,
when
we
measure,
when
we
do
an
increase
metric,
do
we
need
to
have
a
initial
vm
to
prime
the
to
prime?
The
time
series
database
to,
in
other
words,
have
like
a
the
first
first
item
to
compare
again
so
that
we
don't
increase.
You
know
from
no
value,
we
have
something
we
increase
from.
You
know
whatever
initial
value,
so
we
can
actually
measure
this,
and
so
what
I
found
was
that
that,
for
when
I
every
time
I
ran
this
test,
where
I
created
a
cluster,
I
did
this.
A
Like
a
dozen
times
I
created
a
cluster,
I
ran
the
the
perf
audit
test.
I
would
that
would
be
missing
the
the
create
events,
the
crate
requests-
and
I
did
this
both
with
the
hard-coded
range
selector
to
five
minutes
which
which
all
that
does
is
it
increases.
So
you
can
see
like,
I
think,
a
good
way
to
look
at
this
is
like
it
increases
the
amount
of
time
that
we
can
like
the
the
set
that
we
we
measure
from.
A
I
never
found
the
the
create
requests
showing
up,
so
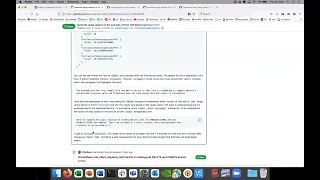
I
added
the
primer,
and
this
is
a
picture
of
the
primer
running
every
time
and
you
can
see,
there's
no
create
pod
requests
that
show
up
in
the
primer,
and
then
I
run
the
density
test
after
and
I
we
do
get
the
create
pod
count
that
shows
up
so
that
verified
to
me
the
theory
that
like
where
we
need
to
prime
this,
so
that
so
that
that
was
helpful.
That
was
relieving
to
see
so
they.
A
I
have
a
whole
explanation
here
as
to
like,
what's
going
on,
basically
like
increases
based
on
rates,
the
rate
function
and
there's
a
good
here's
like
a
little
summaries
like
the
problem
with
the
first
sample.
The
new
metric
series
is
that
the
rate
is
attempting
to
compare
against
a
non-existent
previous
value.
Prometheus
does
not
have
enough
data
in
which
to
interpolate,
so
increase
and
rate
are
both
our
interpolation.
A
So
we're
like
trying
to
figure
out
what
we
expect
to
happen
like
we're,
trying
to
look
at
this
set
of
data
and
expect
how
you
know
what
would
it
look
like
if
it
was
run
over
this
series
of
times
so
we're
kind
of
like
we're
kind
of
guessing
that's
what
these
values
are.
That's
what
these
metrics
are
supposed
to
do,
but
we
have
nothing
to
compare
against.
So
we
absolutely
need
to
prime
to
figure
this
out.
A
A
Why
do
I
see
40
when
I
use
smaller
numbers,
like
so
smaller
interpolation
times,
smaller
range
vectors,
and
I
found
an
explanation
for
that.
While
I
was
actually
looking
for
answer
this
and
it
turns
out
that
this
is
a
known
issue-
it's
it's
has
to
do
with
signal
processing.
It's
called
aliasing,
there's
a
link
to
it
here,
but
you
can
see
here
like
this,
this
guy,
who
is
commenting.
I
think
he
put
comments
on
both
of
these
he's,
like
one
of
I
think
he's
one
of
the
core
contributors
to
prometheus.
A
So
the
recommendation
was
that
if
you
want
to
get
an
accurate
value,
you
have
to
have
a
large
and
large
enough
range
vector
otherwise,
you're
gonna
get
these
these
extrapolated
values
that
are
incorrect
like
40.
and
that's.
Why
and
that's
what
we
observe
like
when
we,
when
we
run
this
at
five
minutes,
it's
enough
of
a
of
a
range
vector
that
it
that
the
extrapolated
value
is
close
to
what
the
expected
value
is
it's
because
that's
like
21.
A
and
and
this
to
safely
measure
this
we
need
to
in
our
excuse
me.
Our
range
vector
needs
to
be
longer
than
our
test.
It
needs
to
be
much
longer
than
our
tests.
Our
test
right
now
is
like
one
minute
or
so,
and
so
setting
it
to
five
minutes
is
fine,
but
we
have
longer
tests.
We're
going
to
need
this
to
be.
We
need
this
to
be
a
little
bit
longer.
We
don't
want
it
to
be
considered
short,
otherwise,
the
extrapolated
values
we
can
run
into
analysing
again.
A
A
A
So
pretty
much
whenever
I
did
the
increase,
ram,
increase,
query
or
increase
metric
with
the
range
query
with
when
I
would
set
the
time,
no
matter
what
I
would
change
the
metric
to
it
just
failed
with
the
range
query.
It
was
just
wrong,
no
matter
what
what
I
did.
I
wasn't
sure
what
I
needed
to
set
it
to,
but
if
you
have
an
example
for
how
this
would
look,
that's
fine.
A
B
B
If
it's
only
for
a
counter,
you
know
that
we
do
the
increase
just
check
the
the
last
five
minutes
should
be
fine,
isn't
it
we
won't
just
want
to
take.
You
know
the?
What's
the
you
know
the
the
biggest
value
that
comes
from
the
metric,
I
think
maybe
the
last
five
minutes
might
be
fine.
I'm
not
not
really
sure
I
didn't
think
very
well
about
that,
and
and
well
I
think,
maybe
we
can
approve
that.
So
actually
it's
it's
ready
to
to
be
merged.
B
A
A
A
I've
yeah
I've
tried
it,
it
just
failed.
I
don't
know,
I
don't
know
what
it
how
it
should
look.
If
you
want
to
try
this
like
after
marcelo,
I
like,
I
I'm
all
for
it
like.
I
think
it,
because
if
we
could
to
get
rid
of
offset
that's
fine,
I
mean
austin
works.
Fine
and
just
like
it
brings
us
to
the
the
end
of
the
test
that
we
just
ran,
and
we
just
look
back.
A
A
B
Yeah,
basically,
what
french
query
is
doing
is,
for
example,
you
take
like
an
interval
of
20
minutes.
Okay
and
then
you
see
like
a
steps
of
five
minutes
and
then
you
get
like
you
know.
You
know
four,
you
know
results,
so
it
will
be
like
you
know
many
requests
of
five
five
minutes
the
steps
and
then
you
need
to
you
know,
take
the
average
or
the
max
of
this
results
depends
what
you
want
to
see
here
and
the
steps
can
be
also
big.
B
A
Yeah
I
mean
I
mentioned
the
limitations
to
this
to
doing
this,
like
I,
I
put
it
at
the
top
like
limitations
to
this.
That
I
see
is
like
we.
We
first
need
to
find
the
right
range
vector
which
is
going
to
be
based
on
the
time
of
the
test
and
then
like
that's
one
concern
I
have
you
know
using
a
range
query
could
help
there.
I
think,
but
I
mean
I
think,
like
this
is
at
least
a
good
start
yeah.
A
The
other
theory
I
have,
which
I
think
was
along
the
same
lines,
is
like
how
many
primers
like
I
only
do
one.
I
only
prime
one
time
at
the
first
time
that
the
this
one,
the
sweet
tart,
starts
and
that's
it,
and
we
only
have
one
test
right
now.
So
if,
but,
if
there's
too
much
time
between
tests,
then
we
would
need
another
primer.
C
So
the
entry
actually
existed,
though
that's
the
thing.
So
it's
got
something
to
compare
against
forever
once
the
entry
actually
is
put
into
the
database.
It's
it's
just
for
an
increase.
We
have
to
start
from
something
to
calculate
what
the
final
result
is
like.
If
we
don't
have
something,
then
it
gets
weird,
but
we
do
have
something
if
it
was
ever
primed.
C
If
there
was
ever
a
vmi
started,
then
it
should
remain
consistent
from
that
standpoint,
because
that
increase
means
what
like,
if
we're
talking
about
vmi
creations
or
whatever
the
increase,
could
be
at
the
start
of
the
interval.
Let's
say
there
was
30
bmi
creations
from
a
previous
run,
so
it
existed
there
and
then,
when
we
do
our
test,
we'll
see
a
difference
between
like
start
at
30
and
then
maybe
there
was
like
100
or
something
after
that,
and
the
difference
would
be
70..
So
we
know
that's
why
we
get
returned.
A
Yeah
I
mean,
I
guess,
that's
true,
given
the
fact
that
you
know
every
time
we
run
the
test
after
the
initial
one
like.
I
would
see
this
like
afternoon
after
it
went
back
like
hours
later
it
was
okay.
I
mean
I
think
I
was
running
the
primer,
but
I
think
we
would.
We
were
seeing
this
earlier,
like
with
our
tests
like
every
time
we
ran
it.
You
know
no
matter
when
it
was,
it
was
working.
A
A
I
think
this
gives
us
like
what
we're,
after
in
terms
of
the
measurements
for
for
create
requests,
but
but
yeah
I
mean,
I
think,
range
effect
range
query
could
be
something
we
we
improve
on
marcelo.
Okay,
I
mean:
do
you
guys
have
any
other
questions
about
this
like?
Does
this
make
sense
to
you
guys?
What
is
what
I
have
here.
C
The
only
thing
I'm
uncertain
about
is
that
five
minute
interval,
if
it
should
be
something
dynamic
where
we
somehow
calculate
based
on
the
time
of
the
test
and
just
ensure
that
it's
large
enough
to
avoid
interpolation.
I
don't
know
where
this
interpolation
problem
occurs.
I
think
it
might
occur.
Based
on
this
grape
interval,
it's
unclear
how
what
it's
related
to
so
like
when
does
interpolation
happen.
It's
going
to
happen.
A
C
B
C
And
since,
if
you
know
the
scrape
intervals
every
three
seconds
it's
going
to
interpolate
what
the
next
interval
that
it
doesn't
even
have
would
have
been
and
say:
well,
it's
probably
the
same
as
the
first.
So
if
we
got
20
then
it
would
say
that
over
a
minute
that
it
would
be
40.
and
then
for
two
minutes.
Let's
see
it
probably
looks
a
little
bit
more
accurate
depending
on
the
timing,
yeah
see
and
then
for
I
would
say
once
you
get
past
two
minutes,
it
should
probably
start
leveling
out.
Would
it
not
yeah.
C
A
A
A
A
A
C
Not
accurately
looking,
I
would
try
to
how
close
did
we
get
with
the
just
the
range
of
the
test
like?
Could
we
just
sleep
a
little
longer
to
give
us
more
like
samples,
something
like
that?
Just
I'd
like
for
it
to
encompass
the
test,
or
else
we're
going
to
have
problems
right,
as
we
add
a
new
test,
because
they'll
begin
overlapping
and
stuff.
A
B
C
C
B
A
C
I
think
for
the
test
to
take
longer,
I'm
not
convinced
that
we're
going
to
see
this
problem
and
I
think
it's
with
it's
a
combination
of
the
ratio
between
the
scrape
time
and
that
duration
that
range
that
we're
looking
over
so
it
as
that
ratio
gets
like
more
distance
between
it
or
I
don't
know
how
to
describe
that,
but
it
becomes
less
and
less
of
a
problem.
So,
at
five
minutes
with
a
30
second
scrape
interval,
it
seems
like
it.
C
A
A
B
I
don't
know
if
you
well,
this
should
test.
You
need
longer
interval
if
you
have
a
problem,
but
I
think
you
know
for
that
for
close,
just
pure
make
it
like.
You
know,
you
know
configurable
again
for
the
the
time
that
the
the
tool
executed
and
put
like
a
sleep
of
I
don't
know
four
minutes.
Maybe
I
I
don't
know
how
long
the
test
runs.
One
minute,
maybe
so,
and
and
then
we
run
also
to
with
a
longer
you
know,
interval
and
the
offset
is
also
good.
A
B
A
B
A
Yeah,
no,
I
I
agree
with
you
like
it's
just.
There
are
limitations
as
like
I
mentioned
there
like
the
it
gives
us
like
for
now
for
the
one
test.
We
have
it's
fine,
but
it's
not
ultimately
the
what
I
think
the
long
term
should
be
yeah.
Okay,
I
think
that's
that's
pretty
much
where
we'll
get
some
more
answers
there.
Okay,
all
right,
yeah!
I
can
do
that
and
let
me
see
what
I
find.
What
do
you
want
to
do
with
this
like?
I
can
do?
Should
we
wait,
since
this
is
ready?
A
A
C
C
A
Yeah
all
right,
I
can
do
that
and
then
then
I
think
so
then
we
know
it's
five
minutes
and
then
what
I'll
do
is
because
yeah
I
just
want
to
get
this
like
kicked.
I
want
to
get
like
the
start,
getting
some
results
in
that
job
as
soon
as
possible.
So
I
can
do
this
I'll.
Do
this
right
away
after
this
meeting
it
we
can
start
like,
hopefully,
roll
this
out
soon
and
then
I'll
follow
I'll.
Do
a
follow-up
pdr
with
the
rest
of
the
stuff
in
the
investigation.
A
Okay,
cool
good,
all
right.
So
let's
go
to
next
item
so
fabian
mentioned
on
the
mailing
list.
He
was
asking
if
we
have
a
general
statement
of
keyword
scale,
I
kind
of
wanted
to
get
you
what
everyone
thinks
about
this.
I
totally
agree
like
we
do
want
one,
but
I
just
want
to
see
what
you
guys
think
because
scale
is
like.
A
B
We
are
doing
you
know,
tests
for
openshift,
but
I
don't
know
if
it
can
be
open
or
not,
but
we
weren't,
you
know
to
open
that.
We
need
to
do
kubernetes
tests
and
get
access
to
resource
so
because
you
know
this
scale
test,
I
don't
know
what
would
be
like
the
best.
You
know
something
that
we
can
show.
100
nodes
should
be
enough.
So
for
now,
what
do
we
need?
We,
we
don't
have
this.
You
know
it's
actually
very
good
to
discuss
that
here.
A
Yeah,
well
I
mean
mainly
marcel
what
I'm
wondering
is
like
I
think
like
there
are.
Multiple
people
are
using
hubert
right.
I
mean
like
we're
using
internally
like
what
is
like
the
scale
people
are
reaching
like.
We
have
a
scale
number
that
we're
reaching,
but
our
use
cases
is
different,
say
you
know
what
you
guys
are
doing
internally
with
openshift,
and
so
I
would
imagine
you're
going
to
reach
a
totally
different
number
of
nodes,
like
that's
how
I'm
interpreting
this
is
like
he's.
A
B
A
B
C
What
problem
we
have
with
this
discussion,
I
think,
is
any
numbers
that
we
give
out.
That's
a
bar,
and
I
want
to
make
sure
that
we
look
favorable
like
I
want
it
to
reflect
reality,
but
I
want
to
make
sure
that
you
know
we're
reflecting
like
numbers
that
are
good
if
they
aren't
good.
I
want
to
make
them
good,
like
I
want
to
improve
performance
before
we
release
anything.
I
don't.
B
C
A
A
But
yeah,
maybe
we
just
need
to
pull
in
fabian
one
point
and
talk
about
it.
I
mean
because
we
we
don't
have
like.
What's
the
I
mean,
if
we
were
to
ask
fender,
ask
anyone
who's
using
kubert
right
now,
wouldn't
find
what
the
largest
scale
is.
You
know
I
mean:
do
we
want
to
use
that
number?
I
mean
that's
kind
of
the
question.
I'm
asking.
Would
we
use
that
number
or
would
we
wait
for
us
doing
these
tests
that,
like
I
have
here
in
the
slo
document,.
B
A
C
About
the
test,
first
right
and
one
of
the
things
that
kubernetes
has
that
makes
things
more
difficult
for
convert
is
kubernetes.
We
can
test
a
ginormous
scale
very
quickly
by
bursting
into
the
cloud
and
like
the
instances
that
might
be
used
might
cost
a
fortune
if
you
left
them
online,
but
just
running
a
hour-long
performance
test
periodically
like
it's
not
going
to
cost
that
much.
So
it's
the
cost-effective
way
to
validate
kubernetes
at
scale.
C
We
don't
have
a
cost-effective
way
of
doing
that
with
cuvert
at
the
scale
that
we
would
really
want
to
be
talking
about.
We
have
like
at
red
hat,
there's
some
internal
scaling,
that's
going
on
and
there's
huge
numbers
of
nodes
and
huge
results
that
we
get
out
of
these.
That
would
be
really
interesting
to
publish
some
day
if
we
can,
but
we
can't
reproduce
it
because
we're
borrowing
that
environment
and
it's
going
to
be
given
back
to
somebody
else
eventually
or
we
don't
have
it
forever,
and
it's
also
based
on
downstream
products,
not
kubert
upstream.
A
C
C
C
A
Our
tests
like
we
need
to
know
like,
because
I
mean
scale
is
all
about
pressure
and
the
pressure
that
you're
pulling
in
all
different
ways.
If
we
can
describe
the
different
ways
that
we're
gonna
apply
pressure
with
our
testing,
if
we
have
a
way
of
consistently
applying
pressure,
no
matter
what
the
zone
is,
we
can
at
least
get
some
numbers,
and
then
I
think,
like
at
least
like
you
know,
like
you
know,
he
says
like
in
our
and
our
or
our
ci
like
this
would
at
least
give
us
like
some
numbers
based
on
our
ci.
A
Excuse
me
what's
the
scale
that
it
achieves,
I
mean
then,
like
I'd,
feel
more
comfortable
because
yeah
I
mean,
I
think,
like
that's,
that's
the
minimum
requirement
before
we
can
get
to
these
feeling
comfortable
about
this.
I
think
we
have
to
have.
We
have
to
agree
on
this.
Like
you
know,
we
have
to
agree
on.
I
mean
really
the
tests
that
are
listed
here
and
we
have
to
have
a
test
framework,
that's
consistent
and
we
need
ci,
like
that's.
B
Yeah,
so
the
way
that
I
see
that
you
know
we
we
need
to
have
like
we
can
define
the
best
framework.
For
example,
the
cook
burner
might
be
a
candidate
for
that
or
not
so
we
can.
We
can
discuss
that.
Actually,
kubernetes
has
this
on
his.
You
know
their
own
tool
for
that
you
know
to
run
the
performance
test.
B
A
B
B
A
B
In
they
are,
they
are
maintaining
that,
but
I
also
don't
know
if
they
want
they
are
willing
to.
You
know
accept.
So
probably
we
cannot
put
crds.
You
know
based
resource
inside
this
because
kubernetes
doesn't
want
to.
You
know,
support
35
code
for
that,
but
they
are,
they
are
stressing,
pods
and
and
all
the
others.
You
know
official
resource
here,
and
this
is
pretty
much
how
they
run
their
tests
using
is
using
this
tool.
Also,
this
is
toolbox.
I
think
it
also
creates
the
cluster.
So
it's
doing
more
than
running
the
test,
so
they
deploy.
B
B
And
what
are
you
just
just
to
conclude
what
we
were
discussing
before?
Okay,
so
we
can
have
like
a
set
of
tests.
Oh
yeah,
it's
just
so
we
can
have
yeah,
so
we
can
have
a
defined
set
of
tests
and
the
tool
that
we
want
or
that
we
recommend
people
to
use,
but
the
the
task
that
you
know
someone
else
might
run
and
give
some
limits
will
be
like
known
official.
B
You
know
limits
that
people
can
provide,
but
the
official
ones.
It
must
be
something
that
we
define
here.
You
know
in
the
meetings
and
find
a
cluster
to
run
it,
and
somehow
I
don't
know
you
know
something
like
that,
because
if
we
ask
someone
else,
it's
it's
just
like
an
official.
You
know
limit
that
people
can
can
help
us
with
that,
but
we
cannot
assume
that
it's
as
official
limits.
B
A
I
think
like
so
what,
when
I
think,
like
three
things
like
one
of
those
like
we
need,
we
need
to
describe
our
test,
so
it's
clear
the
pressure,
we're
applying
that's
what
I
want
to
do
here
see.
I
I'd
like
to
verify
that
the
behavior
like
in
the
current
keyword
release
like
and
and
that
the
behavior
of
a
test
is
what
we
expect,
like
the
pressure
that
we're
applying
is,
is
doing
what
we're
expecting
it
to
do
the
current
release
of
pubert,
so
our
tests
are
just
like,
because
we
can't
really
measure
scale.
A
We
give
this
test,
like
I
I'll
happily
do
this
internally
like
run
these
tests
and
then
come
up
with
some
numbers
of
infra
information
about
like
how
scale
is
defined
like
in
my
measurement
and
that
would
like
whatever
those
are
like
we
need.
We
need
all
the
measurements
that
define
pressure
and
then
we
at
the
end
of
it,
we
spit
out
a
number
number
of
nodes
and
then
well
I
mean
because
we
need
we
actually
need
all
of
them
like
we
need
nodes.
B
A
We
need
all
of
the
pressure
points
and
that's
like
our
combination,
and
then
then
we
can
create
our
little
headline
like
here
like
okay,
here's,
the
number
of
notes
we've
seen
scale
to,
but
we
want
to
have
the
detail
like
just
like:
okay
nvidia
reaches
whatever
this
amount
of
nodes.
This
is
what
their
summary
of
their
pressure
was.
We
know
keyword
can
scale
to
this
amount
of
nodes,
and
you
know,
given
this
amount
of
total
pressure.
A
B
A
B
B
Yeah
I've
been
I've
been
actually
using
that
for
a
while-
and
I
recently
created
a
pr
for
that.
So
I
extend
quickburner
to
create
vms
and
vmi
as
well
and
also
replica
set
vm
replica
set.
So
it
can
understand
those
kind
of
resource,
and
so
coop
burner
has
a
way
you
know
just
to.
It
was
also
inspired
in
the
test
that
you
did.
B
B
B
B
It
dumps
it's
done
so
the
way
that
could
burn
actually
do
is
dumps
to
a
file
or
you
can
push
your
elastic
search
this
this
data
and
then
you
can
have
like
graphone
connect
to
the
elastic
search
and
then
you
can
just
visualize
the
data
too,
but
you
don't
need
to
do
that.
So
you
can
use
kubernetes
to
generate
the
load
and
see
the
information
in
your
prometeus
and
grafana.
B
A
A
Is
this
wood
like?
What
does
this
bring
us
like?
Where
would
you
say
like
this
brings
us
in
terms
of
like
our
current
audit
tool
like?
Does
it
bring
us
pretty
close
to
the
like?
If
could
you
swap
this
out
right
now
like
for,
if
you
had
this
merged
with
the
for
what
you
have
right
now
in
the
in
the
the
the
periodic
job.
B
Yes,
so
the
audit
tool,
actually
it
has
like
more
friendly.
You
know,
output
from
the
the
matters
that
we
are
collecting.
The
kubernetes
can
collect
those
metrics,
but
will
be
like
a
more
query
format.
You
know
the
the
output,
so
it's
I
don't
know.
If
we
we
can.
You
know
yeah,
but
I
think
it
would
be
nice
to
use
that
to
generate
load
later
so
the
cook
burner,
and
then
we
try
it
as
as
you
mentioned.
A
B
B
A
A
So
yeah,
okay!
So
that's
why?
Okay,
all
right
so
the
so!
This
gives
us
our
framework
and
that's
fine,
then
okay,
so
we
just
need
to
so
you've
got
this
this
pr
and
then
we
can
add
some
look
at
adding
something
I
can
help
with
you
with
this.
If
you
like,
if
you
want
me
to
look
at
the
steady
state,
I
can
help
do
this
in
a
separate
vr.
If
you
want
or
if
you're
already
looking
at
it.
That's
fine
too.
C
A
B
Yeah,
so
it's
seems
to
me
like
the
raul.
Is
the
guy?
That's
responsible
for
that,
and
I
I
was
you
know
I
just
checked
the
contribution
of
the
you
know,
people
on
this.
They
could
burn
and
since
you
mean
like
raul,
is
99
responsible
for
that.
So
it's
pretty
much
one
one
guy
so
and
he
he
said
he's
reviewing
that
and
he's
very
much
like
very
giving
a
lot
of
attention.
So.
B
C
B
C
A
C
B
C
B
B
B
Also
so,
and
I
I
was
doing
like
much
larger,
you
know
test,
that's
why
waiting
just
amount
of
time
makes
sense.
For
me,
this
is
the
the
template.
This
is
a
very
simple
template
with
ephemeral.
You
know
a
disk,
but
we
might
want
to
test
it.
Also
with
you
know,
real
pvcs
and
maybe
more
network,
because,
as
we
saw
in
some
other
experiments,
pvcs
and
more
network
nics
potentially
increase
the
number
of
api
requests
and
overload
the
system
and
it's
something
that
we
can
catch.