►
From YouTube: SIG - Performance and scale 2021-08-26
Description
Meeting Notes: https://docs.google.com/document/d/1d_b2o05FfBG37VwlC2Z1ZArnT9-_AEJoQTe7iKaQZ6I/edit#heading=h.4xsswmk8jszy
A
Okay,
welcome
to
6k
everybody,
it's
august,
26th.
The
link
to
the
design
large
of
the
meeting
notes
is
in
the
the
chat.
Add
yourself
as
attendee,
please,
okay!
So
today's
agenda
first
item
is
shared
dashboard
location.
I
thought
of
this
after
last
meeting,
because
I,
after
we
kind
of
had
I
could
tell
there's
like
we've,
had
a
bunch
of
dashboards
that
people
have
created
around
some
of
the
metrics
that
we've
had,
and
I
was
just
wondering
because
I
was
looking
around.
A
I
was
seeing
looking
at
the
q
verts
repo
for
dashboards,
and
I
wasn't
it
didn't.
Look
like
there
was
some
of
the
the
dashboards
that
people
were
showing
that
were
pretty
cool
that
doesn't
look
like
they
were
merged
into
that
qvert
repo,
and
so
I
just
wanted
to
bring
up
the
ideas
like
if
you
know
it
seemed
like
that
might
be
a
cl
a
case,
a
place
that
we
could
all
share.
Dashboard
ideas
and.
A
C
A
C
C
B
One
one
I
I
tried
a
few
of
those
dashboards
that
are
in
the
cuber
ci
and
one
important
point
I
would
like
to
see
for
the
share
dashboard
location
is
that
we
document
how
to
or
we
make
sure
the
dashboards
are
properly
exported
and
that
they
are
compatible
with
the
grafana
operator
or
just
like
export
them
as
json
and
not
as
some
custom
resource.
So
we
can
import
that
into
any
grafana,
because
I
I
couldn't
import
most
of
the
dashboards.
A
True,
so
like
what
I
could
see
is
like
like,
when
we're
doing
some
of
the
like
the
measurements,
you
know
for
our
for
our
public
quests
and,
like
you
know,
we're
we're
trying
to
say.
Okay,
this
improves
performance,
you
know
of
some
sort,
I
mean
we
can
it's
good
to
see
it
in
the
tool.
It's
also
good
to
see
it,
have
a
visual
and
have
her
have
the
opportunity
to
show
visible
a
visual
as
well
and
like
if,
if
we
have
an
easy
way
to
do
that,
I
think
it
sort
of
increases.
A
The
likeability
likely
likelihood
that
someone
will
include
those
dashboards
and
without
without
having
to
do
like
a
whole
lot
of
work.
We
can
just
you
know,
paste
them
into
our
import
them
until
into
it,
with
the
make
cluster
up
and
import
it
and
then
and
then
take
screenshots.
That
might
make
it
a
lot
easier.
So
so
this
is
the
link
that
we
have.
This
is
like
where,
where
we
can
use-
and
that's
like
where
the
current
dashboard
set.
B
Share
a
few
of
those
rain
tank
dashboards
and
somebody
asked
if
we
can
host
that
ourselves.
I
looked
that
up
and
rain
tank
is
just
any
grafana
instance,
so
you
can
set
up
like
we
wanted.
We
would
want
a
kubrick
refund
anyways.
We
can
set
that
up
in
a
way
that
it
can
also
receive
snapshots
and
we
can
instead
of
taking
screenshots,
we
can
actually
share
snapshots
to
the
cube
right
grafana
instead
and.
A
A
B
A
Okay,
so
hello,
so
for
now
we
can.
Maybe
we
can
start
with
this
just
so,
we
have
a
shared
location
and
then
eventually
like.
If
we
have
this
place,
that
we
with
ci
dashboards,
we
can
start
taking
some
of
the
dashboards
that
we've
created
here
and
adding
them
to
that
grafana
job
so
that
we
can
grab
snapshots
or
whatever,
because
yeah
that
would
be
pretty
cool.
They
have
to
have
okay,
so
that
that
sounds
good.
B
And
as
a
future,
at
some
point
in
the
future,
if
we
build
like
a
general
keyboard,
dashboard
or
multiple
of
those
dashboards
are
also
useful
to
admins.
It
might
be
an
idea
to
publish
those
to
the
grafana
marketplace
from
github,
so
people
search
grafana
for
hey.
I
want
a
keyboard
dashboard
and
they
just
get
one
officially
suggested.
Okay,.
A
Lot
of
a
lot
of
places,
we
can
go
with
this:
okay,
yeah
cool,
okay.
Let's
move
to
the
second
item,
so
api
priority
fairness.
I
mentioned
this
last
time,
so
I
wrote
a
document
about
some
testing
what
I
did
and
some
information
about
this.
So
let
me
talk
through
this
for
10
minutes
or
so
so.
The
the
api
priority
in
fairness
is
was
introduced
in
alpha
and
kubernetes
118.,
it's
beta
in
120,
so
it's
enabled
by
defaults
and
basically
api
and
primary
fairness.
A
A
There's
a
lot
of
things
that
we
can
sort
of
do
with
this
and
and
like
the
the
way
that
if
we
leverage
to
like
the
sort
of
the
rate
limiting
aspect
of
it
can
be
distributed
or
can
be,
can
be
tagged
to
or
broken
down
by,
api
calls
or
basically,
by
the
our
back
rules
by
user
by
verb.
Everything
and
you
can
create
policies
around
all
these
things
to
do
some
form
of
rate
limiting
and
it's
a
really
granular
way.
A
So
it's
it's
actually
really
cool,
and
so,
in
addition
to
protecting
the
api
server,
you
can
use
other
things
like
protecting
a
user
from
from
another
or
from
a
user
or
protecting
like
some
sort
of
api,
like
whatever
it
is
from.
You
know,
if
you're,
a
big
user
of
an
api,
you
know
giving
yourself
priority
by
user
or
or
making
sure
that
that
those
apis
get
through
a
higher
priority.
A
A
So
I'll
talk
through
a
little
bit
of
what
this
concept
is
and
then
kind
of
my
goal
is
that
if
we
can
kind
of
get
kind
of
an
understanding
of
what
this
is,
maybe
we
can
discuss
how
you
know
what
that
policy
could
be,
and
it
probably
won't
this
man.
I
think
it's
likely
to
end
up
as
a
milliness
right,
but
just
to
give
you
guys
an
introduction
to
the
topic
I'll
I'll
talk
through
this
here.
A
This
is
like
how
something
will
be
how
something
can
get
rate
limited,
so
the
number
of
queues
and
all
these
other
things.
These
configurations
will
affect
the
priority
and
if
requests
can
get
rejected
and
all
sorts
of
things
like
that,
so
here's
an
example
just
to
give
you
a
taste
of
this,
so
a
flow
control.
This
this
example
is,
it
will
capture
vmi's
list
requests
for
this
service
account
lister
zero
from
this
namespace,
and
you
can
see
like
some
things
in
here
like
this.
A
So
what's
important
here
is
that
there's
sort
of
a
one-to-many
relationship
and
that
you
can
every
flow
control
can
list.
You
have
many
flow
controls
that
list
the
same
priority
level
configuration,
and
so
this
plays
sort
of
a
role
in
how
the
fairness
algorithm
works,
which
I
can
talk
to
after
I
talked
about
what
the
plc
is
here,
so
the
the
example
priority
level
control
here
that
that
reference
above
this
is
has
a
few
fields.
A
A
So
that's,
basically
your
priorities
way
to
think
about
it
and
then
there's
the
the
configure
or
how
you
will
be
how
you
can
reload
the
number
of
cues
the
queue
length
limit
and
the
hand
size
cues
that
this
is
pretty
intuitive.
So,
like
you
know,
the
note
thing
about
just
a
number
of
lists,
the
lengths
of
those
lists
and
size.
This
is
the.
This
is
part
of
the
fairness
algorithm
hand.
Size
is
referring
to
kind
of
like
a.
A
I
think
it
comes
from
the
like
cards
like
a
deck
of
cards.
If
you
were
to
have
a
remaining
in
your
hand,
but
the
way
to
think
about
this
is
the
the
definition
of
is
that
this
is
the
number
of
cues
that
a
flow
control
can
end
up
in
and
what's
important
about
that
is
in
this
algorithm.
Is
that
let
me
see
I
actually
want
to
see
here
go
I
think
I
have
like
I'll
show
you
there's
a
good
picture
of
it.
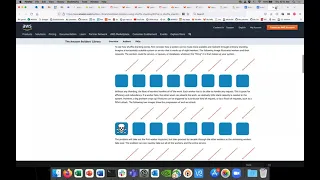
A
So
the
idea
is
that
there's
a
good
picture
so
when
there
are
a
lot
of
heavy
users
that
are
accessing
a
bunch
of
different
cues,
the
idea
is,
you
want
to
distribute
those
users,
two
different
cues,
but
the
the
problem
is:
is
that
you
don't
want
you
sort
of
don't
want
to
end
up
in
the
wrong
queue
so
hand?
Size
is
the
number
of
queues
that
you'll
end
up
in,
so
that
number
was
four
so
in
that
exam.
A
Let's
say
if
you,
let's
say
like
the
rainbow
here
or
something
like:
if,
if
the
rainbows
have
a
user,
it's
going
to
clog
up
these
cues,
but
if
you're
across
four
boxes
then
you'll
have
the
your
request
will
eventually
get
through
so
you're
not
going
to
be
run
over
by
someone.
That's
got
a
lot
of
requests
going
through
you'll
eventually
get
attention
from
the
api
server
and
there's
some
old
probability
about
this
in
this
table.
A
Okay,
so
the
so,
with
that
in
mind,
like
you,
can
we
want?
We
want
to
have
a
lot
of
well.
Actually,
let
me
go
back
up
for
a
second,
so
the
idea
with
the
this
this
shuffle
algorithm
is
that
the
we
want
to
have.
We
want
to
have
a
lot
of
workers.
We
want
to
have
a
lot
of
flow
controls.
This
is
like
the
workers
and
the
for
the
for
the
algorithm,
so
we
want
to
have
a
lot
of
them.
A
A
The
way
it
was
described
is
that
it's
better
for
burst
requests,
so
they
don't
get
rejected,
they
can
pile
up
in
the
queue
and
but
all
the
stuff,
though,
does
cost
more
memory
like
when
and
so
the
number
of
queues
that
need
to
be
maintained
and
and
so
forth
it
does.
It
does
use
more
memory,
so
something
to
consider,
but
the
ultimate
result,
though,
is
that
we
don't.
D
A
A
So
the
by
default,
the
you
can
see
here
like
the
there,
are
a
bunch
of
cues
that
are
a
bunch
of
flow
schemas
that
are
created
and
they
all
share.
They're
all
workers
in
this
workload
high
priority
level
configuration
which
is
here
so
the
control
plane
protects
itself
by
using
this
little
configuration.
A
Like
so
you're
gonna
you're
going
to
get
you're
gonna
get
into
the
catch-all
well
see.
I
haven't
tried
this
with
the
catch-all.
It's
a
good
question
like
you
get
you'll
get
into
the
low
priority.
I
think
what
you'll
end
up
with
is
a
is
a
ton
of
rejected
requests.
You
can
see,
there's
no
queues,
I
mean
it's.
A
I
haven't
tried
this
with
none,
but
there's
no
cues
and
there's
no
hand
size
and
no
q
length.
So
I
think
maybe
you
get
rejected,
but
I
what
I
mean
by
overrunning
the
the
vap
server.
I
mean
in
the
case
prior
to
having
this
like
having
free
reign
if
there
was
no
sort
of
api
priority
inference.
So
in
the
case
of
the
catch
all
I
would
expect
that
these
are
these
are
rejected,
since
there
is
no
queue.
D
A
C
C
A
A
B
A
A
A
Yeah,
okay,
so
the
testing
I
did
was
focused
on
trying
to
like
understand
like
what
different
cues
queue,
lengths,
hand,
sizes
and
how
they
affect
different
things.
So
I
have
a
few
sort
of
assumptions
that
go
into
this.
So
one
is
that
I,
during
this
testing,
what
I
do
is
I
disable
the
client
side
rate
limiter
and
then
second
thing
is
that
I
never
see
the
api
server
get
completely
overrun.
A
A
One
of
the
things
I
saw
during
this
is
that
during
the
tests
there
was
a
lot
of
or
eventually
over
time,
the
tests
like
the
the
latencies,
went
down
for
the
apis
over
the
for
like
different
verbs,
like
list,
for
example,
forget
and
other
things.
Things
just
got
really
fast,
and
I
noticed
this,
but
when
I
went
through
the
the
aps
server
logs
and
I
saw
like
the
how
how
much
faster
xcd
got
during
this,
it
was
from
caching
or
something
it
was
significantly
faster.
A
Going
from
you
know
almost
you
know:
300
2000,
milliseconds,
all
the
way
down
900
500.
That
gets
really
quick
over
time
to
the
point
that
it's
actually
interesting,
how
it,
how
it
does
this,
but
based
on
the
load,
so
here's
kind
of
what
it
did.
So
I
have
600
lists
per
second
of
50
vmis,
so
I'm
just
doing
a
get
request
in
a
name
space
that
gets
all
the
bmis.
This
is
pretty
expensive.
600
per
second
is
extremely
expensive,
so
the
concurrency
limit
for
this
is
calculated.
A
This
is
a
prometheus
metric,
so
I
grabbed
it.
It's
178..
It's
the
same
for
all
of
them.
I
did
a
buy
namespace
flow
control
and
then
here's
what
I
had
for
the
priority
level:
20
priority,
10
cues
20
length,
and
hence
that's
four.
So
I
had
a
bunch
of
metrics.
I
built
like
a
little
dashboard
to
kind
of
look
at
this
so
and
this
this
is
basically
what
I
pulled
from
it.
I
do
see
that
the
we
get
180
requests
per.
Second,
I
go
through.
A
It
eventually
settles
down
at
a
much
lower
rate.
At
least
that's
that's.
What
shows
we
see
a
cue
wait
time
in
1.5
seconds
that
becomes
nothing
over
time.
Our
request
execution
time
was
very
high
at
first,
it
goes
down
rejected
requests,
so
this
returns
a
boot
to
409
for
29
that
risk
return.
From
from
this,
we
were
getting
a
ton
of
rejected
requests
at
first.
Eventually,
it
completely
goes
away,
and
this
happens
when
the
cube
gets
full.
A
That
was
so
it's
one
of
the
ways
it
can
happen,
but
this
is
what
all
these
were.
Is
the
queues
were
just
filling
and
we're
getting
rejected.
Requests
dispatch
350
per
second
eventually
settles
down
a
little
bit
lower.
The
number
of
enqueued
requests.
19
gets
down,
lower
lists.
Latency
like
I
was
talking
about,
is
during
this
time.
It
goes
up
to
10
seconds.
It
even
settles
down
around
8.
A
D
A
D
A
D
So
we're
seeing
an
increase
in
the
q
length
that
happens
just
trying
to
get
this
clear
during
the
startup
of
the
bmis.
While
this
pod
is
just
issuing
list
requests,
and
then
we
see
it,
what
appears
like
the
everything
kind
of
settles
down?
Are
we
thinking
the
sales
down
because
the
apis
or
our
keeper
control
plane
has
settled
down
and
then
all
the
the
pods
list
requests
can
just
take
more
higher
priority
at
that
point,
or
what's
your
theory
here.
A
So
the
so
the
I'm
not
sure
if
it's
on,
if
it's
us,
that's
doing
this
so
the
when
when
so
at
first
we
we
get,
we
get
a
ton
of
requests,
we
start
taking
a
little
bit
of
time
to
to
fulfill
them.
It
eventually
gets
a
lot
faster,
but
I
mean
the
time
increase
that
I
saw
like
was
from
from
ncb,
like
the
response
from
ncd
wasn't
necessarily
from
from
our
control
plane
at
all,
but
this
is
one.
A
A
A
Yeah,
that's
that's
what
yeah
that's
exactly
the
that
I
was
thinking
is
that,
like
eventually,
is
that
etsy
he
gets
so
overwhelmed
with
like
okay,
you
just
keep
asking
me
for
the
same
things
like
I'm
just
gonna.
Have
it
ready
for
you
and
it's
and
it's
coming
back
really
quick
and
that's
that's
what
I
was
showing
up
here.
Like
I
mean
you
can
see
it's
the
start,
we're
as
high
as
2000
milliseconds
from
storage
and
then
we
get
as
low
as
299
milliseconds
and
the
total
time
improves
significantly.
A
A
I
can't
tell
maybe
there's
longer
times
just
look
off,
but
I
remember
it
was
about
an
hour.
I
have
here
I'll
show
you
the
next
one,
because
I
think
I
do
I
do.
I
wait
a
little
longer
in
each
of
these
now,
because
I
realized
that
that's
what
what
happened.
So
I
show
it
a
little
bit
more
and
test
you,
but
you
can
see
kind
of
the
here's,
the
api
server.
You
can
see
how
it's
processing
all
these
requests,
but
it's
not
overwhelmed.
A
A
A
slightly
different
results.
I
received
a
little
bit
higher
dispatch
requests,
same
amount
of
rejected
requests,
rate,
limited
queue,
time
went
up
and
q
requests
went
up,
so
that
makes
sense
and
with
longer
queues
list,
latency
eventually
settled
down
much
lower.
So
you
can
see
this.
This
is
just
over
one
dashboard
now,
instead
of
two,
so
you
can
see
kind
of
over
time.
This
looks
like
it's
about
25
minutes
or
so
you
can
see
how
okay
we
initially
start.
I
I'd
already
created
the
vmi's.
A
So
what
I'm
doing
is
I'm
just
showing,
like
the
extreme
case
or
a
few
different
extreme
cases,
just
to
make
sure
that
hard
to
show
how
this
can
things
can
be
affected,
and
let
me
go
down
to
test
for
where
I
do
or
do
I
not
have
to.
I
only
have
three:
I
do
one
more
test,
maybe
I
don't
have
it
here
yeah,
it
looks
like
I
don't.
One
of
the
tests
I
did
with
was
was
with
three
different
flow
controls,
so
three
workers
same
amount
of
list
requests
same.
A
I
think
it
was
the
same
definition
as
test
two
here,
and
that
was
the
best
result
that
I
saw.
I
think
I
didn't
I
think
I
forgot
to
copy
over
to
this
document,
but
I'll
have
to
find
it.
But
anyway,
the
point
the
point
is:
is
trying
to
find
sort
of
the
right
balance
of
this,
so
that
we
don't
so
that
that
fits
cube
so
that
we
don't
get
overrun
by
somebody
else.
C
A
So
the
when
it
goes
up
here
when
it's
very
high,
this
is
the
moment
when
I
start
kicking
off
the
list
request,
and
the
study
say
which
is
sort
of.
I
was
surprised
like
this-
was
I
sort
of
expected
the
this
level
to
sort
of
continue?
I
expected
there
were
no
the
number
of
rejected
requests
to
stay
flat,
but
I
think
it's
because
of
caching
on
the
storage
side
is
why
we
see,
like
those
those
requests
return
very
quickly,
eventually
at
cd
sort
of
is
able
to
return
things
faster.
Do
you.
B
A
A
I
don't
have,
I
don't.
Have
some
agency
yeah
that'd
be
a
good
idea.
I,
like
I
pulled
this
from
the
from
the
api
server
logs,
just
to
get
a
sense
of
like
where
like
because
that's
my
like
after
I
saw
this
happening
over
and
over
again,
I
was
like
I
figured
I'd
trace
these,
and
so
that's
what
these
are.
A
But
I
mean
I
can
you
clearly
see
that
there
is
something
happening
here
that
is
causing
the
that's
the
return
significantly
faster.
I
mean
you
can
it's
littered
with
these,
these,
like
three
thousand
millisecond
requests
initially
and
then
eventually
you
see
a
ton
of
these
and
then
so
on,
and
it's
really
fast,
but
I
mean,
like
sort
of
I
mean
that's
a
cool
thing
to
see.
A
I
mean
I
think
it's
what's
beside
the
point
I
mean,
I
think
the
idea
is
that
with
600
list
requests
per
second,
like
a
very
heavy
operation,
I
mean
there,
you
can
see
how
much
the
cpu
memory
explodes.
It
doesn't
completely
overrun
the
api
server,
it's
still
able
to
serve
traffic,
and
when
I
did
the
test
with
three
different
workers,
they
were
still
getting
through.
It
actually
had
a
higher
patch
request.
A
You
know
some
queue
length,
probably
one
of
the
ones
you
know
like
that
they
had
in
the
example
for
kubernetes.
Maybe
we
can
copy
that
one
or
something
like
this
seemed
to
work,
fine
and
and
that's
kind
of
what
we
what
we
can
use
to
protect
ourselves
from
from
somebody.
That's
that's
doing
this
somewhere
else
and
just
so
make
sure
we're
getting
to
the
api
server
and
make
sure
that
none
of
our
controllers
also
are
just
are
doing
anything
that
we
don't
want
them
to
do.
D
Can
you
create
an
issue
on
kubert
kuvert
link
this
data
and
I
think
the
issue
should
be.
I
think
we
should
auto
generate
some
sort
of
flow
schema,
perhaps
and
make
that
something
that
the
or
I'm
sorry
the
operator
is
capable
of
installing
maybe
based
on
our
data,
it's
kind
of
an
investigative
issue,
but
it
would
allow
people
to
find
this
so
to
find
your
data
easily,
and
maybe
it's
something
that
we
can
automate
at
some
point
in
the
future.
If
it
makes
sense.
A
Yeah,
I
agree,
I
think
they're
still
yeah,
I
think,
they're
still
sort
of
some
investigation.
I
like
like
there's
a
lot
of
still
smoking
questions
yeah,
so
that
makes
sense
to
me
like,
for
instance,
like
another
area
we
could
do.
We
could
even
do
flow
controls
per
api
or
per
verb
and
per
api
per
user
account.
Like
there's
a
lot.
A
We
could
do
and
like
one
of
the
things
like
that
prevents
us
like
if
we
say
that
if
we
know,
for
example,
that
list
is
heavy,
we
do
know
that
we
could
isolate
lists
and
then
we
could
let
create
go
through.
You
know,
have
it
be
processed
separately
so
that
we
can
make
sure
there's
fairness
between
those
list
requests,
not
you
know
blocking
any
of
the
crates.
So
there's
there's
like
a
lot.
We
could
do
around
this,
but
yeah.
D
D
A
A
Yeah,
so
I
some
next
steps,
like
you
said,
I
think
that
makes
sense
to
me
like
create
an
issue.
We
can
get
some
attention.
This,
I
think,
there's
still,
I
need
to
do
some
more
tests
because
there's
like
a
lot
of
different
ones,
I
can
do
I
I
want
to
do
like
a
one.
That's
a
little
more
granular
like
without
a
600
list
request,
but
with
like
maybe
10
different
workers
and
see
how
it
performs
and
just
to
get
an
idea.
D
C
Yeah,
okay,
and
also,
if
you
can
include
the
you
know
the
other,
the
catch-all
you
know.
What's
the
difference
between
the
catch-all
and
with
the
example
that
you
did
to
see,
if
it's
how
much
it
can
be,
you
know
mitigate
or
improve
it,
configuring
that
it
will
be
nice
also-
and
my
last
comment:
it's
about
the
tcd,
the
tcgc.
C
C
D
C
A
It
could
be
this
request.
I
don't
know
what
it
is
on
the
on
the
like
the
normal
request,
like
it,
I
don't
know
what
the
baseline
is
normally
because,
like
so,
for
example,
like
this
case
like
this,
that
I'm
showing
here
like
these,
these
logs
only
show
up
in
the
api
server
when
they're
really
slow
like
when
they're
over
a
certain
amount
of
time,
like,
I
think
it's
500
milliseconds
is
the
the
baseline.
So
there
are
other
requests
in
here
that
are
faster.
It's
just
they're,
not
here.
Okay,.
A
D
A
A
This
latency
is
ginormous
at
this
point
I
mean
I
don't
know
of
the
total
list.
Latency
time
I've
got
10
seconds.
I
mean
we're
seeing
three
seconds.
I
don't
know
where
the
rest
of
it
is,
but
I
mean
that's
pretty
that's
a
huge
number
yeah
so,
and
this
is
one
second,
that's
four
total
right
there.
Oh
sorry,
no,
it's
the
three
total
total,
but
the
yeah.
So
it's
yeah
I
mean
that's.
That
is
slow,
but
I
mean
there's
a
lot
of
requests
that
are
going
on
at
this
time.
D
A
Yeah,
I
think
we've
covered
that
yep.
I
think
we're
good
okay,
okay,
let's
go
to
the
next
one,
be
my
specific
metrics.
Do
we
want
to?
I
have
a
million
to
start
for
this.
Do
we
want
to
talk
about
like
this,
for
maybe
two
three
minutes
here?
Is
there
anything
or
do
we
want
to
just
cover
it
in
the
thread
like
do
people
have
anything
they
want
to
add
to
this,
or
we
can
just
take
it
to
the
thread.
D
It
seems
like
we're
looking
for
some
very
specific
cases
for
stuck
bmi,
so
it's
are
we
stuck
from
the
creation
to
running
and
then
maybe
in
between
there
is
it
stuck
between
scheduling
the
scheduled
or
scheduled
to
running,
and
then
are
we
stuck
between
termination
and
finalization,
like
maybe
it's
tough
to
it's
tough
to
represent
that
just
in
phases?
Maybe
I
don't
know
I
had
trouble
just
trying
to
figure
out
what
maybe.
D
A
Yeah,
so
this
to
me,
the
step,
a
stuck
bmi
is
something
that
is
is
not
progressing
past
the
phase.
Whatever
phase
it
is
like
it's
just
not
it's
not
moving.
It's
been
there
for
and
sort
of
the
to
quantify
it
would
be
like.
Is
you
know
we
if
we
expect
you
know
vmis
to
go
through
pending
in
less
than
a
minute
and
this
one's
taking
10
minutes?
That's
how
it
quantifies
something
as
stuck.
D
Okay,
so
I
think
we
can
represent
all
of
this,
given
once
we
get
your
your
deletion
histogram
in
there.
I
think
the
collective
of
all
the
metrics
that
we
have.
We
can
represent
this,
so
we
would
want
to
be
looking
at
phases,
phase
transitions
to
take
too
long
specific
based
transitions,
so
scheduling
to
schedule
we'd
want.
If
that
takes
too
long
like
we
come
up
with
some
sort
of
threshold,
then
that's
well.
The
thing
that's
tricky
here
is:
we
won't
know
about
stuck
vmis
until
after
they're
unstuck.
A
Yeah
well,
so
that's
why
I
was
thinking
we
used.
We
could
use.
We
could
use
the
creation
time
as
like,
plus
like
the
number
of
phases
like
what
I'm
assuming
is
that
if
we
had
some,
if
we
knew
like
if
we
had
an
estimate
of
like
like
I'm
thinking,
we
use
them
10
times
sort
of
as
the
threshold
time.
It's
like.
A
Okay,
if
you
have,
if
you've
gone
through
this
many
phases,
we
just
you
know,
make
an
assumption
that
they're
whatever
amount
of
time
per
phase,
and
then
it's
been
this
long
since
creation,
then
there's
a
high
probability
that
you're
stuck
and
that's
like,
and
that's
how
we
define
unreasonable
transition
time
threshold.
It's
like
say
I
said
to
10
minutes
whatever
it
is.
A
It's
like
okay,
he's
gone
through
this
vm
has
gone
through
three
phases
and
it's
reached
its
10
minute
mark
or
whatever
you
know,
10
minutes,
plus
the
three
phases,
maybe
a
minute
per
face.
So
13
minutes
it's
it's
stuck
like
you
know.
That's
let's
report
this.
As
you
know,
as
a
as
something
that's
stuck,
I
don't.
A
A
B
D
B
So
what
I,
what
I
think,
yeah
for
example,
pods,
do
like
maybe
it's
not
directly
looking
at
if
the
vm
is
stuck,
but
we
if
we
can
come
up
with
the
reasons
why
a
vm
is
stuck
and
that
should
always
cause
an
error
or
an
event,
and
that
can
be
recorded
like
if
a
pod
can't
launch
because
of
no
resources.
You
see,
then
the
pods
events,
if
it
can't
launch
because
of
the
volume,
is
taking
forever
to
mount.
C
A
D
Problem
is
that
when
a
vmi
is
stuck,
let's
say
stuck
in
scheduling,
because
the
pod
there's
just
no
way
for
the
pod
to
be
scheduled
right
now,
either
you've
asked
for
a
resource
that
doesn't
exist
or
whatever
it's
going
to
keep,
that
scheduler
is
going
to
keep
trying
to
schedule
it.
But
if
it's
not
writing
any
sort
of
update
to
that
pod,
then
that's
what
would
cue
up
the
vmi.
So
if
something
is
writing
a
condition
to
that
pod
or
something
anything,
then
we
would
re-trigger
the
reconcile.
B
B
B
A
C
B
D
So
here's
why
I
would
recommend
as
a
path
forward
for
you,
ryan,
if
this
is
something
that
you're
going
to
research
figure
out,
how
we
can
detect
a
stacked
vmi
and
what
that
means,
and
don't
worry
about
necessarily
how
to
report
it
or
anything
yet,
just
figure
out
like
how
can
we
practically
determine
like
how
can
our
code
detect
this
thing
is
occurring?
What
would
that
involve?
A
A
A
B
A
A
A
D
A
So
the
deletion
would
be
the
time
when
so
the
pod,
when
the
poncho
is
down.
That's
when
we
pull
the
final
answer
off
yes,
so
yeah,
it
would
be
the
time
that
they
we
see
the
deletion
timestamp.
So
that's
when
we
process
the
control
plan
as
process
the
delete
request
up
until
that,
so
the
pods
removed.
D
D
B
D
B
D
A
D
A
That's
what
I'm
seeing?
Okay,
that's
that's!
What
I
was
saying
is
that
I'm
checking
I
because
once
what
kuvert
sees
that
at
the
last
moment,
I
think
it's
like
that
is
final
function.
It
checks
like
okay,
it's
this
and
then
it
removes
the
finalizer
and
I
was
hoping
I
could
catch
the
event
of
the
the
object
being
updated
without
the
finalizer,
but
I'm
not
catching
it
yeah.
That's
the
end.
D
D
B
A
Okay,
well,
what
about
so
forget
the
deleting
the
bmi
then
because
it's
because
well
so
I
could
do
what
you
suggested
kevin,
but
we
just
won't
forget
for
one
second
like
what
about
the
pod
like,
so
I
could
get
the
deleted
event
on
the
pod.
I
mean.
Is
that
even
going
to
get
me
like
or
what's
like
the?
What
would
be
my
ending
time
if
I
were
to
do
try
to
get
the
the
when
the
qmu
process
ends
like
yeah.
A
Yeah,
I
was
so
I
was
interested
mostly
in
the
vmi,
because
I
thought
that
made
the
most
sense
because
that's
like
the
object,
that's
like
her
interface
to
tracking
this,
but
maybe
it's
not
possible.
I
mean
I
I
don't
think
like
in
terms
of
the
use
case
like
I
think
I
think
both
would
be
okay
and
I
think
it
gives
us
the
I
mean
I
think,
as
long
as
we
clarify
what
it
is
that
it's
measuring,
I
think
it's
fine,
it's
just
mostly
what
I'm
after
is
like
what
what's
the
right.
D
A
D
B
A
D
A
C
A
D
C
D
C
Yeah,
it
was
like
a
roman
actually
request,
remove
the
thresholds
from
the
pr
in
the
beginning,
just
because
we
mentioned
that
we
could
first
just
check,
you
know
the
the
executions
and
then
we
we
we,
we
have
the
thresholds,
especially
because
it's
it's
actually
running
now
in
the
nested
virtualization,
this
icg
collocated
with
all
the
jobs
but
yeah
next
week.
I
I'll
try
to
prepare.
You
know
the
the
infrastructure
and
have
it
like
move
move
forward
with
that.
D
D
And
begin
using
that
to
kind
of
understand
what
we
would
want
to
actually
set
the
thresholds
at
for
our
environment,
and
you
said
marcelo
that
you
want
to
move
the
cluster
or
something.
Let
me
make
sure
I
got
that
straight,
we're
running
in
nested
mode
right
now,
but
you
had
a
dedicated
environment
or
something.
C
Yes,
exactly
so
it's
so
we're
right
now,
like
as
the
regular
functional
test
which
it's
running
the
ci
you
know,
convert
ci
and
the
convert.
Ci
creates
vm
and
sql
inside
right,
hoover
nets,
clustering
side
and
run
converts
so-
and
this
is
nested
virtualization-
that
it's
creating
and
also
it's
it's
run
the
the
the
functional
test
and
I
share
the
cluster
right,
but
I
I'm
going
to
introduce
a
new
cluster.
Actually,
we
already
have
the
machines.