►
From YouTube: SIG - Performance and scale 2022-05-05
Description
Meeting Notes:
https://docs.google.com/document/d/1d_b2o05FfBG37VwlC2Z1ZArnT9-_AEJoQTe7iKaQZ6I/edit#heading=h.tybh
A
A
We
have
this
performance
job
that
we
run
every
three
times
a
day
and
basically,
what
it
does
is
it
it
will
run
and
create
100
vms
under
vmis
and
what
it
does
is
it
measures
the
amount
of
time
it
took
to
for
each
how
long
it
took
to
go
and
to
end
from
start
to
running,
and
we
have
some
thresholds
where
we
expect,
like
we
expect
a
few
things
to
come
within
you
know.
A
certain
amount
of
time
needs
to
start
in
a
few
certain
amount
of
time.
A
We
also
have
a
bunch
of
thresholds
around
a
few
other
metrics
like
like
http
requests
like
things
like,
create
requests
like
if
we
do
like.
We
expect
a
certain
amount
of
like
crates
for
100
vmis,
and
we
expect
a
certain
amount
of
guts,
patches,
etc.
So
this
what
this
job
does,
is
it
measures
and
make
sure
that
we're
within
the
threshold?
A
So
this
is
like
an
example,
so
the
thing
I
wanted
to
talk
about
is
that
we're
actually
seeing
this
job
fail.
As
of
4
23
and
what's
interesting
is
there's,
this
has
been
debugged
and
there
we're
short
memory
on
the
we're
short
or
suddenly
short
some
memory
on
these
jobs,
and
this
is
a
bit
surprising
because
I'm
not
sure
what
happens
something
changed
on
this
date,
where
all
sudden
now
are.
A
We
need
a
lot
more
memory
in
order
to
to
launch
these
hundreds
of
pmis
and
actually
measure,
which
is
a
little
strange,
and
I
did
some
investigation
into
cuberd
and
see
what
was
wrong
and
from
what
I
found,
I
mean
on
on
the
dates
that
this
occurred
around
the
4
22
423
date.
Time
frame,
I
didn't
see
anything
that
looks
particularly
suspicious
so
roughly
12
days
ago,
this
right
around
the
date.
A
A
11
12
days
ago,
or
so
the
23rd
so
around
this
time
frame,
something
happened
here
either
something
I
think
one
of
two
things
could
happen.
If
there's
something
changed
in
the
in
the
ci,
which
certainly
like,
is
something
that's
hogging
more
memory
or
we
merge
some
code
that
is
suddenly
not
as
our
stake
is
simply
taking
up
more
memory,
I'm
not
quite
sure
what
it
is.
It
could
be
one
of
these
here,
but
I'm
not
sure
so.
A
April
22nd,
okay,
yeah
something
happened,
I'm
not
sure.
So
what
I
think,
what
what
we'll
have
to
do
at
some
point
is
we're.
Gonna
have
to
go
through
these
pr's
and
and
audit
them
just
to
see
because
we
actually
have
so
we
have
two
jobs.
We
have.
We
have
this
one,
this
periodic
job.
We
also
have
a
pre-submit
job,
but
the
pre-submit
job
is
optional,
and-
and
so
we
have
no
way
of
actually
knowing
since
people
since
someone
may
not
have
ran
it
when
they
did
their
when
they
did
their
pr.
A
So
I
don't
know
we
don't
have
to
do
that
now,
but
like
something,
I
think
what
I'm
going
to
do
is
as
a
follow-up,
I'll,
create
an
issue
and
tag
a
bunch
of
these
pr's
and
something
for
tracking
to
try
and
figure
out
which
one
of
these
yeah
try
to
get
an
idea
of
which
one
of
these
actually
caused.
This.
A
A
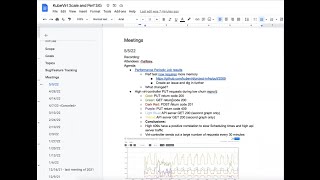
I've
got
three
graphs
here
we
go
through
periods
of
of
churn
when
and
in
some
of
our
data
centers,
where
we'll
basically
have
a
high
virtual
machine
instance
count
and
also
then
we
we
delete
a
few
of
them
and
you
know
we
recreate
them,
so
that
would
be
turned
like
we're,
replacing
replacing
running
virtual
machine
instances
and
during
this
period
of
time
you
know,
there's
more
pressure
on
the
control
plane.
So
things
happen
things
just
kind
of.
I
don't
know
things
just
kind
of
take
a
little
bit
longer.
A
Naturally,
because
you
obviously
more
things
are
happening,
and
so
that's
what
this
investigation
was
is
there's
there's
we
have
a
bunch
of
metrics
and
we
have
this
period
where
we
have
a
little
bit
of
turn
and
we
see
a
few
interesting
things
from
the
components,
and
so
the
original
observation
was
that
we,
I
saw
a
high
virtual
machine,
put
requests
during
a
low
low
churn,
and
so
you
can
kind
of
see
here
this.
I
have
this
this
goals
I
mark
on
my
golds
and
you
can
see
them.
A
This
is
from
from
prometheus,
like
this
gold
line,
you
can
see
that
there's
a
regular
cadence
and
you
have
this
very
high
amount
of
put
requests
that
are
returning
200
from
the
controller
and
during
this
time,
there's
there's
very
few
create
requests,
and
you
can
actually
see
that
this
is
the
corresponding
graph
in
in
grafana
and
there's
not
that
many
vms
that
are
actually
being
created
during
this
time.
There
are
some,
but
not
many,
and
it's
a
little
strange
that
we
have
this.
A
A
A
So
it's
kind
of
it's
kind
of
interesting,
but
it's
contributing
to
things
being
a
little
bit
slower
like
we're
we're
doing
a
lot
more
things,
so
our
like
this
is
time
on
the
on
the
y-axis
here,
it's
taking
longer
for
these
for
these
vms
to
actually
get
get
processed.
So
it's
that's
interesting.
So
there's
there's
two
observations.
Just
to
kind
of
summarize,
lots
of
foreign
lines
seem
to
have
a
positive
correlation
to
so
scheduling
times,
which
is
interesting
and
that
the
divert
controller
has
these.
A
Has
this
regular
cadence,
where
it
has
high
amounts
of
put
requests?
And
I
don't
know
what
it's
doing,
but
it's
it's
doing
something
it's
doing
it
at
a
regular
cadence
when
there's
not
many
vmis
being
created,
which
is
a
little
bizarre,
I
would
expect.
I
guess
the
way
I
would
say
this
is.
I
expect
this
gold
line
to
be
to
be
low.
I
expect
it
to
be
low
and
then
kind
of
increase
it
like
with
the
screen.
With
kind
of
with
this.
A
A
Yeah
yeah
right
because
this,
what
this
tells
me
is
like:
okay,
we
have
some
activity,
that's
going
on
and
and
it
could
be
that
you
know
maybe
that
this,
like
there
yeah
we
have
like
this,
would
be
a
lot
of
activity,
and
here
we
see
a
lot
of
activity
and
not
we
see
a
little
bit
less
activity
now
that
could
be.
You
can
buy
the
because
of
the
four
or
nines.
A
A
I
don't
know
so
I'm
something
I'm
still
going
to
look
into
this
one.
I
I'm
still
digging
it
to
find.
I
think
so,
my
next
step
for
this
one
is
I'm
going
to
try
and
find
what
what
could
possibly
be
causing
this
to
occur
at
a
regular
cadence,
and
it's
not
just
the
the
put
requests
that
I
returned
202.
It's
all
these
lines.
A
A
Okay,
so
that's
all
I
had
for
today.
I
I
don't
know:
do
you
guys
have
anything
else?
I
could
also
talk
about
tracing.
I
think
that
was
a
thing
I
had
last
time.
I
don't
know
if
anyone's
interested
in
tracing,
but
if
you
want,
I
can
talk
about
that.
There's
some
there's
some
folks
in
the
community
who
are
interested
in
working
on
tracing.
A
A
You
know
when
things
are,
you
know
when
certain
things
should
be
or
misbehaving
at
a
very
small
level,
and
so
we
can-
and
we
can
also-
and
the
other
part
is.
We
can
also
visualize
that,
like
there's
a
lot
of
good
ui
tools
so
right
now
the
kubert's
support
for
tracing
is
it's
very
limited.
It's
actually
they're
supporting
the
vert
controller
for
doing
tracing
out
to
standard
to
standard
out,
and
it's
very
simply
just
not
a
few.
It's
it's
very
simple
library,
and
it's
just
around
a
few
hot
code
paths
right
now.
A
A
lot
of
work
around
and
a
lot
of
work
on
integrating
some
of
those
solutions
and
there's
sort
of
a
few
use
cases
for
it,
and
so
one
of
them
is
that
being
able
to
trace
in
inside
of
into
individual
components,
and
so,
like
I
said
before,
like
it's
important,
we
can
see
hot
code
paths
within
like
the
rear
controller
things
that
are
taking
a
long
time
to
be
able
to
visualize
those
and
there's
the
second.
A
second
use
case,
which
is,
I
think,
a
lot
more
challenging-
would
just
be
tracing
across
components.
A
That
would
be
like
if
we
sent
a
request
to
the
very
api
tracing
it
from
the
vert
api
to
the
controller
down
to
the
word
handler
down
to
the
launcher
and
seeing
you
know
all
the
paths
it
takes
and
how
long
it
took
in
each
of
them.
It's
it's
difficult,
because
these
are
separate
components,
they're
different
pods.
A
It
would.
We
would
basically
have
to
find
a
way
to
to
pass
the
trace
all
the
way
through.
But
I
mean
it's
not
impossible.
I
think
would
just
require
a
lot
of
a
lot
of
work
to
get
that
to
go
to
work,
but
that
would
be
very
cool
to
see
and
then
the
the
third
use
case
is
really
like.
I
said
it's
in
greeting
with
in
the
ui,
and
the
anger
has
been
one
of
them.
A
A
B
B
So
I
also
noticed
there
are
a
lot
of
enqueues
happens
in
the
controller
and
the
handlers,
but
in
in
our
case
it
is
because
the
secret
is
deleted
after
the
vm
is
a
bootstrap,
so
the
secret
controller
always
monitor
and
watch
the
secrets.
If
that
way
is
ready.
So
if
the
secrets
controller
failed
to
the
check,
it
will
be
enqueued,
so
there
are
always
tons
of
secrets,
controller
errors
in
the
log.
So
I'm
wondering
if
that
is
relating
to
the
a
lot
of
put
and
api
calls.
A
A
B
A
A
A
B
A
Okay,
make
sense,
cool,
okay,
all
right.
Well,
I
don't
have
any
more
topics,
guys
I
you
know
thanks
very
much
for
joining
and
and
so
we
meet.
I
don't
know
if
let
me
know
so.
We
meet
weekly
at
this
time.
So
we'll
we'll
continue.
I
think
we'll
see
if
we
can
find
out
what
this
is
and
then,
hopefully,
by
next
meeting,
get
a
little
bit
more
information
about
this
performance
test
to
get
a
sense
of
you
know.
What's
going
on?