►
From YouTube: SIG - Performance and scale 2022-07-07
Description
Meeting Notes:
https://docs.google.com/document/d/1d_b2o05FfBG37VwlC2Z1ZArnT9-_AEJoQTe7iKaQZ6I/edit#heading=h.tybh
A
A
I
took
a
quick
look
at
this
earlier.
This
is
all
really
good
to
see
we're
starting
to
get
back
to
consistently
green,
which
is
really
good.
So
I
guess
that
we've
got
over
those
memory
issues
and
we're
starting
to
get
to
getting
back
to
what
we'd
like
to
see
and
we're
not
going
over
any
of
the
thresholds,
which
is
good.
A
Yeah,
this
is
all
really
good.
It
looks
good,
so
our
thresholds
45
for
our
p50
we're
at
20..
It's
been
about
the
same
now
p95
29.
This
is
also
looking
really
good
on
the
p90
yeah.
This
is
a
really
good
test.
29
was
the
the
slowest
worst
case.
It's
really
good,
usually
it's
about
in
the
30s
and
the
40s
high
30s
low
40s,
our
patch
counts,
also
well,
within
our
thresholds
and
update
accounts
all
worthwhile
folks.
So
it
looks
all
looks
really
good.
A
A
A
We
don't
have
thresholds
to
use,
but
I'll
have
to
add
that
at
some
point
and
then
okay
here
we
go
yeah,
okay,
so
there's
a
so
there's
still
yeah
it's
just
to
make
the
make
clean
function
is
just
what's
airing
this
out,
so
we
just
need
once
I
think,
lay
you
have
that
would
that
work.
So
what
once
I
think
once
we
have
that
and
we
should
that'll
it
should
go
away.
A
A
A
This
is
something
I
I
need
to
investigate
and
create
an
issue
around
this
and
and
look
to
fix.
So
the
this
issue
we've
seen
previously
we're
not
the
issue.
The
memory
increase
is
something
that
has
been
done
previously.
It
was,
I
don't
know
exactly
how
much
it
was
increased,
but
whatever
it
was,
it
affected
our
jobs
and
we
had
to
increase
the
memory
in
all
our
jobs.
A
What
this
pr
is
saying
is
that
the
that
that
increased
previously
was
based
on
some
tests
and
some
estimates
and
after
some
more
testing
over
time,
that
the
author
noticed
that
the
amount
of
memory
that
they
originally
had
allocated
was
not
enough
and
that,
over
time
the
actual
launcher
takes.
Oh
a
variable
amount
of
memory,
sometimes
more,
it
looks
like
even
sometimes
less,
but
the
key
thing
is
that
we
have
to
account
for
more,
because
we
don't
want
for
launcher
to
get
killed
because
it's
you
know
it's
over.
A
The
amount
of
allocated
memory-
it's
gone,
we
don't
want
to
kill
the
vm
and
so
the
we
need
to
increase
the
amount
of
memory
for
the
launcher
just
to
make
sure
we
don't
run
into
this
problem.
But
it's
this
is
an
interesting
experiment.
It's
because
you
know
we
don't
know
why
this
is
the
case
and
yeah.
A
This
is
going
to
take
some
digging,
so
I
I'm
not
really
sure,
but
this
is
just
something
that
I
want
to
bring
up
for
everyone
to
be
aware
of
that,
going
into
master
there's
there's
this
change
that
increases
memory.
I
think
it's.
Let
me
see
if
he's
got
it
in
here,
for
how
much
it
increases
to
buy
okay,
so
we're
going
from
another
25
megs
we're
increasing.
B
This
pr
was
born
because
we
see
that
the
rss
that
with
launcher
their
the
rss
increase
initially
it
seems
to
increases
constantly,
but
and
we
think
that
we
have
a
memory
leak,
but
after
a
deeper
test
and
a
long
long
time
test,
we
saw
that
there
are.
There
is
no
memory
also
because
we
all
we
have
tried
with
the
people
off
to
see
if
we
have
a
memory
leak
and
it
seems
that
there
is
no
memory.
Okay
and
yeah.
We
are
running
this.
We
are
still
running
this
test.
B
In
the
yeah
there
are
at
the
bottom,
there
are
the
the
graph
about
the
rss
file,
rss
unknown
and
the
rss
entire
and
yeah.
This
is
this
file
is
not
automatically
updated,
but
it
will
be
updated
by
me
kinda
every
every
morning,
so
this
data
are
updated
to
six
hours
ago
and
what's
interesting,
is
that
the
rss
file,
which
is
the
part
of
the
shard
shard
memory?
B
B
C
A
B
B
B
A
Well,
I
wouldn't
I
mean
like
where
I'm
going
with.
The
question
is
like
I'm
just
trying
to
understand
like
this
issue
a
little
bit
more
so
like
is
it
is
it?
What
you're
saying
is
that,
like
we
are
you're
running
over
launcher
right
now
and
part
of
your
pr,
is
that
we
need
to
increase
200
megabytes
and
is
it's
and
like
I'm
trying
to
just
narrow
a
little
bit
narrow
this
down
kind
of
where
our
search
is
going
to
be
like,
like
what
I
mean,
I
I
don't.
A
B
7500
I,
in
my
opinion,
I
think
that
it
is
it
could
be
because
I'm
I'm
not
sure
it
could
be
the
the
garbage
collector,
because
for
us
the
garbage
collector
is
a
black
box.
Okay,
we
it
can
run
every
five
minutes
or
when,
when
he
wants,
probably
if
the
the
node
is
not
overloaded,
the
garbage
collector
will
run
not
so
often
has
when
the
the
node
is
under
pressure.
B
A
A
B
B
A
A
Yeah,
I
don't
know
I
mean
yeah.
I
think
I
think
we'll
need
to
do
some
analysis.
I
think
we
should
yeah.
I
mean
if
people
don't
have
any
ideas,
then
I
think
like
we
should
do
like.
Let's
we'll
keep
this
topic
around,
like
you
know
federico,
hopefully
you
can
join
us
for
a
few
views
every
week,
let's
take
like
let's
write
up
an
issue
in
q
vert.
A
Let's
get
all
our
information
out
and
let's,
let's
just
start
doing
some
research
and
you
know
getting
some
ideas-
how
we
can
how
we
can
try
and
tackle
this,
because
I
mean
I
think,
right
now,
it's
just
a
little
too
broad
and
we
don't
have
like
we
just
need
to
get
some.
We
need
to
get
some
more
ideas
on
the
table
before
we
can
say
like
we
need
to
look
at
absolutely.
B
B
B
B
B
A
So,
let's
it's
really
yeah,
it's
really
interesting.
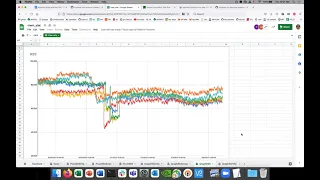
The
other
thing
that
I
just
I
still
find
curious
about.
This
is
like
I
kind
of
separate
this
graph.
Like
you
said,
there's
live
migration
in
here
like
before
seven
one.
It's
like
here's
node
one
and
here's
node,
two
and
node
do
performs
fairly
well,
like
the
launcher
does
pretty
well
here.
A
It
really
does
not
do
well
over
here,
except
for,
like
you
know
this
one
area
where
the
red
and
the
yellow,
like
you're,
saying
where
it's
pretty
much
in
line
with
what
node
two
has
so
it's
it's
kind
of
was
this.
It's
also
kind
of
interesting
to
this
I
think
like.
So
what
would
be,
I
think,
would
be
valuable.
Like
I
was
saying
with
the
issue.
I
think
I
think,
let's
take
take
your
grass,
let's
create
an
issue.
You
know
we
could
totally
like
you
know
investigate.
A
You
know
why
vert
launcher
is
taking.
You
know
more
than
more
an
unusual
amount
of
memory
or
an
unexpected
amount
of
memory.
Whatever,
like
you
know,
then
you
know-
and
we
can
explain
why-
and
I
think
like
having
some
having
this
graph
here
and
explaining
what's
like
this
is
unusual
up
here,
and
this
is
unusual
on
this
drop,
and
this
is
probably
what
we
want
to
see.
A
You
know
on
the
other
side,
and
I
think
that
that
could
be
our
starting
point
and
let's
we
need
to
do
some
investigation
as
to
like,
okay,
let's
you
know,
start
narrowing
some
things
down
and
we
can
start
doing
some
and
do
some
different
tests
and
let's
just
use
the
issue
as
our
like.
You
know
the
way
we
can
the
area
we
can
track.
How
we're
gonna
investigate
this,
then
we'll
we'll
bring
it
up
in
this
call
and
we'll
see
how
we
progress.
A
A
C
A
A
I
think
we
went
to
this
third
line.
I
think
so
200
and
now
he's.
I
think
a
third
graph,
I'm
not
sure
what
it
is,
but
it's
like
in
maybe
it's
in
seconds
or
milliseconds.
So
it's
pretty
significant
the
improvement
that
he
was
able
to
see.
By
doing
this,
so
I
mean,
but
again
like
this
is
maybe
different
for
your
use
case.
Like
I
don't
know
how
fast
you
create
vms-
and
you
know
they're
very.
A
Yeah,
but
it's
like
you
might
not
you're
the
right.
Your
rate
might
be
different,
your
density
might
be
different.
Your
kubernetes
cluster
might
be
different,
and
so
you
may
not
have
hit
this
level
of
pressure
that
he
was
able
to
hit
here.
But
the
point
is
that,
if
you
are,
if
you
are
able
to
generate
as
much
pressure
as
he
was,
then
you
will
still
be
able
to
achieve
the
same
level
of
performance
now
with
this
change.
A
Right
and
are
you
like
so
in
his
case
like
he
was
seeing
that
you
know
like
we'll
just
go
to
your
example:
you're
printing
100
000
vms
he's
creating
a
thousand.
He
was
seeing
that
it
was
taking
22
minutes
and
for
in
some
cases
for
the
vmis
to
come
up.
Now
I
I
mean:
are
you
seeing
up?
Do
you
seeing
that
level
that
is
it
taking
you
that
long
for
your
a
hundred
thousand
vm
to
know.
A
B
C
A
C
A
I
don't
think
he
I
don't
I
don't
he
may
not
even
be
using.
Pvcs,
like,
I
would
have
said,
is
that
sort
of
apples
to
oranges.
It's
not
his
your
case
and
his
case
is
different
and
and
like
you're
talking
about
like
pvcs
like
I,
I
don't
think
that's
what's
limiting
him,
because
if
you
see
this
qps
and
burst,
this
is
on
the
cuvette
side.
This
is
nothing
to
do
with
like
pvcs
is
all
kubernetes
like
this
is.
A
This
is
all
kubert's
pod
creation,
latency
and
vm
vm
ready
latency
like
this
is
all
all
cuber
code
here
that
it's
nothing
to
do
with
the
pvcs
and
he's
and
he's
running
into
problems,
and
so
I
what
basically,
what
I'm
saying
is
like
it's?
It's
it
does
it's
not
as
it's.
It's
totally
orthogonal
like
the
the
pvcs
it
he's
seeing
he
with
his
in
his
experiment,
he's
just
what
he's
seeing
with
just
the
ends.
A
Yeah,
well
I
mean
all
I
wanted
was
so
this
one.
All
I
wanted
to
just
mention
is
like
with
this
experiment
like
you,
you
to
run
into
this
problem.
You'd
have
to
get
to
equal
to
the
amount
of
pressure
that
he
generated,
but
again
like
it's,
it's
the
pressure
that
he
generated
has
to
do
with
the
type
of
cluster
he's
running
the
type
of
hardware.
A
A
Yeah
yeah,
so
I
mean
you're,
it's
it's
different.
You
have
a
you,
have
a
different
kubernetes
cluster,
a
different
hardware.
You've
got
a
whole
different
setup,
so
the
amount
of
pressure
you're
generating,
isn't
quite
equal
to
his.
But
if
you
do
get
there,
your
qps
and
bursts
will
need
to
be
improved.
So
I
mean,
when
you
take
a
new
kubernetes
you'll,
be
you'll,
be
fine,
he's
already
taking
care
of
it.
So
our
new
new
cuber
version
he's
got
it
increased,
so
he'll
take
care
of
it.
So
you
so
you
won't
hit
this
particular
bottleneck.
A
A
And
then
yeah
this
was
this
one's
cool
like.
I
think
this
is
a
really
good
we've
talked
about
this
previously.
This
is
a
really
good
area
that
we
could
use
that
we
can
improve
on
like
fewer
update
patch
calls,
just
because
of
like
it
is
experiments
I
think
per
vm.
It's
like
I
don't
know
if
it
was
50
or
something
patch
calls
here.
A
And
so
that,
in
that
regard,
we
would
just
be
we'd,
be
able
to
produce
our
qps
and
burst
so
that
we
wouldn't
need
to
leave
it
at
the
level
it's
coming
out
and
there's
also
that
there's
a
third
issue
which
is
the
what
was
the
third
issue
was
the
one
of
the
one
of
the
graphs
shows
like
one
of
the
controllers
I
think
was,
was
slow.
I
don't
I
don't
remember
what
it
was.
A
Maybe
he's
going
to
link
to
it
at
the
bottom
or
something
I
don't
see
it,
but
there's
a
third
issue:
oh
here
is
the
vert
controller
node
working
this
one
that
we
need
to
investigate.
This
is
one
that
we
need
to
do
a
really.
We
need
to
do
some
profiling,
probably
and
do
a
deep
dive
into
figuring
out
exactly
why
this
is
marcel
did
some
tracing,
but
it
wasn't
really
conclusive
as
to
what
the
problem
was
so
yeah.
This
is
another
one.