►
From YouTube: SIG - Performance and scale 2023-08-17
Description
Meeting Notes:
https://docs.google.com/document/d/1d_b2o05FfBG37VwlC2Z1ZArnT9-_AEJoQTe7iKaQZ6I/edit#heading=h.tybh
A
B
Yeah
sure
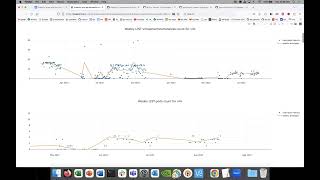
so
this
is
the
post
submit
job
that
we
have
been
talking
about
in
last.
Couple
of
meetings,
this
post
submit
job
basically
takes
the
data
we
have
in
the
CI
performance,
Benchmark
repository
and
plots
the
graph
for
it.
The
reason
why
it
has
to
be
a
separate
job
is
because
the
other
periodic
job
only
has
like
a
week
so
week
of
data.
So
after
it
publishes
that
week's
data,
the
every
week's
data
is
present
in
DCI
performance
repository
and
that's
where
we
need
this
a
post
of
my
job.
B
A
B
A
B
A
A
A
A
A
Yeah
that
one
okay,
cool,
pretty
steady,
looks
like
all
right.
This
is
awesome.
It's
gonna
set
us
up
a
lot,
because
now,
when
we
get
to
once
we
get
this
stuff
automated,
we
can
start
building
some
more
of
those
tests
and
a
few
of
these
places
like
the
density
cluster
and
see
how
we
can
list
the
results.
A
little
bit.
B
A
Yeah
I
know
I
think
like
we
need
yes,
yeah
yeah
I.
This
stated
like
for
yeah
I
mean.
Let's
say
this
is
kind
of
one
of
the
ones
where,
like
after
the
new
year,
I
wanted
to
see
where
it
goes,
because
we
just
we,
we
basically
I
think
this
was
the
rebuild
like
somewhere
in
here.
Brian
did
the
rebuild
to
upgrade
kubernetes
to
a
new
version,
and
it
was
completely
offline
during
this
time.
B
A
A
A
Yeah
I
think
I,
okay,
I
mean
we
need
to
I
mean
the
density.
Cluster
needs
some
more
love
like
it.
Just
we
haven't,
we've
been
focused
on
things,
so
I
mean
as
far
as
like
I'm
concerned,
like
what
I
was
saying
with
this
data
like
these
holes
here
like
this
holes,
hole
here,
and
you
know
the
one
back
in
July
like
we,
we
it's
totally
different
than
what
we
have
for
the
periodic
where
you
can
clearly
see
Trends
this
one.
It's
okay,
we're
not
getting
a
good
trend
line
here.
This
is
so
I.
A
That's
where
that's
what
I
mean
it's
like
I'm
kind
of
thinking
about
it's
like
we
at
some
point.
We
need
to
look
at
this
as
like
from
January
forward
or
whatever,
because
I
I
don't
know
how
to
read
this
data.
This
is
too
random
makes
sense,
so
I
we
probably
need
to
spend
some
time
in
a
in
the
future
when
we
have
all
the
stuff
how
to
make
it
to
do
some
work
on
the
dedicated
job
see.
A
If
we
can
get
some
more,
we
get
some
get
a
trend
line
out
of
this
okay
cool
all
right.
That's
awesome
like
so
script
is
looking
good,
it's
working
and
okay,
so
you
just
seen
some
reviews
on
this
one
and
then
and
then
we
should
get
that
in
and
then
looks
like.
We
can
then
just
wire
it
up
to
this
and
okay,
so
that
covers
those.
It's
just.
Those
two
PRS
right,
I
think
two,
nine
three
two
and
everyone
yeah
okay
and
then
that
gives
us
what
we
need
for
for
the
job.
B
So
this
is
a
PR
that
that
came
to
my
attention,
while
the
API
review
work,
and
so
basically,
this
PR
proposes
that
we
introduce
a
shadow
node,
a
new
crd,
where
we
will
basically
write
everything
to
that
shadow
node
and
the
actual
node
will
only
have
read-only
access
so
that
prevents
security
that
addresses
some
security
concerns
by
introducing
a
new
crd.
The
reason
why
I
have
it
in
this
call
is
because
I
feel
like
this
will
introduce
a
lot
of
new
performance
related.
B
A
Yeah
I
think
so
I
mean
really
they
could
have
liberal,
can
put
together
something
in
the
community.
First,
one
I
I
read
this
one
too
and
I
mean
I
was
not
thinking
about
it
in
terms
of
scale,
but
I
mean
I.
Just
don't
understand
the
like
I.
It
just
made
me
think
of
like
we're
regretting
the
VR
back
Paul.
They
are
back
AP
guy,
but
we're
just
like
working
around
it
and
I.
B
So
for
scale,
here's
what
I'm
thinking
right
are
list
calls
will
be
doubled
because
we
have
to
watch
well.
We
have
to
watch
the
the
node
objects
because
they
are
read
only
and
you
know,
in
order
to
Shadow
it,
we
will
also
have
to
watch
the
Shadow
node
right,
so
our
list
calls
will
be
sorry
list.
Watch,
I
call
them
together.
They'll
be
doubled,
the
rights
that
the
system
makes
so
any
write
that
is
made
to
the
node
API.
A
A
Well,
okay,
yeah
I
mean
I
I
would
I
think
the
yeah
sure
I
I
think
we
I
think
really
I,
don't
know
what
Romano
said,
but
I
I
think
this
would
be
I.
Think
Louisville
needs
to
take
some
time
to
do
some
design
on
this
I
mean
this
has
been
a
few
weeks.
He
hasn't
respond
with
anything,
it's
quite
busy.
It's
about
some
other
things
but
yeah,
let's,
let's
try
and
push
them
in
that
direction,
because
I
I
don't
know
I
think
it's
been
a
little
bit
more
thought.
A
A
A
B
A
B
So
last
time
I
demoed.
Well
last
time,
I
talked
about
a
controller
to
add
watch
requests
that
work
is
going
on
and
right
now,
with
that
POC
we
can
see
that,
let's
say,
if
you
add
400
nodes,
it
will
create
400
into
20,
which
is
around
800,
well,
more
8,
000,
watch
requests
and
with
that
the
API
server
memory
increases
around
1,
1.5
gigabytes.
A
B
Our
Downstream
data
center
CS,
so
not
only
does
not
only
is
the
cubelet
load
included
on
that,
but
all
the
other
demon
set
controllers
that
run
on
the
on
the
cubelet.
They
also
cause
watch
loads.
This
is
creating
a
node,
you
said,
creating
a
node.
So,
for
example,
when
you
start
a
cubelet
yeah,
creating
a
fake
node.
A
B
A
B
A
B
A
It
sounds
like
you've
got
pretty
close
to
both
for
just
like
create
node,
which
is
really
interesting,
because
that
would
be
so.
That
would
be
really
interesting
topic
to
talk
about,
especially
in
the
kubernetes
six
scale,
because
I
wonder
if
they
have
this
level
of
granularity
or
visibility
in
some
of
their
on
some
of
their
metrics
yeah,
because
I'm,
the
one
I
talked
to
worship
previously,
was
that
there
were
some
estimates
about
this
stuff
and
I.
A
B
A
B
So
so
then
I
have
all
the
API
resources
and
I
have
all
the
watch
calls
made
by
different
components
aggregated
into
that
table
and
then
I
am
simplifying
it
to
just
one
call
so
I
assume
that
multi.
So
this
is
filtered
by
again
one
node
and
one
node
is
making
multiple
calls,
but
in
our
simulation,
I
will
just
use
one
instead
of
many
right
when
when
creating,
because
those
watches
can
terminate
and
they
can
be
restarted
and
then
something
and
I
I
don't
want
to
account
for
that.
B
B
A
B
A
No,
we
wouldn't
well
I
I,
don't
think
so,
but
the
the
point
is
so
it's
two
things
is
that
which
of
them
aren't
so
maybe
we
can
produce
those
and
which
one
aren't
Upstream
part
of
Upstream
components
and,
and
those
have
you
left
them
to
remove
those
or
whatever
we
want
to
do
with
them,
and
then
the
ones
that
are
then
the
value
is,
is
that
we
know
they
need
them
right,
so
that
this
is
this
is
what's
going
to.
This
is
what's
going
to
add
to
our.
A
This
is,
what's
going
to
add
up
to
our
number
right
like
where,
whenever
we
do
something
with
a
node,
this
is
the
cost
of
it,
and
so
the
idea
was
that,
okay,
if,
if
creating
a
node
costs,
something
pass,
I,
don't
know
we'll
do
a
numerical
value,
it
won't
even
do
like
a
CPU
value
or
anything
costs.
Five
list
watches,
maybe
that's
the
metric.
How
much
does
updating
a
node
cost
would
be
cost
10
list
watches
maybe
cost
none
whatever
it
is
like
what
is
the?
How
do
these
things?
A
What's
the
cost
of
some
of
these
things?
That's
what
I'm
wondering,
because
when
you
start
to
look
at
the
what
comes
out
of
the
box,
let
me
separate
the
two
now
we
can
see.
We
can
make
assumptions
about
what
the
Upstream
infra
is
doing
and
and
then
we
can
start
to
extrapolate.
What
are
the
really
costly
operations
which
we
kind
of
already
know,
but
it's
now
we
can
put
a
number
to
it.
It's
not
just
like.
Oh,
we
know
list
watch
is
costly
and
we
know
created
notice,
costly.
We
know
exactly
how
much
it
costs.
B
Well,
that
makes
sense
yeah,
so
I
I
think
we
are
on
track
for
doing
that,
not
Upstream
versus
Downstream.
That's
a
good
data
point
I'll,
add
that,
but
in
terms
of
costs
right,
so
what
I
did
was
because
we
have
these
numbers.
20
is
to
1
multiplier.
I
implemented
that
number
in
the
watch
thread.
So
anytime,
node
is
created.
B
That
watch
controller
will
create
like
20
watch
calls,
and
with
that
implementation
we
created
400
nodes
and
the
cost
result
of
that
is
the
memory
of
control
plane,
which
was
averaging
around
4
gigabytes,
jumped
to
5.1,
5.2
gigabytes.
Okay,
so
immediately
we
saw
the
API
server
memory,
control,
plane,
memory
increase
and
that's
the
actual
gain
we
saw
from
the
simulation.
So
the
the
point
is
that,
even
though
this
is
the
means,
the
end
goal
is
that
adding
a
node
actually
increases
the
control
plane,
resource
utilization,
and
we
saw
that
in
the
simulation.
B
A
A
A
B
Actually,
you
know
I
think
even
the
list
watch
will
be
varying
per
data
center
right
because
so
right
now
so
let's
say
we
have
two
keyword
clusters,
the
density,
one
and
the
performance
one
and
the
density
one
uses
a
certain
demon
said
of
no
PVC
provisioner
CSI
provisioner.
That
is
not
used
by
the
performance
cluster,
then
because
of
that
little
change,
even
though
everything
is
upstream
and
and
open
source
that
little
change
will
produce
a
difference
in
this
list.
What
cost.
A
B
It
so
you're
saying
that
if
we
can
have
a
consistent
way
of
measuring
wrist
watch,
no
matter
how
many
deploy,
how
many
components
are
deployed
in
in
the
cluster,
if
we
have
a
standardized
mechanism
to
measure
the
list
watch
coming
per
node,
then
we
can
say
that.
Okay,
if
you
are
a
user
and
if
you
want
to
estimate,
cost
here's
the
tool
to
measure
the
list
watch
per
node
and
then
here's
the
tool
where
you
plug
in
the
result
and
simulate
that
yeah.
A
Exactly
like
we
could
I,
you
could
have
your
cluster
like
I
could
have
mine.
I
might
get
I'm
18
to
1
unless
watches
you're
20
to
1..
This
tells
me
something
it's
like
okay,
so
something
so
I.
It
tells
me
that
I
have
I'm
creating
less
events
when
I
am
doing
things
with
notes,
you're
creating
more
that
can
it's
totally.
There
could
be
so
now
it
takes
out
topology,
because
now
it's
like
oh
wait.
A
B
B
Yeah
that
makes
sense
so
I
think
there
are
two
things
right.
So
if
we
want
to
do
it
with
Prometheus,
we
will
need
to
look
at
the
Matrix
exported
by
client
go
and
if
we
are
lucky
there
will
be
a
matrix
that
can
help
us
well.
Actually
that
was
my
problem.
The
reason
why
I
had
to
go
to
the
audit
logs
is
the
client
go
metrics.
B
They
give
us
a
an
aggregation,
so,
for
example,
you
will
be
able
to
know
how
many
list
watch
requests
were
made
over
period
of
time
and
you
can
find
an
increase
or
decrease,
but
it
does
not
get
you
the
granularity
of
which
service
account
is
causing
that
which
node
is
making
that
and
which
pod
within
that
node
is
making
that
all
of
that
was
important
for
me
to
find
out
the
exact
source
of
that
list.
Watch
request.
A
A
This
is
where
I'm
like
okay,
well
we're
getting
in
the
audit
log.
So
we're
we
have
a
print
statement
somewhere.
I!
Think,
like
all
what
you
could
do
is
this
is
one
of
those
places
where
you
can
identify
well,
this
would
be
nice
to
have.
You
could
dump
this
into
Prometheus
and
we
can
just
have
a
count
for
this
or
something
and
then
now
it
becomes
very
or
much
more
accessible
got.
B
A
B
Together
right
so
I
don't
know,
maybe
we
can
have
a
sidecar
that
filters
it
and
we
just
yeah
I
mean
I,
can
imagine
a
scenario
where,
let's
say
you
have
a
sidecar,
2,
API
server,
sidecar
container
that
filters
audit
logs
that
you
want
right
and
then
you
add
a
node
to
it
for
five
minutes
you
let
that
filter
go
through
collect
the
results
and
then
analyze
how
many
list
watch
requests
were
made.
We
could
do
something
like
that
that
will
be
generic
across
all
the.
A
Okay,
well,
I,
don't
know,
let's
let
something
to
think
about,
because
I
think
like
where
we
can
agree
is
like
this,
like
what
you
have
here
with
this
this
watch.
This
is
the
important
scale
and
performance
data
and
it's
it's
and
we
can
communicate
it
and
it's
about
it
and
it's
and
it's
useful
to
talk
about
you
just
got
to
make
it
a
little
bit
easier
to
access.
Yeah.
B
So
now
that
we
are
is
that
this
so
okay,
we
did
an
experiment
where
we
added
fake
nodes
and
added
fake
vmis.
There
was
no
change
on
creation
of
fake
vmis.
All
the
change
was
when
a
node
is
added,
so
this
tells
us
that
the
next
thing
that
we
have
to
look
at
is
load
generated
on
the
control
plane
when
a
VMI
is
added
by
the
cube,
Word,
Stack
and
Implement
simulation
for
that,
as
well.
Just
like
the
Watcher
threads.