►
From YouTube: Meshery Development Meeting (May 12th, 2021)
Description
No description was provided for this meeting.
If this is YOUR meeting, an easy way to fix this is to add a description to your video, wherever mtngs.io found it (probably YouTube).
B
B
C
D
C
Yeah
hi
so
good
afternoon,
good
evening
good
morning
to
everyone
good
morning,
so
I'm
a
software
development
like
I
am
working
as
a
software
development
intern
at
my
data,
and
I
am
looking
forward
to
contribute
to
levels
like
layer
5
mastery
I
have
like.
I
don't
have
much
knowledge
about
it
right
now,
but
I
am
going
through
it.
D
A
A
A
E
Yes,
so
we
have
this
image
up.
If
you
don't
know,
image
is
an
app
which
is,
it
is
a
sample
app
which
is
used
for
testing
awesome
filters
and
right
now
it
can
be
deployed
with
console,
as
well
as
the
sto
service
mesh
and
the
filter.
The
bosom
filter,
which
image
abuse
is
right.
Now
it
can
be
configured
using
a
json
object.
E
Pronoun
did
some
work
on
it
recently,
so
it
can
be
added
to
the
onward
filter
config
for
the
rate
limit
filter
and
when
we
apply
onward
filter
for
image
hub
operation
is
called.
We
can
make
a
template.
We
can
generate
the
template,
which
contains
that
json
object.
So
I'll
show
you
that
template,
which
is
used
right
now.
E
E
E
D
E
E
E
E
So
it
needs
that
the
config
for
that
filter,
the
converse
filter
yaml,
which
is
the
api
on
your
filter,
api
provided
by
sdu
for
configuring,
the
bottom
filters,
and
it
needs
that
there
should
be
this
field
which
contains
the
json
for
configuring,
the
endpoints
good
here,
okay,
so
we
are
working
on
adding
this
to
the
conflict.
It's
it's
not
much.
It's
very
little
work,
but
yeah
and
yeah.
E
D
Right,
yeah!
That's
sorry!
That's
right!
I
recall
now
that
the
the
configuration
of
the
filter
itself
was
statically
defined
and
hard
coded
inside
the
filter
and
that
you
and
prav
have
worked
to
generalize
the
filter
to
make
it
more
common
purpose.
More
general
purpose,
and-
and
this
is
part
of
this
is
part
of
tying-
that
off
like
you're,
bringing
it
you're,
bringing
it
back
into
into
measuring
right,
you're
yeah,
yeah,
nice
yeah,
nice.
That
makes
sense
so
one
of
one
of
the
things
to
do
here.
D
E
D
F
D
Maybe,
for
my
benefit
and
for
everyone
else's
we'll
say
that
so
you've
got
a
system,
that's
running
you're
running
istio.
You
have
deployed
a
sample
application.
The
application
is
called
image
hub.
It's
just
it's
a
ripoff
of
docker
hub.
You
know
in
on
purpose
because
it
was
demonstrated
at
dockercon
and
and
because
docker
hub
actually
needs
this
kind
of
functionality.
They
they
have
implemented
rate.
Limiting
for
how
you,
how
frequently
you
can
pull
images
down
unless
you're
a
subscriber
of
docker
hub.
D
You
can
pull
images
down
even
more
frequently,
so
they
rate
limit
intelligently,
based
on
whether
you're
authenticated
to
docker
hub
and
if
you're
authenticated,
whether
or
not
you're
paying
subscriber
or
not,
and
you
get
to
pull
images
faster
or
not.
Based
on
you
know
whether
or
not
you're
you're
paying
subscriber
and
so
for
docker
hub
the
engineers
there.
D
D
D
I
think
we
lost
rude
rocks,
so
he
so
he's
coming
back,
but
in
this
case
I'll
share
I'll
share
this
a
little
bit
to
just
help
everyone
with
an
understanding
of
what
what
the
work
that's
going
on.
So
this
is
just
a
copy
of
a
single
slide.
It's
it's
kind
of
busy,
but
it
what
it's
showing
is
that
what
root
rocks
is
showing
is
a
demo
of
using
istio.
D
Their
istio
uses
envoy,
as
its
data
plane
envoy,
is
a
popular
proxy
envoy
is
written
in
c
plus
it's
represented
by
this
pink
dark
purple
box
here
and
you
can
envoy,
has
plugins
that
you
know
so.
You
can,
and
one
of
the
ways
that
it
supports
plug-ins
is
using
a
framework
called
webassembly
and
webassembly
has
a
lot
of
you
know
what
we
want
like
a
lot
to
say
about
web
assembly,
but
it
has
a
lot
of
characteristics
similar
to
well
similar
to
uni
kernels,
a
bit
similar
to
docker
containers.
D
Actually,
and
as
such,
I
expect
this
technology
to
continue
to
grow
in
its
popularity
and
adoption,
and
but
one
of
the
plug-in
mechanisms
is
to
write
a
custom
filter
and
plug
it
into
envoy
and
have
that
filter
evaluate
requests,
traffic
requests
that
come
through.
In
this
case,
you
can
add
a
lot
of
intelligence
in
there
and
so
for
the
sample
application
and
the
filter
that
food
rocks
is
was
demonstrating.
D
It
will
look
at
those
requests,
grab
the
users
jot
their
jwt
token
and
look
for
two
pieces.
A
couple
of
pieces
of
information,
it'll
look
for
one.
What
at
what
level
that
user
is
it'll,
look
to
see
one?
Is
the
user
authenticated
one
two?
Is
the
user
subscribed
to
and
at
what
level
like
to
the
enterprise
level,
to
the
free
free
tier
and
based
on
that,
it
will
start
counting
how
many
requests
are
made
per
second
per
minute,
it'll
track
that
and
each
request
that
comes
through
it?
D
Does
a
quick
look
confirms
whether
or
not
based
on
the
current
count,
whether
or
not
that
user
should
be
allowed
to
pull
a
docker
image
in
this
case.
This
is
something
of
a
pattern
like.
There
are
many
many
applications
that
have
endpoints
that
users,
you
know
visit
or
send
requests
to,
and
there
are
many
applications
that
want
to
provide
a
like
something
of
a
class
of
service
so
for
the
free
tier,
the
unauthenticated
users,
their
class
of
services,
maybe
limited
rate
limited
to
a
certain
lower
level
for
those
that
are
at
the
enterprise
level.
D
Maybe
it's
unlimited,
just
as
as
fast
as
they
can
pull
things,
and
so
what
rudraksha
and
pranav
has
been
working
on
is
generalizing.
This
filter
this
little
purple
icon
purple,
and
so
this
filter
is
written
at
rust
and
they're
they're
generalizing
it
and
externalizing
the
configuration
of
like
the
fact
that
you
want
to
look
at
look
for
certain
things
in
the
request.
D
G
G
Yeah,
so
the
issue
was,
I
have
worked
on
this
ad
machine
filters
ui,
so
the
current
behavior
was
the
serving
measuring
credit
for
the
washing
printer.
So
I
am
not
currently
much
aware
of
the
curd
and
the
water
filters
so,
but
the
desired
behavior
was
creating
a
sorry
patents
ui
filters
ui,
which
was
similar
to
the
patterns
ui.
G
W
yeah
and
all
the
details
were
also
shown
here
so,
in
the
add
filters
what
I
did
just
change
the
filters
to
change
the
patterns
to
the
filters
ui,
so
it
might
look
similar
to
it
and
change
some
endpoints
of
the
patterns
ui
to
the
filters
ui
as
it's
visible.
Now,
let
me
also
try
to
show
it
from
my
dev
environment.
G
D
D
G
D
G
G
D
G
D
D
D
Okay,
got
it
good,
well
good.
Well,
you'll
have
to
message
about
the
specific
error
that
you
get
when
trying
to
connect
to
the
adapter,
so
we
can
show
which
it
could
be
just,
and
maybe
this
this
is
probably
helpful
for
everyone
as
well.
Is
that
you
see
in
your
terminal
there's
this
adapter
urls
adapter
urls
equals
mastery
local.layer
like
it.
It
might
be
that
your
local
machine
I
mean
for
sure
it
probably
doesn't
know
what
meshrelocal.layer5.io
is
yeah
it's
hosted.
Let
me.
E
G
D
Gotcha,
this
is
a
known
cool
good.
We
should
work
on
our
contributor
docs
to
make
sure
that
it's
clear
that,
like
that's
because
you're
not
running
any
adapters,
basically,
and
so
the
adapters
are
so,
let's
we'll
get
you
some
assistance.
Let's
not
do
it
right
now:
okay,
but
but
there's
no
question
you'll
be
over
this
hump
in
no
time
look,
and
so
just
briefly
because
it
takes
like
five
seconds
to
say
it:
you'll
want
to
go,
build
and
run
on
one
of
the
adapters
or
deploy
it
as
a
container
like.
A
A
A
Oh
sure,
yeah
I'll
just
share
my
screen.
Okay,
great,
oh,
my
goodness
visible
yeah,
it's
visible,
okay,
cool!
So
in
order
to
save
time
I
just
say
what
I
have
done.
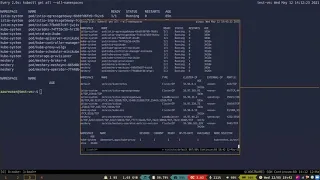
Basically,
I've
started
measuring
basically
like
you
can
see
that
my
operator
is
installed
and
it's
running
and
I'm
running
istio
adapter
and
like
basically
that's
it.
So
these
are
all
the
components
that
are
installed
inside
my
cluster.
A
A
A
So
if
someone
missed
it,
I
can
basically
so
I
remove
all
the
configuration
it's
all
fresh
and
then
it
gets
auto
connected
and
let's
say,
for
example,
if
I'm
in
this
page-
and
I
don't
have
this-
if
I
refresh
in
in
here
it-
it
still
gets
water
connected
and
initializes
one
of
the
boards,
which
right
now
doesn't
have
any
data
but
yeah.
So
basically
that's
how
it
works
so
even
for
prometheus,
just
refresh
it
and
it
just
sort
of
initializes
yeah.
A
B
D
A
A
So
basically,
we've
got
this
graph
endpoint,
where
we
register
all
the
control
plane
elements
so
right
now
it
gives
these
two
as
the
available
add-ons,
and
it
will
give
more
if,
if
more
are
available,
so
so
yeah,
basically
how
much
ever
is
available
in
this
endpoint
it
will.
It
will
try
to
initialize
all
of
them.
D
A
B
D
D
Samir
last
time
we
met
you
had
some
questions
around
the
utility
is
simiron
no
well.
He
had
some
questions
around
the
utility
of
the
performance
results.
The
performance
tests,
the
way
that
mesri
does
performance,
characterizing
and
the
way
it's
graphing,
and
I
don't
think
you
know
he
hadn't
seen
the
integration
between
mesheri
and
grafana
yet,
and
so
I
think,
he's
having
audio
trouble.
That's
why
he
dropped.
A
D
You
know
concept
in
the
past
and
it's
kind
of
riddled
with
well
network
connectivity.
You
know
challenges
because
in
your
environment
you
might
deploy,
you
might
have
a
bunch
of
different
environments,
deploying
different
things
different.
You
know
grafana
to
different
places,
and
so
the
reachability
is
a
concern
and
so
abhishek
it
sounds
like
you.
A
lot
of
those
concerns
were
handled
in
mesh
kit.
H
So
the
the
the
question
is
grafana
and
prometheus
they're
they're
being
used
for
performance,
and
then
the
graphing
of
that
performs
right
is
that
correct
yeah
like
basically
metrics
okay.
So
if
you
have
multiple
instances
of
prometheus
and
grafana,
what
difference
would
it
make
to
the
performance
of
a
measure
of
a
service
mesh
and
how
would
it
make
the
graphing
of
that
performance
any
different?
H
H
So
that
is
the
question
and,
and
the
thing
is
I
was
just
curious.
Can
you
have
like
a
drop
down
box?
I
mean
where
you
have
the
different
instances
of
measuring
parameters
that
you
might
I
mean
I
don't
know
if
that's
in
keeping
with
the
general
look
and
feel
of
the
user
interface,
you
know
just
a
couple
of
questions.
H
So
the
question
is:
should
the
configuration
be
attached
to
the
individual
instances
of
promises
in
grafana,
or
should
it
be
some
it
should
be,
or
should
it
be
a
static
configuration
that
you
attach
to
an
available
instance
of
prometheus
and
grafana
see
because
if
you
are
seeing
different
statistics
in
different
graphs
with
the
same
service
mesh,
which
one
are
you
going
to
take,
I
mean
that
would
be
very,
very
ambiguous
right.
How
can
you
know
whether
what
you're
seeing
is
really
the
actual
thing.
A
No,
no,
so
what
I
meant
is
that
basically
prometheus
and
grafana
have
their
own
conflicts
like.
Basically,
the
conflicts
would
include
that
where
to
pull
metrics
from
and
what
are
the
parameters
to
show
and
etc?
So,
like
that,
we
don't
do
anything
or
we
don't
configure
anything
in
prometheus
and
refer
instances.
We
just
pull
up
their
data
and
then
just
visualize
it
in
the
dashboard.
H
But
no,
actually,
that's
exactly
the
point
right
see.
The
thing
is
you
want
to
see
the
performance?
It's
not
that
somebody's
showing
this
to
you
and
say
hey!
This
is
fine
and
you
can
say:
oh
yeah,
yeah
yeah,
you're
right,
you
know
see
the
thing,
so
the
the
application
of
the
configuration
should
be
in
the
hands
of
the
person
who's
going
to
look
at
the
performance
results
right.
H
I'm
not
going
to
take
somebody
else's
word
and
say
hey
this
is
this
is
great
and
say
yeah
and
you
say
yeah
yeah
sure
I
agree.
Yeah,
it
looks
great,
you
know
see.
The
thing
is
you
want
to.
You
want
to
set
up
your
your
your
criteria
and
see
if
it
passes
your
criteria,
so
I
think
you
should
be
able
to
assign
the
configuration
to
whatever
it
is
that
you're
trying
to
measure
you
see,
maybe
I'm
going
off
off
base
here.
H
A
Sure
so,
basically
graphene
prometheus
does
not
measure
performance,
but
rather
it
just
shows
just
the
metrics
of
the
real-time
metrics
of
whatever
is
going
on
inside
prometheus,
basically
pulls
the
data
and
graphing
basically
displays
the
data.
It's
nothing
more
than
a
mere
display
tool,
so
the
configuration
is
basically
the
it
belongs
to
the
owner,
who
created
those
instances.
A
Basically,
in
this
case
it's
istio,
so
it
would
belong
to
you
and
it
will
be
controlled
and
configured
by
and
there
can
be
many
more
other
instances,
for
example,
linkedin
or
any
other
service
measure,
even
independent
promises,
so
it
actually
depends
on
who
the
owner
is
and
we
we
definitely
are
not
owner.
We
just
facilitate
a
interface
to
view
all
these
metrics
and
like
compare
them
and
do
do
operations
over
them.
H
A
You
won't
get
this
multiple
different
views
of
the
same
service.
You
will
get
different
views
of
different
service
measures,
say,
for
example,
this
particular
instance
of
grafana
will
show
you
the
view
for
istio
and
another
instance
would
like
a
difference.
Instance
would
show
for
linkedin
and
they
are
basically
maintained
and
configured
by
their
own
service
messages.
H
D
Some
of
that
is
that
the
metrics,
the
performance
charts,
are
like
implicitly
measuring
already
understands
that
certain
charts
are
associated
to
specific
service
meshes,
and
so
it
makes
sense
that
those
charts
are
really
only
shown
in
context
of
those
meshes,
but
the
lack
of
control
given
to
the
user
leaves
them
un
unconvinced
or
leaves
them.
There's
more
and
there's
more
controls
to
be
provided
right
now,
like
to
your
point
of
shack
earlier,
you're,
not
sure
if
multiple
prometheuses
or
multiple
grafanas
can
be
registered
at
the
same
time,
they
probably
like.
D
D
Those
things
that
mesh
re
is
going
to
show.
You
so
a
metrics
board
and
the
configuration
being
specific
to
a
grafana
instance,
which
is
appropriate
and
will
probably
always
be
like
that
the
whoops,
the
challenge
is
well
how
many
board
configurations
can
mesh
re
have
and
how
many
is
it
capable
of
displaying
and
on
what
uis
does
it
display?
What
boards
is
it's
just
things
to
be
worked
on.
D
The
step
that
you
just
took.
Abhishek
is
great,
like
you're,
just
taking
the
existing
functionality
and
helping
people
connect
to
it
in
a
more
automated
fashion
like
helping
get
them
to
it
more
quickly.
Now
the
functionality
that's
there
about
control
over
the
boards
and
which
metrics
to
show,
and
et
cetera,
like
oh
okay,
that
there's
improvement.
That
needs
to
happen
there
but
sort
of
constrained
to
what
you
were
trying
to
do
about
automating
the
connectivity.
A
A
F
F
F
D
D
D
D
That
will
improve
the
confidence
of
our
releases
of
measuring
releases.
It
actions
like
this
can
also
be
taken
and
given
to
other
service
mesh
teams
so
that
they
can
or
well
it
doesn't
have
to
be
service
mesh
teams.
Basically,
anyone
who
wants
to
run
a
conformant,
a
conformance
test
or
a
performance
test
and
integrate
that
into
their
ci
pipeline,
specifically
if
their
pipeline
or
part
of
their
pipeline
is
in
github.
D
It's
it's
important
work
and
totally
joking
about
hurrying
up.
It
actually
will
be.
Nginx
is
an
example
of
they've
emailed
twice
this
last
week,
saying
hey:
we
want
to
use
this,
how
can
we
use
it
and
so
pretty
soon,
I'm
just
going
to
tell
them
what
color
your
car
is
where
you
park
it
that
way,
they
can
go
over
and
scratch
their
keys
in
the
side
just
waiting
for
it.
A
I
Hello,
everyone,
so
I'm
showing
and
demonstrating
the
latest
designs.
We
currently
are
for
the
mystery
notification
system,
so
these,
like
our
fourth
iteration
of
the
notification
system
so
far
and
so
finally,
button
one
that
works
looks
good
both
in
what's
in
design
the
user
experience
and
the
accessibility
cost
rejects
for
everything
with
regards
to
opinions,
because
last
last
demonstration,
so
these
are
current
ones.
We
have
both
the
light
scheme
of
the
infos
info
alerts,
the
dark
skin,
the
dark
success,
the
light
success,
color
scheme
and
the
light
error
scheme
and
in
dark
warning
skin.
I
I
D
So
you
know
a
couple
of
comments.
I
don't
know
if
austin
said
this,
I
think
every
time
that
someone
goes
to
present,
I
end
up
having
multiple
chats.
So
I
apologize
if
this
is
a
repeat,
but
what
austin
was
in
part
showing
is
the
future
toward
the
ability
for
a
user
to
select
between
color
schemes
like
having
a
dark
mode,
if
you
will
and
which
is
always
nice
for
us
engineers.
D
That's
a
great
place
to
start,
because
this
isn't
so
much
about
building
out
new
functionality
in
the
ui
as
much
as
it
is
about
gaining
familiarity
with
material
material,
ui
and
measuring
ui
and
color
scheming.
You
know
like
updating
existing
components
to
match
the
design.
That's
there
one
thing
austin
as
you
like,
I'm
hoping
you
might
get
to
this
next
step
where
the
the
those
toaster
notifications,
those
are
much
improved.
D
A
D
Yeah
yeah
I'd
like
to
if
I,
if
I
felt
like
that,
was
well
in
hand
that
maybe
I'll
say
this
that
so
we're.
If,
for
those
of
you,
who've,
been
paying
attention-
and
I
think
all
of
you
on
the
call
have
been
there
have
been
a
couple
of
point
releases
from
the
major
release
that
was
done
of
mesherie
v0.50.
D
D
D
There's
someone
had
recent
someone
has
in
the
last
week
done
an
analysis
of
mesherie's
adapters
on
docker
hub
and
helped
identify
that
the
octarine
adapter.
Well.
Has-
and
we
knew
it
at
the
time
is
just
compiled
into
the
golang.
It
has
some
aws
tokens
in
there.
I
guess
they've.
I
guess
those
have
a
challenge
of
getting
exposed
in
the
docker
image,
so
those
aws
credentials
are
not
exposed
in
the
repo
for
the
octane
adapter,
but
they
are
included,
probably
as
environment
variables,
inside
the
adapter
image.
D
So
so
anyway,
more
security,
more
people
getting
interested
in
working
on
security
around
the
project,
which
is
great,
that's
one
thing
and
then
other
than
that.
We're
and
we're
three
minutes
over.
So
the
last
thing
to
just
think
on
is
well
one.
If
anyone
would
like
to
do
this
on
the
call.
If
anyone
would
like
to
go
update
the
roadmap
to
just
format
this
a
little
bit
better,
there's
a
missing
bullet
point
there
and
there
please
do
that.
D
D
They
like
they
actually
sort
of,
have
landed
in
v050
and
are
being
enhanced
really
around
meshrey's
ctl,
probably
in
v060.
So
the
roadmap
for
all
of
you
who
are
kind
of
unfamiliar
right
now,
it's
broken
down
between
mastery
server
and
sort
of
messaging
overarchingly,
and
then
it's
command
line
client.
D
Now
you
know
following
in
that
same
paradigm,
we
probably
should
get
to
a
point
where
we're
tracking
measuring
ui
in
its
roadmap.
The
reality
is
like
the
majority
of
the
time
we
should
be
like
if
we
should
be
able
to
as
a
community
get
to
the
point
where,
if
we're
saying
you
know,
patterns
will
be
delivered
this
or
this
feature
will
be
delivered
that
well.
D
That
means
that
there's
to
and
vijay
has
pointed
this
out
before
that,
but
it
means
that
that
the
feature
is,
you
know
holistically,
delivered,
there's
doc
user
documentation,
api
documentation,
probably
a
ui
for
it.
Some
back
end
implementation,
like
you,
know
the
whole
the
whole
thing
so
in
some
respects.
D
I
think
that
the
further
that
we
as
a
community
and
and
mastery
as
a
project
matures
we
might
be
able
to
just
consolidate
the
road
maps
to
just
be
you
know,
a
single
one,
because
they
should
be
in
concert
with
one
another
boy
that
that
might
be
a
fantasy,
that
we
would
ever
arrive
there,
but
it's
a
good
it's
a
good
fantasy
to
have.
It
is
possible.
D
D
D
Yeah
and
so
one
of
vijay's
questions
was
just
about
you
know
if
we
bring
forth
if
the
project
brings
forth
light
and
dark
color
modes,
or
you
know
that
there
is
a
burgeoning
set
of
user
preferences
that
when
you're
in
the
measure
ui
that
you
click
on
your
user
profile,
your
avatar
and
there's
some
preferences
in
there
there's
just
a
few,
but
that
seems
like
that
would
be
a
logical
place
to
expose
that
type
of
control
to
the
user.
So
good
question
vijay.