►
From YouTube: Meshery Development Meeting - Aug. 27th 2019
Description
Working on a PR for @giltene's wrk2.
B
So
I
can
share
my
screen.
Okay,
basically
with
playing
this
w
RK
2
for
the
Total
Request
count,
I
was
getting
the
number,
but
it
wasn't
really
make
sense
so
I'm
just
trying
to
see.
Where
is
the
point?
So
the
addition
right
now
is
similar
to
percentile
I'm,
just
adding
stats
total
count
which
is
supposed
to
take.
The
total
count
returned.
B
Here
and
what
else
yeah?
That's
the
change
here
and
in
the
script
changed
supposed
to
be
in
two
places,
so
it's
gonna
push
for
the
Lord.
That's
very
gonna,
be
the
connection
and
similar
to
methods
and
the
next
thing
it
should
push
as
total
count,
and
when
we
come
to
law
we
should
be
able
basically
to
see
this
value.
B
C
A
B
Yeah,
so
for
the
fourth
year,
that's
the
statistics.
We
have
right
now
we
were
getting,
but
it
is
supposed
to
check
also
in
his
side,
because
the
total
count
I
am
talking.
Is
that
one?
Let's
say
there
is
certify
or
equation
over
time.
It
should
show
you
this
start
and
time.
You
see
like,
let's
say
from
zero
seconds
to
zero
zero
for
millisecond
and
the
next
start
at
that
and
the
next
basically.
But
it's
like
increasing
one
percentile
at
a
time.
A
B
Let's
say
yeah
one
percentile
to
percenter,
you
remember
for
tag.
Willie
are
key
to
what
I
was
showing
that
that's
exactly
as
a
percentile
high.
It's
increasing
I
am
assuming
the
same
way.
The
faulty
is
increasing
like
every
time.
Zero
point.
Zero
is
zero
point,
ten
twenty
like
right
and
when
it
goes
to
the
like
further,
you
see
it's
even
going
more
being
more
precise.
B
So
that's
so!
Basically
right
now
we
get
VSWR
k2
and
I'm
also
assuming
that
that's
logic
4002
from
double
our
key
okay,
considering
that
was
quite
famous
and
they
were
first
in
the
market
and
basically
here
just
the
count
percent
should
be
fine
to
put
in
Jason
just
we
may
need
to
add
start
and
end
time,
she's
missing
right
now,
yeah,
that's
I,
guess
also
grish
supposed
to
confirm
for
for
Tia,
but
I
think
that's
illogical.
It
should
be
the
same
way
you're
working
okay,
but
we
I
don't
think
in
the
chart.
C
B
B
A
B
A
A
B
B
C
I
mean
violently,
like
you
know,
we
are
trying
to
get
similar
stats
from
wrq
too.
So,
as
you
mentioned,
you
can
see
like
you
know,
in
Florida
yo,
like
you
know,
we
have
the
timestamps
or
the
start
time
and
dying.
Of
course,
like
not
the
start.
Time
of
the
test
is
actually
at
the
top,
so
from
then
on,
like
we
can
actually
compute
the
time
when
each
and
every
request
was
sent
and
time
what
now
I
took
for
it
to
get
back
the
response
essentially
and
the
percentile,
like
you
know,
value
or
the
percent
value.
A
C
True,
that's
true,
it
is
actually
the
time.
Yes,
it
is
time.
Is
that's
correct,
so
in
that
time
window,
which
is
like
you
said,
every
every
one,
millisecond
I
think
it's
actually
computing
like
an
how
many
requests
actually
made
it
so
so
that
that's
kind
of
like
a
how
for
IO
is
actually
doing
its
math
I.
C
A
C
You
know
what
let
me
do
this
I
can
actually
get
the
data
that's
used
for
rendering
the
graph
so
I
mean
the
the
response
coming
out
before
IO
is
actually
not
the
exact
analogy
for
I'm
doing
the
chart.
It
is
computed
so
from
the
data
that
4i
overturns
its
computer
in
the
UI
to
actually
render
the
chart.
So
there
are
two
different
things
now,
I
think
what.
C
Easier
for
WR
k
is
actually
to
just
give
the
data
that
is
needed
for
the
charts,
rather
than
not
worry
about
Rio
data,
maybe
because
yes
for
the
chart,
we
only
seem
to
care
about.
You
know
one
or
two
things
like
you
know,
which
is
the
percentiles,
and
you
know
the
accumulator
time
that's
taken.
You
know,
rather
than
you
know
and
I
think
for
WR
k
to,
like
you
know,
probably
has
the
data,
like
you
know,
I,
like
Sacco,
actually
shared
his
screen,
so
maybe
we'll
doc.
C
We
can
actually
maybe
draw
a
very
similar
diagram,
but
you
know,
if
chart
without
having
to
add
an
extra
layer
of
computation.
Maybe
I
mean
that's
I.
Think
the
easiest
thing
to
do,
because
I
don't
think
it's
going
to
be
easy
to
actually
get
the
you
know.
The
times
like
is
like
for
IO
has
been
getting
the
data
yeah.
A
C
A
case,
what's
the
second
we're
up
here,
you
can
see
mostly
what
we
are
using
is
actually
the
percentiles,
so
there
was
a
mini
median
as
actually
p50
average
and
then
a
seventy-five.
Ninety.
Ninety
nine.
Ninety
nine
point,
nine,
a
max
so
I
think
we
should
be
able
to
maybe
get
something
along
these
lines.
And
now
the
interesting
thing
with
this
rap
is
it's
not
like
a
continuous
graph.
It
is
actually
like
mostly
points,
so
you
know
for
the
whole
graph.
It's
just
like.
C
You
know,
for
example,
for
this
result
said,
like
you
know
the
first
result
set.
You
know
all
it's
taking
into
account:
it's
actually
the
values
you
can
see.
Like
you
know,
it's
a
all
is
taking
to
account
is
like,
though
you
know,
the
total
of
the
overall
QP
s,
the
total
max.
You
know,
duration,
the
P
99.9
Eurasian,
P,
99
Eurasian,
ninety
yeah,
but
you
can
see
that,
like
you
know,
this
chart
here
is
actually
just
taking.
It
account
individual
values.
I
think
you
know
we
can
actually
get
this.
B
A
Thing
about
when
we
go
to
go
to
format
the
thing
about
your
suggestion:
grecian
it
makes
intuitive
sense.
Sort
of
cause
for
potential
concern
is
to
the
extent
that
we
ever
changed
these
graphs.
Maybe
that
would
still
be
the
same
data
and
that
would
be
fine
I.
Don't
I,
don't
think
that
we've
completely
digested
these
and
really
assess
that
these
are
the
best
use
the
best
way
to
communicate
to
users
that
this
is
what's
going
on.
A
Maybe
they
are
maybe
it's
just
it's
a
complex
thing
and
it
just
takes
a
while
for
people
to
digest.
I
I
think
that
if
this
one's
not
entirely
unintuitive
I
think
this
blue
line
here
is
you
just
if
you
don't
read
anything,
you
just
see
the
books
like
a
cumulative
thing,
going
from
zero
to
to
100
that
if
you
looked
at
a
histogram
before
it's,
not
on
obvious
that
that's
what's
happening,
that
you
you're,
probably
always
find
your
P
50
is
you've
got
the
most
count
in
there.
A
A
A
Percentiles
that
are
the
the
and
so
okay,
so
thinking
about
that
out
loud,
just
as
we
go
to
make
some
decisions
around
how
the
data
is
formatted,
I
think
the
other
thing
to
think
about
is
that
this
multi,
the
having
multiple
scales
on
the
same
axis
to
me,
isn't
naturally
intuitive
that
okay,
so
I've
got
a
high-flow
up
top
here.
I've
also
got
a
high
latency
response
up
top
here.
Does
that
mean
that
there's
a
correlation.
B
A
B
A
A
B
A
Right
and
kind
of
a
funny
thing
about
this
percent
is
that
it's
going
to
110,
which,
if
you
know
necessarily
make
sense,
neither
does
the
negative
10
can't
make
sense.
Maybe
it
just
draws
a
prettier
graph,
but
then
yeah
over
here.
The
count
also
this
this-
the
duration
is
1.4
seconds.
So,
okay,
so
only
18
requests
percent.
Okay.
So
this
is
a
courage.
I
go
to
a
bit
of
a
longer
duration,
one
30
seconds
to
a
Guri
Garissa
like
we're
we're,
mostly
just
we're
actually
kind
of
deviated
aggressing
from
what
we're
trying
to
accomplish
here.
A
C
Think
we
already
had
a
very
similar
discussion.
Some
time
back,
I
mean
we
started
off
with
work
for
IO
has
been
probably,
but
is
that
the
right
thing
in
the
long
run
yeah?
We
don't
need
to
have
to
give
it
some
serious
thought,
hello,
the
amount
of
data
and
the
type
of
data
that's
being
returned.
You
know
it's
also
important.
Like
you
look
at
all
the
little
generators
like
you
know
all
they
provide.
You
is
a
either
some
kind
of
a
latency
information
and
know
kind
of
the
accumulator
count.
That's
pretty
much
all
they
provide.
C
So
what
for
I/o
has
done
is
like
you
know,
with
that
data
they'll
try
to
enrich
it
with
some
time.
Metrics
like
you
know,
and
and
try
to
chart
it
out
in
a
sensible
way,
I
mean
by
sensible,
I,
don't
know
to
who
again,
but
it
looks
like
I'm
in
fourth
I
was
being
used
in
several
projects,
so
it
looks
like
I
mean
it's,
it's
ok.
People
are
ok,
seeing
those
charts,
I,
don't
think
anybody
has
actually
taken
data
from
forward
I/o
and
has
tried
to
do
a
different
chart.
I,
don't
think
so.
A
C
C
A
C
I
mean
like
I'm
looking
at
like
analog
data,
we
got
cut
from
poor
audio,
that's
not
easy
or
I
mean
this
is
exactly
what
I
wanted
to
accomplish
like
nowhere,
yeah,
hey,
let's
not
touch
anything
in
the
UI
I
mean,
let's
just
make
changed
so
that
the
data
from
the
vrk
is
in
the
same
format
as
for
IO,
but
looks
like
it's
not
going
to
be
possible.
That's
exactly
like
know
why
I
said:
okay,
you
know
what
you
know:
it's
not
going
to
be
possible.
C
C
C
Yeah,
so
if
you're
looking
at
you're
looking
at
this
I
hope,
you
can
see
my
for
IO
chart
yeah.
So
if
you,
if
you
look
at
it
Sokka,
you
have
to
tell
me
this
now.
All
this
guy
is
using
for
charting
there's.
Actually,
the
cumulative
count
which
I
think
WK
2
is
providing
or
I
mean,
as
increases
I,
remember,
seeing
the
count
increased,
zakharik,
yeah.
C
C
B
C
Did
you
just
follow
my
mouse
pointer?
You
can
see.
So
that's
cumulative
ninety-nine
point,
seven,
one!
Seven!
That's
ninety!
Nine
point.
Seven!
Three!
Three!
That's
ninety
nine
point,
seven
three.
Three,
probably
that's
a
bug,
but
that's
final
person.
You
see
that
this
is
so.
This
chart
here
is
actually
a
cumulative
of
the
counts,
which
means
it's
it's
kind
of
what
you
want
to
build
up
off.
The
total
count
as
a
time
progresses.
That's
essentially
what
it
is,
but
at
the
bottom
they
have
the
time.
So
we
have
the
accumulation
or
accumulation
of
the
count.
C
But
do
we
know
the
time
is
actually
the
question.
So
what
this
is
saying
is
accumulatively.
Okay.
This
is
how
it
went
it's
kind
of
like
what
this
is
showing
but
against.
There
is
this
response
time
in
seconds
so
which
means
for
for
a
percentile
value
of
like
a
percentile
value
somewhere
here,
like
laughs,
roughly
50%,
so
that's
like
roughly
around
the
median
the
time
taken
for
that
request
was
somewhere
between
like
40,
milliseconds
I
would
say
it's
to
the
point.
So
do
we
have
that
data
from
the
vrk
so.
B
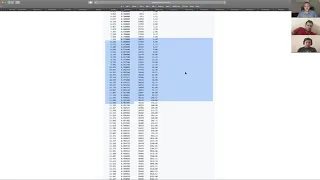
Basically,
as
I
understood,
we
have
like,
if
you
go
to
WT
the
table,
so
basically,
here
you
have
the
count.
The
total
count,
the
percentile
from
zero
to
hundred
and
the
response
time,
assuming
the
value
of
percentile
should
be
yeah.
That's
the
response
time
if
you
opened
the
link
in
the
zoom,
the
doubler
tea
table,
so
we
basically
here,
we
have
the
percentile
count
and
response
time
and
he
ended
here
in
the
song
link
just.
C
B
B
B
C
B
A
C
B
C
C
C
Is
based
on
what
the
response
time,
though,
now
coming
back
to
yours.
So
this
is
what
I'm
saying
so
for
a
second
okay
I'll
say
forget
about
the
percentile
column
and
just
focus
on
the
response,
time
value
and
the
total
count.
So
maybe
we
can
do
a
similar
math
like,
for
example,
we
can
say
okay
between
4,
millisecond
and
5
minutes
are
6
in
the
bucket
from
4
to
6
milliseconds.
We
can
count
like
the
total
number
of
requests.
By
doing
a
Mac
look
mean
the
values
maybe
but
between
like
between
this.
C
So
so
this
value
is-
or
this
is
a
number
of
requests
at
4,
milliseconds
I
mean
like
in
a
minus
1,
so
it's
gonna
be
three
nine
five
zero
at
four
milliseconds
and
roughly.
If
we
take
this,
that's
going
to
be
15
8:03,
so
this
probably
subtracted
from
this
might
actually
give
us
the
number
of
the
number
of
responses
in
that
bucket
of
time.
C
So
so
between
4
&
6,
then
you
know
it
I
think
it's
just
one
of
your
direct
subtraction,
like
you
know
so
this
minus
this
will
probably
just
give
us
the
total
count
in
this
time
window
and
the
same,
like
you
know,
from
this
value
to
the
next
we
can.
We
can,
you
know,
count
the
number
of
number
of
requests
in
that
bucket
and
so
that's
kind
of
what
the
histogram
is
doing.
C
I
just
need
to
understand.
You
know
how.
How
is
this
trick
your
mind?
You
know
because
it
seems
to
be
around
I'm
here.
It's
like
to
second,
but
here
it
is
like
from
30
to
35,
and
then
here
look
for
example
at
the
bottom
is
from
45
to
60,
so
yeah
I'm,
just
trying
to
understand
like
how
it's
coming
up
with
this.
A
A
Yes,
there's
14,
and
so
it's
just
a
bad
graph
or
a
bad.
They
shouldn't
have
all
those
vertices,
there's
14
from
70
to
80,
or
rather
actually
should
go
down
to
80
right
there
yeah.
Actually,
the
they've
got
a
bad,
a
very
confusing
and
bad
graph,
because
they've
got
a
202
and
so
did
they're
not
displaying
the
value
they
shouldn't.
A
A
Yeah
interesting
I
didn't
think
there,
just
in
this
case
they're
hitting
the
same
they're
hitting
their
sang
from
60
to
70,
whether
you're
at
the
60
or
you're
at
the
70.
It's
going
to
give
me
zero
zero
at
the
at
the
low
end.
You
know,
and
then,
when
you
go
to
start
from
70
to
80
it's
14
and
14,
it
would
be
a
less
confusing
thing
if
they
just
had
it
at
once,
and
they
would
have
it
on
the
right
hand,
side
so
you'd,
say
yeah
after
that
time
period.
A
It
passed
this
as
the
count
in
some
respects.
It's
accurate
that
they
put
it
on
both
the
left
hand
right
hand
side,
because,
because
they're
saying
there
was
a
fourteen
of
them
could
have
been
like
79
milliseconds,
but
they're
just
normalizing
and
saying
that
it
was
between
70
and
80,
and
so
anyway,
of
the
so
there's
one
thing
this
meeting
is
going
to
close
and
so
I'm
gonna.
Send
you
guys
a
different
lengths
that
we
can
carry.