►
From YouTube: NebulaGraph community meeting [2022-11-30] (3.3.0 intro, graph modeling and transforming with dbt)
Description
Project Heartbeats - Wey GU
Introducing and Demo of NebulaGraph 3.3.0 - Wey GU
Demo: How I model data from multiple sources in tabular format into NebulaGraph with dbt and NebulaGraph importer. - Wey GU
A
A
High
Goran
welcome,
okay,
okay,
so
one
of
our
new
contributor
is
working
on
a
bunch
of
different
rfcs.
One
of
them
are
a
user-defined
functions
that
they
are
using
it
in
their
Downstream
folks.
Another
one
is
about
some
specific
filter
push
down,
it's
related
to
some
optimization
of
the
performance
and
they
also
introduced
yet
another
flat
sampling
feature,
and
there
are
more
actually
they
were.
You
know:
hacking,
never
graphing
many
ways.
A
So
quite
interesting
and
another
thing
is:
we
recently
have
a
bunch
of
new
users
leveraging
the
nebula
NG
batteries,
which
is
a
Java
or
in
a
fashion
of
the
my
batteries.
So
there
are
some
fixes
related
to
eight,
because
it
is
heavily
leveraging
the
parameterized
query
and
we
hit
some
core
box
in
this
project
by
the
users
and
they
were
all
fixed,
so
some
others
are.
We
have.
A
We
have
a
newly
contributed
by
an
user
of
a
python,
orm
I'm,
not
sure
if
I
already
share
this
last
time-
and
we
also
have
a
new
project
called
nebula
real
time
exchange.
So
it's
leveraging
the
capability
from
the
Flink
CDC
and
you
know,
help
out
sync
data
from
my
core.
In
in
a
streaming
way,
this
this
one
is
new.
This
comes
from
one
of
our
new
contributors
in
the
in
in
the
in
the
community
from
the
being
car.
This
is
a
organization.
A
The
main
contributors
is
the
WD
W
drost
is
is
will
also
his
in
our
community,
so
this
project
is
targeted
to
making
your
application
running
on
Java.
That
was
on
top
of
neo4j
easier
to
adopt
to
a
neighbor
graph.
So
you
basically
just
need
to
make
many
more
changes
on
our
codes
to
you
know,
make
it
running
on
Naval
graph
instead,
so
it's
quite
a
young
project.
So
if
you're
interested
just
feel
free
to
check
that
out,
and
as
I
mentioned,
we
have
a
new
release
of
Studio.
B
A
Okay,
so
this
time
we
we
mostly
sorry,
we
mostly
allow
our
leveraging
changes
in
in
the
stability
and
the
performance.
So
we
have
a
bunch
of
performance,
optimization,
PRS
and
the
new.
We
don't
have
too
much
New
Leaf
introduce
the
features,
so
one
of
them
is.
We
support
the
wear
class
in
in
case
subgraph,
so
we
will
later
we
will
support.
A
A
Specifically,
on
the
graphic
visualized
tooling
later
so
on
Studio,
we
have
what
you
see
what
you
get
schema
tooling
and
you
can
also
view
your
schema
in
a
visualized
way,
but
I
think
in
best
best
effort.
I
will
expose
more
details
later
and
we
have
a
quick
starter.
So
it's
a
just
a
welcome
page
and
inside
our
starter,
we,
you
can
easily
load
some.
You
know
quick
start
data
set
in
this
quick
starter.
Later
I
will
show
you
on
dashboard.
A
We
have
a
bunch
of
new
features
introduced,
but
some
of
them
are
relying
on
on
other
components,
so
they
are
not
released
in
this
this
cycle,
but
but
only
one
feature
finalized
is
called
it's
the
process.
Metrics
I
will
show
you
later
it's
just
some
metrics
on
the
single
process
and
on
the
Explorer
side
we
have
some
more
features.
This
is
The
Edge
aggregation
and
the
query
Builder.
A
We
have
in
the
match
count.
We
have
the
QPS
with
two
to
eight
times
improved
and
we,
with
only
you,
know
one
in
five
latency
and
for
the
three
hoop
query.
So
we
have
QPS
in
40
to
100
percent
of
improvement
when
we
went
one-third
latency
and
we
we
were
testing
everything
on
three
node
environmental
deployment
in
the
ldbc
sf100
data
set.
A
A
A
Player
age
so
be
sure
to
check
out
the
documentation
on
this
referral
character,
and
there
are
some
certain
limitations
out
there
so
be
sure
to
check
out
the
documentation
session
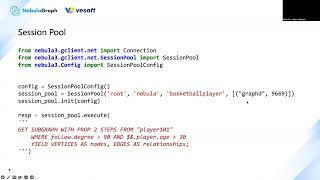
pool.
We,
we
introduced
the
session
proof
for
python,
Java,
go
and
see,
plus
plus
in
the
client
side.
So
in
that
case
you,
if
you
are,
you
are
running
nav
application
is
the
online
service.
You
don't
have
to
maintain
your
own
queue
of
sessions.
A
Would
they
actually
need
to
implement
something
like
this
and
we
we
try
to
guide
them
to
you
know
you
should
Implement
something
like
this,
but
it's
not
always.
There
are
some
issues
and
not
always
not
that
optimal.
So
it's
a
common
thing,
so
we
we
we
did
decided
to
implement
in
in
the
SDK
site.
So
this
is
an
example,
so
you
just
provide
the
information
of
the
graph
d
and
be
sure
that
the
mindset
of
the
session
is
binded
with
the
space.
A
So
you
should
provide
the
space,
the
information
of
the
space
together
with
the
credential
and
afterwards
you
have
a
pool
of
sessions
and
every
time
you
want
to
call
it,
you
can
just
you
know,
directly
use
the
execute
it
will
be.
You
know
a
lot
easier.
A
lot
of
you
know,
session
related
handling.
Logic
can
be
decoupled
from
your
application
logic
from
now
on,
if,
if
your
module
fits
the
the
session
pool
module,
on
the
other
hand,
if
you
you
need
from
your
application
code,
you
want
to
create
schema,
drop
space
and
switch
space.
A
In
that
case,
you,
you
should
use
the
connection
pool
and
create
session
from
there.
Instead
of
leveraging
the
session,
the
session
pool
concept
is
binded
with
the
specific
space
you
can
switch,
but
it's
not
designed
for
this
case
yeah
and
yeah,
and
this
is
the
time
step
and
date,
time
type
casting
functions,
so
you
can
just
use
it
previously.
It's
not
supportive.
So
a
lot
of
users
is
urging
to
request
this
feature.
A
And
finally,
this
is
the
tag
class.
So
this
is
a
quite
a
big
change,
but
frankly
for
my
opposition,
most
of
user
they
for
most
of
you,
so
they
don't
need
a
tag
list,
but
while
we
introduce
this
concept
of
vertex
is
not
mandatory
to
have
one
at
least
one
tag
binding,
and
that
means,
if
you
delete
one
tag,
those
those
vertex
only
with
this
one
tag
were
not
deleted.
A
A
A
A
This
is
correct,
which
isn't
always
frankly,
but
we
we
do
our
best
to
just
making
data
to
sample
a
couple
of
samples
and
Trust
assume
that
every
Edge
in
in
the
graph
only
have
one
attack
and
they
are
all
consistent.
So
we
just
try
our
best
to
draw
this
schema
and
I
I
consider
this
is
actually
quite
useful
for
most
of
the
users.
A
Okay,
then,
let's
see
what's
next
okay,
this
is
the
schema
real
as
I
showed.
Another
thing
is
the
welcome
page.
So
in
a
newer
version
we
put
a
bunch
of
user
useful
information
in
in
the
welcome
page,
which
is
a
new
feature,
and
we
also
introduce
the
the
capability
of
loading
some
starting
data
sets.
A
This
is
also
open
source,
so
anyone
can
contribute
their
data
sets
here
in
our
Studio
repository.
So
now
we
have,
and-
and
now
we
have
only
two
data
sets
here-
but
personally
I
will
I'm
planning
to
put
some
more
data.
Sets
there
to
have.
No
the
fresh
users
to
you
know.
You
know,
get
familiar
with
different
typical
use
cases
and
okay
yeah.
This
is
the
data
starter.
A
A
I'm,
not
sure
this
is.
This
is
new,
a
number
of
aggregate
executors,
so
I
guess
this
is
new,
so
be
sure
to
check
out
documentation
on
the
metrics
and
the
the
documentation
of
the
dashboard
and
be
sure
to
set
up
your
own
to
see
what's
newly
added.
So
this
is
the
the
page
that
you
are
heading
to
on
the
service
like
graph
or
meta,
something
like
that
yeah
and
for
the
Explorer
Explorer
is
the
Enterprise
only
tour.
One
of
the
thing
is
the
edge
aggregation
so
like.
A
When
you
have
between
two
notes
like
in
Tableau,
you
can
have
different
ranks.
That
means
different
instances
of
the
a
pair
of
notes
that
the
relationship
between
them.
So
now
you
can
aggregate
them
like.
These
are
two
edges
you
can
put
them
into
into
one
and
some
sometimes
it's
helpful
when
you're
seeking
in
the
information
insights
from
the
Explorer
another
one
is
query:
Builder,
I'm,
I'm
sure
you
have
already
seen
oops.
A
Okay,
this.
This
could
be
a
a
query
oops!
Oh,
this
is
not.
This
is
an
underlying
relying
relying
on
the
index
that
so
it
cannot
be
varied.
Okay,
okay,
this
is
the
query
composed
by
this
drug
drag
and
drop,
which
is
kind
of
Handy
final
one.
This
is
the
iframe,
so
you
can
embed
the
whole
tour
in
in
your
internal
tooling
web
page
sum
up
to
user
required
this
the.
Finally,
this
is
the
note
to
vact
post
I.
A
A
A
So,
yes
trying
to
save
it
and
run
actually
with
the
with
this
workflow
you
can.
You
know
pipeline
different
queries
and
different
algorithms.
In
a
dagway,
for
example,
you
can
put,
you
can
add
different
output
to
an
another
algorithm.
This
is
possible
and
that's
why
we
have
this
in
interface
and
after
that,
so
the
source
of
this
algorithm
is
from
a
space
that
it
will
scan
the
data
directly
bypass
the
gravity.
It
will
scan
data
from
the
storage
device.
A
A
A
A
The
data
module
of
Naval
graph
for
Edge-
you
will
have
four
turbos
to
determine
when
one
Edge,
so
that
is
the
tab
and
the
source
and
the
target
vertex.
Sorry.
This
is
the
type
this
Source
or
hexane
destination
vertex
and
there
is
a
rank
field.
So
if
you
are
not
aware
of
rank
it's
because
it
can
be
automated,
so
by
default,
you
leave
it.
If
you
don't
provide
the
information
for
rank,
it
will
be
left
as
a
zero.
A
It
is
Support
also
with
yes
exactly
you
can
have
and,
for
example,
you
can
have
multiple
instances
of
transaction
between
when
people
and
when
you
know
when
per
when
shop.
That's
what
that's
one
possibility.
You
can
have
multiple
edges
between
two
vertex,
but
as
as
goren
mentioned,
you
can
just
have
multiple
edges
just
on
different
types.
That's
the
more
straightforward
case.
A
I
mean
same
same
yeah
for
same
as
type.
You
can
do
that
it's
you
just
introduce
the
rank
like
you
can
put
your
time
step
in
in
in
in
the
number
or
in
the
end,
and
put
this
field
in
as
a
rank
field.
You
can
do
that
and
that's
that's
something
make
nebulograph
unique
and
different
from
other
graph.
Dab
is
as
well.
A
So
about
no
two
facts:
I
I
I
failed
to
run
that
demo,
but
it
was
a
pretty
small
data
set,
but
you
can
run
pretty
large
data
sets
because
underline
is
relying
on
the
nebula
analytics.
It's
an
enabling-
and
this
is
a
proprietary
we.
We
built
it
on
another
open
source
project,
but
we
released
it
in
a
closed
Source
way
and
it
excels
in
in
the
resource
visualization.
A
As
goren
mentioned
back
to
this
topic,
if
you
insert
one
pair
of
source
and
the
target
vertex
with
certain
types,
you
didn't
specific
rank.
That
will
be
zero.
If
you
insert
it
the
second
time
it
will
overrate
of
your
first
and
and
that's
basically
because
we
don't
have
a
so-called
ID
of
our
Edge
and
we
assemble
this
ID
with
the
full
turbos.
A
B
A
Here
there
are
some
algorithm
tools
they
are.
They
are
not
the
one
in
the
open
source
version.
If
you
check
it
in
in
documentation,
you
will
see
the
graph
computation.
Where
is
the
graph
computation?
Oh
yeah,
so
you
will
see
there
is
a
nebula
L
analytics.
So
this
one
is
the
the
close.
It's
a
preparatory
another
one
project
in
in
our
community.
It's
Enterprise
only
offering,
and
that
will
you
know,
have
a
better
performance
and
resource
visualization
utilization,
comparing
to
the
Open
Source
One,
but
open
source.
A
A
Yes,
thank
you,
yes
and
let's
go
run.
Add
it
if
you
have
some
some
properties
there.
So,
yes,
exactly
the
the
second
time
of
insert
of
exactly
same
photo
post
will
rewrite
everything.
So
sometimes
it's
unexpected,
so
you
should
ensure
you
are
using
the
right
way
of
writing
data.
On
this
perspective,.
A
A
B
A
A
A
So
again,
it's
another
topics,
I
prepare!
So
it's
a
small
demo
on
how
we
can
leverage
DBT
to
make
some
graph
modeling
and
do
the
transform
missions
so
it
it
may
be
not
that
helpful
to
You
YouTube
guys,
because
this
is
more
for
the
fresh
users
on
how
they
they
their
in
their
mind,
model
to
map
the
data
from
a
tabular
module
to
a
graph
module
and
I
make
it
to
a
end-to-end
example
to
help
the
French
users
to
play
about
it.
So
the
background
of
this
topic.
A
So
this
is
actually
a
sub
project
when
I
was
writing
a
another
topic
around
how
you
can
leverage
graph
Tech
hand
graph
DB,
to
create
a
toy
level
recommendation
system,
so
I
reviewed
all
the
methods
we
can
do
together
with
GN
and
I
needed
that
set
and
in
a
graph
manner.
So
I
have
to
create
my
own.
So
then
I
I
I
decided
to
leverage
DBT,
which
is
quite
fancy
in
this
domain,
and
why
not
make
it
another
small
demo?
A
A
So
we
need
to
Define
how
we
want
to
place
those
different
information
from
different
sources
into
a
a
graph
into
a
knowledge,
and
then
we
we
need
to
define
the
schema
of
the
the
knowledge,
so
this
is
required
in
in
schema
for
grab.
That
is
right.
So
it's
quite
different
from
other
graph
databases,
which
is
a
schema
less
and
then.
Finally,
we
need
to
extract.
A
However,
we
Define
how
we
want
to
extract
it,
how
we
can
make
the
engineering
thing
we
want
to
extract
them
from
different
sources
and
finally
ingest
to
Naval
graph.
So
in
first
step
we
need
to
see
what
we
have
so
in
this
example,
I
will
release
that
article
later
on
the
recommendation
system
itself
later.
A
So
those
who
are
interested,
you
will
get
more,
have
more
ideas
on
that.
So
the
conclusion
was
I
need
to
abstract
a
grasp
information
from
two
data
sources.
One
is
called
omdb,
so
it's
a
movie
data
set
it's
a
public
open
source
kind
of
Open
Source
project,
so
there
are
some
all
the
moving
names
and
the
classification
of
the
movies
and
all
the
workers,
the
crews
of
the
different
movies,
a
lot
of
information
and
some
other
informations
like
the
covers
exactly
exactly
and
another
day
said
it's
a
moving
lens.
A
So
it
is
a
data
set
help
the
people
to
you
know.
Do
the
study
on
the
recommendation
on
how
users
select
watched
and
the
rate
different
movies.
So
it's
a
data
set
from
a
real
world
and
they
just
make
the
sensitive
information
mask
so
I
I
on
purpose.
I
combined
two
data
sites
to
you
know
demonstrate
in
our
real
world.
We
will,
you
know,
combine
different
data
sources
in
this
different
format
and
different
infrastructure
and
put
them
together
and
make
the
correlations.
A
So
this
is
a
simple
but
kind
of
simulation
to
the
real
world.
So
finally,
I
I
decided
to
leverage
four
kind
of
edges.
So
it's
it's
used
for
the
content-based
filter,
which
is
the
term
in
in
the
recommendation
system
and
the
user-based
Collective
filter.
So
there
are
two
approach.
Naive
approaches
of
the
recommendation
system,
so
they
will
together
will
require
our
knowledge
graph
on
the
user
and
the
movies
to
have
this
full
types
of
edges.
A
A
We
need
to
transform
the
data
from
different
sources
into
our
graph,
so
let's
look
into
the
the
first
data
set
called
omdb,
so
in
omdp
there
are
a
couple
of
different
table.
Think
of
they
are
just
tables,
but
they
are
formatted
in
the
CSV
files.
So
there's
our
movie
table
with
the
column
of
movie
ID,
the
name,
the
languages
and
oh,
this
is
official
translation.
So
we
don't
care
about
this.
So
basically,
you
have
a
unique
ID
towards
their
names
in
different
languages.
A
There's
an
AllCast
table
are
reflecting
between
the
movies
and
the
persons,
so
the
job
ID
is
interesting.
They
are
just
numbers,
but
if
you
look
into
job
names,
they're
reflected
to
different
job
roles,
for
example
in
English
job
id1
means
in
the
writing
Department
Etc,
so
you
can
be
a
producer
of
a
movie
if
your
job
IDs
too
and
finally,
we
have
our
people
table
or
CSV
file
are
reflecting
the
the
person
ID
just
like
here,
the
person
ID
to
its
names.
A
So
this
is
the
typical
how
data
are
persisted
in
relational
database.
They
don't
they
don't
duplicate
information
and
that's
why
we
we
sometimes
cannot
use
them.
You
know
to
actually
reflect
the
correlations.
It
will
be
a
cost
if
you
don't
duplicate
things
right,
okay,
so
I
just
show
you
four
tables
to
you
know
with
those
four
tables
information
you
can
have
a
one
type
of
Edge
type,
which
is
the
person
directed
I'm.
Sorry,
the
direction
here
is
it
isn't
right.
So
movie
will
be
directed
this
side.
A
This
direction
movie
directed
by
a
person,
and
actually
you
can
also
have
the
movie
acted
by
person
right.
So
it's
a
similar
thing
and
so
buy
this
directed
by.
So
it's
a
ash,
so
you
will
find
the
starting
notes
from
either
it's
a
movie,
ID
or
so
here
is
actually
starting
from
the
a
movie
to
a
person
and
for
the
for
the
movie
ID,
and
you
will
find
the
job
ID
you
should
you
should
filter.
A
A
You
have
the
ID
in
the
AllCast
table
and
those
names
are
in
the
all
movies.
Maybe
you
want
to
filter
the
language
as
English.
Similarly,
you
can
have
the
person
vertex
right,
so
basically,
that's
only
for
directly
buy
or
act
by,
and
we
have
a
different
like
movie
have
categorized
by
so
it's
similar
here
so
basically
I
draw
the
table
that
required
to
constrict
to
have
this
properly
property
graph
information.
We
need
table
in
this
way
and
we
we
have
those
three
types
of
Ash
edges.
A
A
A
So
so,
what's
the
problem
here,
the
problem
here
is
this
movie
ID.
There
are
mapped
to
specific
movie
in
title
in
the
movies.csv.
In
this
data
set
it's
actually.
We
need
to
correlate
it
with
all
the
the
movie
graph,
Knowledge
Graph
in
add
another
data
source,
so
they
should
be
correlated
because
you
can
directly
use
this
movie
ID.
So
this
movie
ID
should
be
mapped
in
some
way,
so
By
Nature,
you
just
map
them
with
the
title.
A
So
the
problem
here
is
in
the
in
this
data
set.
Your
every
title
has
a
quote
of
the
year
of
this
movie
and
they
they
are
all
in
English.
So
we
can
know
that
we,
if
we
want
to
link
of
the
two
data
set
in
a
certain,
join
way.
We
need
to
remove
this
cervix
and
search
from
the
the
omdb
and
the
only
for
those
English
titles
right.
So
we
need
to
do
that
to
make
the
everything
connected
so
previously,
with
the
omdb.
A
We
have
this
mapping
relationship
and
together
with
the
rating
and
the
movies,
we
are
doing
this.
So
basically
we
are
adding
the
user
from
here
to
this
graph.
But
when
it
comes
to
the
user
watched
or
read
movie,
the
movie
ID
shoot
comes
from
the
all
movies
in
the
omdb,
but
we
should
translate
this
movie
ID
with
the
title
and
with
some
Transformations
and
search
it
in
all
movies,
English
name
and
so
that
we
have
the
movie
ID
in
the
all
movies
of
the
omdb.
A
So
that's
the
thing
we
want
to
it's
quite
it's
a
simple
case,
but
quite
typical
in
our
real
world
scenarios.
So,
finally
we
want
to
afterwards
of
the
transformation.
We
will
have
some
recording
it's
still
tabular,
but
it
will
be
in
injected
to
the
graph
module
line
by
line.
So
in
every
line
you
will
have
the
user
ID
come
from
the
movie
lens,
the
rating
from
the
movie
lens,
the
title
they
should
have
in
both
movie
lens
and
omdb,
and
the
movie
ID
so
we'll
replace
States.
As
the
you
know,
omdb
movie
ID.
A
And
finally,
we
have
this
user
watched
movie
with
the
rating
as
the
property
in
this
Edge
right,
and
it
should
be
something
like
this
right.
User
watch,
the
movie
and
everything
was
connected
with
the
tabular
data
in
in
this
colored
lines,
and
we
have
the
directed
acted
and
with
a
girl
or
cat
with
the
category.
A
A
A
Exactly
you
can
see
this
at
rank
in
in
the
insert
clause
in
the
insert
query.
This
is
optional.
If
you
automate
this
field,
it
will
be,
but
it
will
be
persisted
as
at
zero,
so
run
with
zero.
So
if
you
don't
care
about
this
capability,
it's
it,
it's
not
a
curse.
It's
just
a
gift.
You
can
ignore
it,
but
when
you
need
it,
you
just
basically
add,
for
example,
add
to
yes.
A
It's
a
nebula
native
concept,
actually
yeah
in
in
Cipher
World.
There
is
no
such
thing.
It's
something
unique
in
nebula,
because
the
you
know
the
background
of
the
team
that
comes
from
the
end
Financial
end,
so
they're
they're
used
to
working
on
things
around
the
alipay.
So
in
their
use
cases
they
have
this
requirements,
so
they
bring
this
into
this
module.
Yes,
so.
A
Exactly
and
we
are
continually
optimized
amazing
that
and
for
example,
in
this
in
this
cycle,
we
did
a
bunch
of
optimizations
on
that
because
the
you
know
the
cipher
is
writing
a
cipher
pattern
is
easier
for
users,
but
a
lot
of
constraints
were
not
actually
applied.
You
didn't
precisely
tell
how
the
you
know.
The
query
was
done
like
the
native
ngql,
so
we
need
to
did
to.
A
We
are
trying
to
make
it
closer
in
the
performance
comparing
with
the
native
queries,
because
in
Native
queries
you
will
actually
do
every
step
precisely
just
like
that,
but
the
the
drawback
is
a
if
you
write
it
in
the
in
this
way.
It's
not
that
flexible
to
write
some
multiple
Direction
patterns,
so
we
have
to
do
trade-offs
when
we,
but
generally,
if
possible.
A
B
A
A
Of
course
you
can
do
it
in
any
handy
tools
you
are
using,
but
this
time
I
I
just
want
to
try
DBT,
because
it's
it's
really
interesting
to
me.
So
it's
it's
just
a
opinionated
way
to
do
so.
I
just
use
the
DVT.
You
don't
have
to
use
it.
You
can
use
everything,
that's
fitting
your
requirements,
so
basically
I'm
using
DBT
to
do
this
transformation
in
this
step.
A
Just
like
I'm
mentioned
in
that
diagram
and
then
I
will
output
the
data
into
CSV
and
finally
use
the
Importer
to
ingest
it
to
Naval
graph.
So
in
DBT
it
is
a
tour
to
open
source
tool
just
to
help
you
do
the
only
do
the
transformation
in
the
ETL
Pipeline
and
it's
assuming
that
you
are
putting
your
data
in
in
one
data
warehouse.
Of
course
you
can
extract
data
from
different
sources,
but
finally,
you
will
do
this
transformation
in
one
single
data
warehouse.
A
A
Everything
was
actually
already
composed
in
my
blog
post,
so
you
can,
you
can
know
more
details
and
all
the
codes
are
also
open
sourced,
but
I
want
to
quickly
show
you
a
walk
through
a
demo,
so
you
have
to
ideally
in
short
time
to
have
more
ideas.
So
first
I
set
up
everything
in
my
server
and
DBT
is
actually
a
one
package
written
in
Python,
so
I
create
a
virtual
environment
and
install
it
with
the
paper.
It's
a
it's.
A
package
manager
in
Python
and
I
installed
the
DBT
hyphen
postgres.
A
So
this
is
a
plugin
that,
when
DBT
is
doing
the
transform
is
leveraging
the
postgres
as
the
data
warehouse.
So
it
will
help
us
install
the
the
main
package
as
dependency
of
so
one
package.
Here
is
enough
and
then
I
a
initialize,
a
project
of
DBT.
So
it's
a
project,
so
DBT
is
a
a
whole
mind.
Module
of
how
you
want
to
make
your
transformation
in
the
modern
engineering
way
and
all
of
the
meta
data
you
want
to
describe
this
transformation
are
file
based.
So
you
can
do
the
git
Ops
of
the
this
data.
A
So
when
I
initialize
this
project,
I
will
have
a
couple
of
dummy
files
in
this
folder,
so
you
can
see
so
DVD
have
its
own
infrastructure
to
help
you
set
up
the
module
in
the
web
documentation
way.
So
you
all
those
information-
can
be
presented
some
way
by
others.
So
you
can
see
it
in
a
in
a
quite
more
than
offensive
way.
So
you,
of
course
you
can
describe
it
in
readme.markdown
and
The
Meta
or
index
or
entry
of
the
project
is
the
project
yaml
file.
A
So
you
can
describe
things
and
everything
else
will
be
described
and
mentioned
in
this
file.
For
example,
the
module,
which
is
the
core
concept
of
the
DBT,
transform
module.
So
module
refers
to
how
you
want
to
do
certain
transforms
on
certain
data
sources
is,
and
you
want
to
Output
it
somewhere
else
in
this
transformation
and
on
a
specific
transformation
rules.
A
How
they're
mapped
they
can
all
be
described
by
SQL
right
and
they
are
actually
just
the
joints,
and
you
know
some
functions
manipulations
so
later,
I
will
show
you
how
and
this
yamo
under
this
module,
5
instance
of
the
folders
are,
you
know,
described
the
columns
and
those
Circle
files
are
describing
how
you
want
to
do
the
transforms
and
there
are
tests
and
something
else
if
you're
interested
just
try
it
so
I'm
not
going
to
delve
into
all
details.
So
then
we
have
this
DBT
project.
A
Then
we
set
up
the
environment
for
the
our
experiments.
So
if
you
don't
already
have
some
equivalencing
on
data
worm
or
you
just
you
don't
want
to
make
things
dirty.
You
can
just
let
let
me
make
a
ad
hoc
data
warehouse
so
I
add
this
half
and
half
a
RM.
So
this
means,
when
you
stop
this
instance,
everything
will
be
wiped
and
I
didn't
map
any
data
volumes
inside.
So
that
means
all
everything
will
be
wiped.
Nothing
left.
A
A
It's
not
a
form
existing
name
in
in
the
DBT
I
just
created
and
later
you
can
see
how
it's
invoked
and
I
downloaded
the
file
from
the
omdb
or
and
the
movie
lens
data
says
official
websites
and
I
did
some
data
wrangling
to
pre-precise
some
specific,
like
escaping
characters,
and
some
words
just
copied,
as
is
so
the
destination
of
the
file
was
in
under
the
seed,
so
see,
there's
something
defined
already
in
DBT.
It
means
if
you,
your
data
sources,
are
CSV.
A
You
can
put
them
under
the
Seas
for
directory,
and
you
see
it's
a
concept
in
DBT
to
help
you
to.
You
know
inject
the
CSV
data
sources
and
afterwards
you
just
run
the
dvtc.
It
will
help
you
inject
everything
there.
So
I
have
actually
I
have
environment
here.
So
this
afternoon,
I
put
a
things
under
the
seed
and
then
I
run
the
dbtc.
A
It
will
take
some
time
because
I'm
using
a
single
machine
postgres
so
to
insert
everything
and
afterwards
you
can
see
all
of
the
raw
data
were
already
in
our
Warehouse.
It's
just
a
postgres
and
you
can
see
all
the
tables
are
are
already
there.
For
example,
the
all
casts
so
yeah
you,
you
can
see,
you
don't
have
to
Define
any
schema
and
everything
is
just
injected
with
quite
sweet
right.
A
A
Actually,
so
it's
more
juice,
so
everyone
is
reflected
to
one
relationship
for
this
is
a
user
watch
the
movie,
and
so
what?
What
is
doing
is
you
just
as
I
do
remember
the
the
the
diagram
I
just
joined,
select
and
join
things?
I
select
the
ratings
user
ID
and
movie
ID
from
the
rating
CSV.
So
this
is
a
movie
lens,
ratings.csv
and
I.
A
Also
yeah
I
I
select
the
title
with
the
movie
lens
movies
right,
the
the
relationship
comes
from
the
ratings
underscore
reading
CSV,
so
the
name
the
title
from
comes
from
the
movies,
with
the
movie
ID
and
I
removed
the
you
know
the
surface
of
the
year
in
the
quote
in
the
end
right
and
then
I
have
the
user
watched
movie
with
the
movie
name
and
then
I
need
to
trans
translate
this
movie
name
into
the
omdb
movie
ID.
So
then
I
continue
doing
this
another
drawing
towards
the
all
movie
CSV.
A
So
this
comes
from
the
omdb
right
I'm
doing
this
join
on
the
title,
with
all
movie
name
with
a
like
clause
and
the
filter,
those
names
in
English.
So
then
finally,
I
will
have
a
user
watched
movie.
So
if
you
see
I'm
using
this
client
to
so
it
will
be
mapped
to
user
watch,
the
movie
so
yeah.
This
is
the
final
one
and
you
can
see
this
is
the
result
and
I
didn't
write
this
properly
in
one
go.
A
And
after
you
connected
this,
you
can
you
can
for
sure
you
can
disconnect
yes
disconnect
and
connect
right
after
that,
you
can,
for
example,
I
will
show
you
another
one
movies
or
waste
category.
So
you
actually
writing
the
the
queries
here
and
you
can
join
it
at
any
time.
For
example,
I
can
add
a
limit
eight
and
collect
the
run
on
acting
connections,
so
it
will
help
you.
A
You
know,
run
this
query
so
then
you
know
your
query
is
valid
and
then
you
can
continue
write
another
one
and
after
you
finish
them,
you
can
call
them
by.
Oh.
This
is
sorry
I
didn't
mention.
This
is
the
there
is
a
schema
yaml
inside
this
module
right,
for
example,
this
user
watches
movies.
You
will
describe
the
meta
data
of
this
transformation
rules.
There
are
three
columns
and
that
there
are
even
test
Fields.
So
this
test
is
related
to
the
another
capability
of
of
DBT.
A
You
can
run
DBT
tests
to
ensure
your
different
kind
of
constraints.
Can
you
know
you
can
ensure
your
quality
of
your
data
in
in
a
controlled
way?
So
if
you
are
interested
in
just
diving
into
the
documentation,
so
with
with
this
module
being
said,
you
can
then
trigger
a
transformation
with
DBT.
So
now,
for
example,
that
one
user
watched
the
movie
are
reflected
here.
The
circled
part
right
as
I
mentioned,
then
you
can
run
this
with
the
name
of
this
circle
to
trigger
this.
A
A
Yes,
it's
back
again
and
the
the
data
can
be
previous
preview
as
well.
You
can
dislike
the
source,
ID
is
the
movie
ID
and
the
destination
ID
is
the
category
ID
like
I?
Also
have
this
one?
It's
reflecting
which
category
ID
are
in
certain
category
musical
right.
So
let's
continue
so
till
now.
You
have
every
transformation
ready
and
the
the
transformed
data
are
in
a
table,
tabular
format
in
in
your
postgres.
A
Then
you
can
make
it
reflected
to
the
naval
graph,
the
DML
query
right
and
we
can
leverage
different
tools
like
in
nebula
exchange.
You
can
do
the
postgres
connecting
to
never
graph
directly.
There
are
a
bunch
of
different
ways,
but
in
this
example,
I
just
make
things
simple,
because
we
don't
have
a
large
scale
data,
it's
just
export
it
to
CSV
and
then
finally,
I'm
using
another
graph
importer
importer
is
the
most
lightweight
injection
tool.
It's
just
a
single
file,
binary
written
in
Golan.
A
You
just
specify
where
you
want
to
you
want
with
the
configuration
file
you
just
let
the
it
know
how
you
want
to
map
your
CSV
files
towards
your
graph
Vertex
or
a
Vertex
type,
which
is
tag
or
the
edge
tab.
So,
for
example,
the
the
people.csv
I'm
going
to
map
it
to
a
Vertex
or
tag.
So
we
can
see
what
what
we
got
in
in
the
actually
in
actually
here
after
we
copy
sorry
I
have
to
recopy
it
to
the
files
we
we
we
move.
A
A
A
This
is
a
containerized
importer
and
consuming
this
importer
configuration
file
in
yaml,
you
will
have
everything
injecting
in
Naval
graph
and
yeah.
This
is
a
example
in
I
want
to
know
why
we
will
recommend
this
movie
to
user
one
for
one
to
four,
so
we
just
do
a
fine
pass.
You
will
know
all
this
is
the
path
with
most
reason,
reasoning,
possibilities
because
it
could
be
most
of
the
cast
and
crew
of
the
ones
favorite.
A
A
So
it's
just
a
simple
naive
example,
but
afterwards
you
will
have
a
whole
user
and
movie
knowledge
graph
with
this
process,
and
so
everything
was
done
by
in
this
way
and
in
this
fashion,
so
we
just
with
DBT
seed.
We
make
the
CSV
files
from
different
sources
into
our
data
warehouse
and
with
the
DBT
we
defined
our
mapping
rows
in
SQL,
we
tested
it
and
it
works,
and
then
we
use
DBT
run
to
run
this
trans
transform
and
afterwards
you
will
generate
new
tables
hosting
those
data
you
want
to.
A
A
And
that's
I
think
that's
all
from
today,
so
thank
you,
everyone
and
feel
free
to.
Let
us
know
if
you
have
any
questions
about
today's
topic
and
check
out
our
stack,
Channel
and
GitHub
repositories.
If
you
want,
you
want
to
discuss,
discuss
anything
about
graph
and
nebulograph,
go
to
our
discussion
forums
in
GitHub
or
our
stack
channel.
So
thank
you.