►
From YouTube: I O Profiling on Perlmutter with Darshan
Description
Part of the Data Day 2022 October 26-27, 2022
Please see https://www.nersc.gov/users/training/data-day/data-day-2022/ for the training agenda and presentation slides.
A
A
All
right,
okay,
so
starting
with
the
with
a
bird's
eye
view.
So
when
you
do
when
you
start
with
the,
when
you
start
doing
some
IO,
for
example,
at
pandas,
with
CSV
you're
trying
to
access
your
data
that
sits
on
a
specific
price
system,
but
in
in
a
way
there
is
a
long.
I
o
stack,
that
is
in
between
your
data
and
your
application.
A
There
are
also
io4
wording
systems,
the
unner
excuses,
for
example,
we
create
DBS
on
Corey
and
finally,
the
the
hardware
is
a
before
just
before
hitting
the
hardware.
There
are
parallel
file
system
like
cluster
gpfs.
That
adds
some
kind
of
logic
to
your
to
your
data
sitting
on
the
Discord
or
a
flash
drive,
for
example
like
p-scratch.
A
So
when
analyzing
IO,
there
are
several
questions
that
you
can.
You
can
ask
yourself
so
how
many
processes
are
actually
trying
to
access
my
data,
how
many
files
is
my
application
trying
to
open
or
read,
write
at
the
same
time?
How
big
are
these
files?
What
kind
of
frequency
of
access
do
we
have
to
these
files?
Are
we
reading
them
like?
Are
we
continuously
reading
them?
Are
we
reading
them?
First,
at
the
beginning
of
our
application?
A
How
much
are
we
reading
out
of
this?
These
files?
Are
we
doing
read,
write
metadata,
but
also
a
question
that
we
can
ask
ourselves
they're?
Also
you
can
you
can
trying
to
be
as
as
close
to
the
other
as
you
as
you
can,
because
sometimes
you
also
need
to
do
some.
However,
you
need
to
need
to
take
into
account
also
the
auger.
That
is,
that
your
data
is
sitting
on
so,
for
example,
on
a
hard
disk.
A
I
need
to
consider
that
doing
contiguous,
IO
So
reading
chunks
of
data,
one
following
the
other-
can
be
really
beneficial
for
your
application
compared
to
non-contiguous
IO,
where
you
read
chunks
related
are
sparse
on
several
disks,
maybe
or
even
within
the
same
disk.
There
are
Parts
within
different
sectors,
so
these
kind
of
thinking
is
maybe
not
so
not
so
useful
anymore.
With
things
like
a
pea
scratch,
the
format
of
scratch,
which
is
probably
the
first
Parliament
flight
system,
built
out
of
flash
drive.
A
A
It
is
currently
loaded
by
default,
a
nurse
for
old
users,
so
every
user
and
nurse
that
either
own
Corey
or
promoter
is
is
we
will
find
darshan
among
their
standard
or
default
modules.
So
if
you
do
a
module
available
and
you
look
for
darshan,
you're
gonna
find
several
modules.
The
the
full
one
is
going
to
be
3.4.0
yeah.
A
A
Dynamic
libraries
collection,
so
that
may
cause
problems,
for
example,
if
you're
using
an
older
hd5.
Maybe
nowadays
it's
not
so
common
anymore,
but
if
you
use
a
h351.0
ASR
1.8
that
could
the
coast
problem,
because
the
the
hdf5
that
we
use
at
nerds
is
hd5
is
a
using
a
different
API
set.
So
it's
a
using
1.10
or
above
so,
if
you're,
using
an
older
hd5
that
could
cause
problems
or
if
using
NPI,
Library
different
on
create
the
Ukraine
API,
which
is
built
on
top
of
on
top
of
that
pitch.
That
could
also
cause
problems.
A
A
So
all
your
calls
are
recorded,
there's
no
sampling,
so
your
application
will
that
natural
will
intercept
any
any
IO
code
that
your
application
does
will
not.
We
will
not
just
sample
the
application,
every
I
don't
know
every
every
year
we
don't
know
specific
period
or
anything
like
that.
So
your
every
cool
is
going
to
be
recorded
by
darshan
and
yeah.
You
can.
A
Your
application
may
be
issuing
IO
calls
from
a
very
high
level,
IO
Library,
such
as
an
XTF,
which
then
translates
into
hd5
calls
mpio
politics
and
possibly
luster
if
you're
doing
a
your
own
scratch.
So
there
are
several
layers
involved
in
a
when
doing:
IO
darshan
should
be
able
to
detect
or
Trace
all
these
calls
and
yeah.
So
log
files
can
get
very
large
depending
on
the
number
of
processes
the
ideal
patterns
used.
A
C
A
Create
the
the
final
is
sorry,
the
dash
and
load
file,
but
in
order
to
do
so,
the
application
needs
to
have
Direction
injector
either
a
compile
time
or
it
has
to
be
manually
loaded
at
runtime
in
order
to
profile
IO.
So
how
can
you
get
your
application
to
have
darshan
injected
into?
How
can
you
can
you
inject
your
application?
Sorry
Dash
into
your
application.
So
if
you're
a
nurse
you
can
use
the
create
compiler
wrappers.
A
Just
a
hint
Main
in
C
and
I
run
grep
on
the
on
the
final
on
the
final
executable
and
within
the
the
dynamic
libraries
that
we
find
the
executable
contains.
There
is
also
a
live
darshan,
which
is
the
the
elaborate
induction
forward.
Direction
is
contained
at
which
we'll
perform
the
tracing
of
your
IO,
so
only
MPI
applications
will
trigger
trigger
the
tracing
mechanism.
So
that's
because
dachshund
overwrites,
the
MPI
it
needs
an
MPI
finalized
calls.
So
anytime
your
application
enters
an
MPI
in
it.
Darshan
will
start
tracing.
A
You
start
the
recording
of
your
IO
and
as
soon
as
you
hit
the
MPI
finalize
at
the
end
of
your
application,
the
production
Library
will
will
trigger
and
will
create
the
darshan
log
file
in
the
default
directory
that
we'll
see
in
a
minute.
So
this
means
that
only
applications
are
called
MPI.
Finalized
will
produce
a
dash
along
file
by
default,
but
you
can
also
use
darshan
for
non-empi
applications
and
the
command
here
is
a
here
to
show
you
the
how
to
do
that.
A
So
you
need
to
set
a
variable,
that's
an
enable
no
API
one,
and
then
you
also
need
to
prepend
your
application.
Sorry,
the
Elite
action
library
inside
LD
preload
before
your
application.
So
just
a
warning
do
not
export
darshan
in
LD
preload.
So
do
not
add
these
variables
at
the
beginning
of
your
JavaScript,
otherwise
you'll
Trace
any
application
that
is
dynamically
linked,
so
such
as
LS,
and
you
may
not
want
that
because
that
impacts
your
your
application
and
also
other
users
applications.
A
So
that's
why
I
show
the
command
here,
for
example,
for
a
python
application,
so
just
set
the
variables
before
your
application
runs
and-
and
you
should
you
should
be
good.
So
if
you
see
any
mkr
error
with
non-empi
executables,
it
may
mean
that
darshan
is,
is
somehow
starting
trying
to
to
load
MPI
with
your
application.
So
in
the
case
we
suggest
you
rebuild
the
Russian,
your
own
darshan
and
pass
the
without
NPI
flag
at
the
configure
time.
A
A
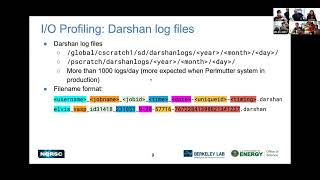
quick
point
about
the
the
Russian
log
files,
so
on
Corey
they
are
stored
in
in
the
first
path,
Global
C
stretch
and
then
the
Sherlock's
another
they're
stored
by
year,
month
and
day
and
similarly
on
p
on
pscratch
on
premium
scratch,
there's
certain
logs
and
then
year
month,
and
they
right
now
we
are
seeing
more
than
a
thousand
logs
per
day
being
produced.
But
more
are
expected
to
to
appear
when
per
month
is
we
will
enter
the
production
stage?
A
So,
as
a
here,
for
example,
is
a
an
example
of
the
format
of
the
induction
log
files.
So
you'll
have
your
username
job
name,
job
ID,
if
you,
even
if
you
were
running
your
job
inside
a
as
learn
summation
a
certain
job,
the
time
the
date,
the
unique
ID
and
also
another
timing
flag,
so
every
file
should
be
basically
unique,
so
moving
on.
So
how
do
we
use?
How
do
we
actually
see
what
our
what
our
application
is
doing?
A
A
This
also
takes
production
job
file
as
input.
This
requires
the
text
live
package.
Currently
this
is
only
available
on
query
so,
but
I'm
planning
on
creating
a
shifter
container
to
run
to
two,
so
we'll
have
a
latex
inside,
so
you
won't
need
to
load
any
module
and
you
will
be
able
to
to
call
Russian
job
summary
from
your
from
any
system
and
also
your
bonuses
and
your
own
laptop,
for
example,
without
having
to
build
latex
or
anything
like
that.
Is
there
a
time
to
put
they
click
on
promoter.
A
Make
life
easier
for
users
and
for
containers
as
well
and
so,
and
this
Commander
will
create
a
PDF
Report
with
a
useful.
I
o
plots
or
will
also
summarize
stats
by
file
or
by
category,
for
example,
and
then
we'll
see
more
events,
plotting
and
Analysis
tools
with
DST,
Explorer
and
rifty
now
Luca
will
will
show
us
in
the
next
talk.
A
Finally,
a
new
addition
to
the
darshan
ecosystem
is
hideaction,
which
comes
with
the
dash
on
3..
4.0
can
be
installed
with
a
pip
install
and
you
can
use
this
to
as
a
show.
Here
with
the
example.
You
can
use
this
to
extract
information
from
your
Premier
Edition
log
file
from
from
python.
So
this
is
useful,
especially
if
you're,
if
you
want
to
trip
another
way,
analyze
lots
of
files
or
you
want
to
build
them
to
kind
of
interface
to
your
industrial
log.
A
A
So
if
you
run
into
that,
just
run
Dash
and
convert,
which
is
part
of
the
Direction
utilities
that
are
inside
the
industrial
model
file
randashia
convert
on
the
on
your
input
file
create
a
separate
converter
file
that
would
be
compliant
with
the
new
Dash
unlock
file
format
whatever
and
just
use
that
as
input
for
pi,
duction
or
other
other
attitudes
and
yeah.
So
we
should
be
good.
A
D
C
A
C
E
A
A
A
A
question
from
the
audience
yeah
follow
up
on
Stephen's
question:
can
you
profile
MPI
enabled
right
sure
yeah?
So
we
do
it
the
same
way,
except
with
out
the
first
MP.
Oh,
no
API
flag
being
zero,
so
it
depends
where,
if
your
application,
somehow
triggers
darshan
in
any
way,
because
a
python
code
obviously
doesn't
doesn't,
is
not
like
instrumental
with
darshan
direct,
it's
a
text
file
so
and
oh
probably,
your
python
executable
would
come
from
whatever
conda
or
so
that's
not
going
to
be
instrumental
with
darshan.
A
So
you
may
need
to
manually
enable
darshan.
Maybe
maybe
you
just
don't
need
to
set
the
non-mpi
flag?
You
just
need
to
maybe
pre-load
the
same
things
that
would
have
the
first
one
or
setting
it
to
zero,
or
we
have
the
first
one
yeah.
Okay,
maybe
preload
induction
in
LD
products
should
be
enough.
Okay,
good
question,
yeah
I
haven't
tried,
NPI,
enabled
API.
A
All
right
so
right
now
I'm
on
Corey,
because,
as
I
said,
the
the
we're
missing
the
Atlantic
package
in
on
the
promoter,
but
yeah,
hopefully
that
with
the
containment
that
should
be
not
a
problem
anymore.
So
I'm
gonna
show
things
here
on
Corey,
but
the
same
should
apply
to
permutter.
So
the
as
I
said,
the
the
directional
log
files
are
stored
in
a
in
a
folder
on
your
Corey
scratch,
so
obviously
scratch
National
logs,
and
then
you
can
Browse
by
year
month.
A
Let's
search
for
October
and
right
now,
I'm
gonna,
search
on
all
directories
that
are
part
of
October
and
I'm
gonna
search
for
my
own
username.
So
as
I
showed
the
Dutch
log
files
start
with
a
your
username
first,
so
they
use
this
command.
You
should
be
able
to
get
a
list
of
files
that
are
that
you
created
willingly
or
unwillingly,
and
for
example,
here
there
are
some
files
that
I
created
over
the
over
the
last
month.
A
So
if
we
take
this
file
here,
this
is
an
ioi
run.
Ior
is
a
is
a
tool
that
produces
I
o
artificially,
so
it
only
does
for
you.
There
is
no
size
in
there
and
but
I
know
that
these
kind
of
tools
that
I
know
that
ior
is
able
to
you
know,
produces
a
lot
of
videos,
so
that
could
be
a
that
should
be
a
useful
example.
A
C
A
And
then
I
passed
the
log
file
here
fight
this
into
the
glass.
This
is
what
the
the
output
of
darshan
part
in
parser
looks
like.
So
here
you
have
the
the
executable
that
produces
these
that
produces
these
natural
log
file.
So
this
was
a
ior
executable
that
was
doing
politics,
for
example,
as
I
said,
ior
is
a
tool
that
artificially
does
IO,
so
you
can,
you
can
program
it
to
to
just
do
IO,
and
so
these
are
these.
A
It's
fake,
some
useful
information,
like
the
user
ID
the
number
of
processes
that
we're
running
this,
this
job,
this
job
ID.
So
when
inside
a
storm
this
this
code
running
and
other
useful
information,
and
then,
if
you
scroll
down,
you
see
list
of
amount
points
that
were
loaded
at
a
time
and
then,
finally,
here
we
see
a
description
of
the
columns
and
the
first
block
of
data.
So
this
is
all
six
data,
so
the
posix
layer.
There
are
several
counters
that
were
stored
or
traced
by
darshan.
A
So,
for
example,
you
can
see
the
there
are
counters
that
count.
The
number
of
operations
that
were
executed
so
read
write
and
then
what
kind
of
metadata
operations
and
then
all
these
calendars
are
very
available.
And
finally,
here
you
can
see
so
this
is
a
single
line.
It
is
a
politics
generated
from
the
ranked
number
zero.
This
is
a
record
ready
of
the
primary
I.
Don't
remember
if
this
is
the
operation,
it's
a
batch
of
okay,
it's
an
Azure.
The
file
thanks.
This
is
the
counter
there
was
a
recorded.
A
Is
how
many,
how
many
of
these
counter
operations
were
called
so
one
opening
of
this
file?
This
is
the
actual
file
name
that
was
recorded,
so
this
was
running
on
on
my
C
scratch
directory
and
was
generating
this
file,
the
mount
Point,
obviously
scratch
and
the
file
system
type.
So,
as
you
can
see,
there
are
lots
of
available
information
here,
for
example,
I
was
doing
320
ride
operations
to
this
file
in
Australian,
26,
C
corporations,
one
start
operation,
Etc
et
cetera
and
then
scrolling
down
you
can
also.
A
All
right
yeah,
so
here
after
the
oh,
the
results
from
luster
data
cluster
stats
here,
because
we
were
using
C
scratch,
so
you
can
see
the
the
ID
of
the
oh,
which
OSD
was
this
file
writing
to.
So
it
was
running
to
OSD
with
Edina
number
two
34
times
yeah
and
then
moving
on.
There
is
also
the
sdio
data
and
again
this
is
the
rank.
That
was
writing
this
in
Azure
file.
Number
of
timing
was
open,
Etc,
so
yeah.
This
should
be
the
the
end
of
this
version.
Part
set
lock.
A
So
if
we
know
if
I
now
switch
to
my
own
to
my
laptop
I
can
retrieve
this
file,
I
should
retrieve
this
file
with
the
current
trade.
With
this
file
with
a
r
sync,
oops
yep,
so
I
run
our
sync
to
query:
to
get
this
file
from
this
empty
directory
that
I
just
created
and
copied
this
file
to
make
local
disk
yeah
show
me
here.
So
if
we
now
open
this
I
am
going
to
here.
A
Sure,
okay,
so
here's
the
PDF
report
that
was
produced
starting
from
the
reduction
of
file
that
we
were
looking
for
and
can
help.
These
will
not
visualize
some
of
the
stuff
that
we
were
seeing
as
single
traces.
So,
as
you
can
see,
the
application
here
was
doing
both
posix
and
sdio.
So,
as
we
said,
there
are
several
layers
that
every
iocone
spans,
and
so
we
can
see
you
can
see
how
many,
how
much
you
read
how
much
right
it
was
doing,
how
much
metadata
and
how
much
of
the
rest
was
Computing.
A
A
B
Just
for
those
who
entered
before
I,
introduce
myself
I'm
with
the
scientific
data,
Division
and
I'll
share
a
couple
of
tools
that
we
have
been
developing
in
order
to
close
some
of
the
gaps
that
we
have
between
those
metrics
that
we
have
on
the
system.
So
it
actually
do
provide
us
with
a
lot
of
metrics
a
lot
of
counters.
But
what
do
we
do
from
that?
So
what
can
we
extract?
B
How
can
we
interpret
those
products
and
how
can
we
turn
the
information
that
darshan
is
providing
us
into
meaningful
actions
so
that
our
applications
can
actually
run
faster?
So
one
of
those
tools
is
called
DHC
Explorer
before
talking
about
it.
Let's
go
to
the
next
slide,
please.
So,
as
Alberto
mentioned,
darshan
is
to
to
collect
profile
information,
essentially
so
profiling.
It
means
it's
going
to
aggregate
information
that
is
going
to
be
presented
to
you.
It's
not
like
a
tracing.
It.
E
B
Capture
everything
that's
going
on
in
the
execution
and
you
can
have
those
sort
of
static
reports
that
you
solve
or
to
share
before
there's
also
another
way
of
using
darshan.
If
you
want
to
go
a
little
bit
deeper
in
trying
to
understand
what
keys
your,
what
is
that
your
application
is
doing,
and
if
it's
actually
doing
what
you
expect
it
is
doing
so
you
can
use
the
extreme
extended
Trace
module
which
is
going
to
make
darshan.
Thank
you
actually
behave
as
a
tracer,
so
it
will
indeed
collect
all
the
information.
B
All
the
bio
calls
in
both
posix
and
mpio
layers.
So
it's
not
going
to
collect
things
coming
from
stdio
or
regular
input
or
standard
input
or
output,
but
it
will
provide
a
fine-grained
view
of
the
io
Behavior,
including
information
about
rank
the
segment.
That
means
the
number
of
operation
the
offset.
What
is
the
request
size
and,
most
importantly,
the
start
and
end
time
step
of
each.
B
B
You
can
use
the
same
set
of
tools
that
are
going
to
show
to
like
darshan
parser
2
parse,
the
dxt
traces,
but
instead
of
just
the
actual
parser,
it
starts
from
txt
parser
and
you
get
something
quite
similar
we
which
in
this
case
it's
just
a
sample
which,
by
the
way,
wasn't
collected
on
on
Corey.
But
it's
still
the
same
approach.
It
will
show
you
what
module.
So
it's
coming
from
posix
it's
coming
from
mpio.
If
you
have
both
it
will
both
show
up
there.
B
You
can
see
the
ranks
you
can
see
what
type
of
operation,
so
it
only
captures
reads
and
writes,
won't
be
able
to
see
or
extinguish
if
it's
a
metadata
or
if
it's
something
else,
and
you
have
the
offset
length
and
start
and
end
times
for
some
systems
like
Corey
when
we
have
Lester
or
amateur
you'll,
be
able
to
see
also
the
OST
from
which
that
updated
operation
was
destined
to.
So
you
can
have
a
better
view
of
the
load
balance
coming
going
to
those
specific
data
servers.
B
So
the
problem
is,
we
do
have
as
a
tracer
tool
and
as
like
any
other
Tracer
tool.
You
get
a
lot
of
data
coming
from
from
every
approach,
especially
if
your
application
is
generating
a
lot
of
files
or
making
a
lot
of
small
requests.
It
will
Trace
every
single
call,
and
we
know
that
static
and
glacializing
that
you
won't
be
able
to
capture
all
the
caveats
and
all.
B
That
your
application
might
be
going
through,
so
we
created
a
different
tool
which
is
called
the
dxt
Explorer,
and
we
want
to
be
able
to
start
zoom
in
and
zoom
out
into
subsets
of
ranks
or
into
a
specific
time
and
also
get
all
the
contextual
information
for
all
the
calls
that
are
happening
there.
Focusing
on
different
aspects
such
as
operation,
sizes
or
specialty
specialty
for
those
who
are
not
familiar
with
the
terminology,
refers
to
how
the
access
are
spread
into
the
file
so
which
offsets
are
we
accessing
things
continually
randomly?
B
B
Here
we
have
two
blocks:
the
top
of
the
top
lock
the
space
information
about
the
mpio
interface
and
how
that
is
converted
into
the
posix
calls
that
bridge
the
file
system
for
each
one
of
the
ranks.
In
this
case
those
are
just
operations.
You
can
see
stagglers
those
red
lines
on
the
posix
calls
they
are
making
the
entire
Collective
operations
take
longer,
which
you
normally
wouldn't
visualize,
that
on
a
regular
Direction
Trace
and
how
the
application
is.
B
Operation,
we
can
also
visualize
getting
context
for
information,
so
everything
that
we
see
on
the
dxt
log,
including
the
rank,
offset
the
OST
index
and
the
type
of
operation.
You
can
go
over
any
points
in
the
plot
and
you
get
that
information
as
well
or
you
can
have
different
visualizations
like
transfer
size
and
they
are
all
interactive
plots.
So
you
can
see
in
this
particular
case
where
metadata
operations
are
happening.
B
C
B
If
you
have
application
that
is
running
for
a
long
time
and
you
probably
won't
be
able
to
visualize
everything,
you
can
substance
and
say:
oh
I
just
want
to
visualize
the
first
half
an
hour
of
application,
the
first
10
minutes
or
the
last
10
minutes
or
just
a
subset
of
ranks
that
I
know
will
be
doing
most
of
the
I
o
in
my
application.
You
can
subset
that
and
generate
the
things
you
need,
so
you
can
install
a
DX
Explorer
locally
using.
C
B
Or
you
can
use
on
any
nervous
system
that
ships
your
image
that
we've
prepared.
So
here
is
the
syntax.
We
already
updated
the
nurse
documentation
page
to
account
for
this
information,
so
you
feel
free
to
explore.
Essentially
you've
just
been
called
shifter
and
pass
the
image
which
is
a
Docker
image.
So
we
also
have
the
docker
image
in
case
you
want
to
use
local
VMS,
download.
B
You're
going
to
provide
the
darshan
file
from
your
application,
remembering
that
you
should
have
a
dxt
flag,
enabled
in
the
environment
while
running
the
application,
so
that
you
actually
get
those
traces
I
won't
go
over
into
this
Hands-On,
but
I
want
to
make
sure
that
you
can
give
it
a
try
later
on,
and
if
you
have
any
questions
or
run
into
any
issues
field,
please
feel
free
to
reach.
Us
I've
prepared
a
couple
of
sample
logs
from
a
different
different
applications.
B
C
B
Only
thing
I
wanted,
but
I
share
the
link
on
on
the
chat
for
you,
it's
a
page
that
we
prepared
for
a
paper
that
discusses
some
use
cases
with
the
txt
Explorer
and
it
contains
some
interactive
visualizations.
You
can
open
on
your
browser,
so
they're,
essentially
what
we
were
going
to
do
in
the
end
zone
but
feel
free
to
open
and
explore
those
just
remember
that
since
it's
a
web
hosting
locally
and
the
visualizations
are
quite
large,
but
it's
going
to
take
some
time
for
it
to
render
on
a
browser.
That's
expected.
B
B
Let
me
go
for
the
other
two.
So
one
thing
is
to
visualize
and
then
again
that's
the
same
problem.
We
do
get
a
better
overview
of
what
the
hell
the
application
is
doing.
Is
it
doing
what
we
expected
or
not,
but
then
what
should
I
do
I
mean
as
an
end
user.
What
can
I
do
to
fix
my
application
so
into
that
idea?
We've
been
working
on
a
separate
tool
which
is
called
race
two
and
it's
its
main
ideas
should
get
a
regular
Direction
file.
B
So
we
sort
of
make
that
a
little
bit
more
automatic
and
we
want
to
be
able
so
to
detect
to
the
root
causes
of
the
bottlenecks
based
on
the
counters
that
are
available
map
those
into
actions
so
that
the
users
know
what
can
do
to
tune
their
applications.
Again,
we
have
the
docker
container.
We
have
a
repo
for
you
to
go
there
and
explore
you
can
also
install
HT
VIP
and
the
way
that
it
works.
B
B
To
see
if
your
application
is
doing
something
or
not,
so
here
are
the
sort
of
levels
that
we
have.
A
couple
of
things
that
should
be
noticed
is,
since
we
are
looking
at
the
profiling
information.
There
are
some
things
that
do
require
more
information
from
the
application
side
that
are
not
quite
available
unless
we
have
the
dxt
logs
or
have
some
other
metrics
that
are
coming
from
system
such.
C
B
Osd
usage
or
transferring
the
network
transfer,
we
won't
be
able
to
provide,
let's
say,
a
precise
recommendation
for
a
couple
of
things.
So
that's
why
we
set
up
like
a
warning
and
you'll
see
those
an
example
of
those
in
kind
of
following
slides,
and
if
you
did
everything
that
you
should
be
doing
so
far,
then
you're
going
to
receive
an
okay
there.
B
B
So
when
I
get
a
specific
darshan
log
and
I
pass
it
as
input
for
Tracy,
it
will
provide
some
overall
information
about
the
darshan
log,
that's
analyzing,
so
you
can
see
here
on
the
top,
including
the
number
of
files
that
my
application
was
using,
how
many
files
were
using
the
different
interfaces.
What
are
the
hints
that
this
particular
case
since
it's.
B
It
was
using,
and
there
are
a
couple
of
critical
warnings
so
far-
just
recommendations
in
this
particular
case.
It's
an
application
that
uses
HDMI.
You
can
see
that
it
needs
to
detected
that
a
lot
of
small
requests
are
coming
through,
so
that
is
known
to
high
performance,
so
it
will
show
up
which
file
is
causing
that
what
are
the
things
that
you
can
do
in
terms
of?
Perhaps
these
Collective
operations
or
is
a
buffering
technique
to
avoid
making
those
so
much
smaller
requests.
In
this
case,
the
application
is
doing
a
lot
of
consecutive
sequential
requests.
B
So
not
a
lot
of
random
operations
happening
there
and,
as
I
mentioned,
because
of
the
warning
things
and
the
way
that
darshan
today
as
a
profiler,
captures
the
first
time
stamp
for
the
first
operation
and
the
last
operation
we
don't
know
in
between.
If
there
was
any
communication
or
in
sleep
time
or
in
computation
happen,
so
we
can
be
sure
that
the
application
could
actually
benefit
from
a
synchronous,
audio
techniques
just
from
looking
from
the
profiling
logs.
B
If
we
go
to
the
dxt
sort
of
view,
we
can
see
those
gaps
because
we
know
exactly
when
are
you
having
it
exactly
when
other
things
are
happening?
So
in
this
case
we're
just
providing
some
recommendations
in
this
case.
Try
to
use
no
blocking
or
a
synchronous
audio
calls
if
the
application
is
detected,
that's
been
used
in
htf5
out,
which
is
not
in
the
picture
here,
but
it
will
provide
suggestions
to
use,
for
instance,
wall
connectors
that
could
Implement
a
synchronous
operations
transparently
to
the
application.
B
So
this
is
just
a
the
first
view.
We
can
also
have
a
much
more
verbose
view,
which
will
show
some
code
snippets
on
how
to
implement
or
fix
those
those
things.
So
if
I
say
oh
use,
Collective
operations
or
asynchronous
operations,
how
do
I
do
that,
so
the
Snippets
are
going
to
be
provided.
They
are
not
particularly
taking
into
consideration
the
code
that
you
have
on
your
application,
so
you're
not
doing
any
static
analysis
to
provide
exact
line,
need
to
change.
B
We're
just
pointing
you
to
the
right
way
on
what
you
should
look
at
and
what
you
should
try
to
to
do
to
fix
that
some
other
issues
are
not
quite
related
to
the
application
itself
in
a
way
that
it
was
coded
or
designed,
but
rather
into
how
we
are
using
the
stack
available.
So
some
of
those
related
to
aggregators.
When
you
use
Collective
operations,
you
can
modify
or
fine-tune
them
based
on
environment
variables.
So
we
do
provide
some
samples
here
or
which
hints
you
should
tune
for,
let's
say:
open,
PM,
open,
piano,
open.
C
C
B
B
This
is
a
study
that
we
did
taking
all
the
logs
on
Corey
in
a
simple
one
and
we
ran
3D
for
all
of
them
tried
to
see
how
common
some
issues
show
up,
and
you
can
see
that
there's
a
lot
of
things
going
on
a
lot
of
things
that
we
don't
optimize,
we
don't
take
into
account
and
we
don't
see
that
our
applications
are
actually
doing
especially
small
requests.
You'll
see
obligations
that
are
making
a
lot
of
small
requests
are
98
of
what
we
saw
so
far.
B
We
do
have
a
lot
of
significant
number
of
random
requests,
not
so
much
as
for
rides,
and
if
we
look
at
the
mpio,
we
do
see
quite
a
small
number
of
jobs
using
mpio,
so
97
don't
actually
use
Collective
calls
or
we
didn't
detect
at
least
mpio
calls
into
the
dark
slots,
but
from
the
ones
that
we
detected
on
that
particular
amount.
Those
there
are
several
that
don't
properly
set
the
buffering
information
through
hints
in
order
to
harness
the
performance,
the
Canon
from
the
file
system,
the
network.
B
B
Just
remembering
that
for
360
you
don't
need
to
have
the
dxt
log
tracing
information
enabled
it
will
work
with
any
darker
file,
be
that
generated
with
MPI
applications
or
non-n-ppi
applications,
and
you
can
get
all
of
those
insights
in
your
console
and
I.
Think
that
is
each
that
I
wanted
to
share.
Sorry
that
we
don't
have
my
thing
working
for
the
demo,
but
do
I'll
try
to
share
the
slides
with
everyone
feel
free
to
explore,
and
if
you
have
any
questions,
I'll
be
monitoring
on
on
slackcam.