►
From YouTube: 5 Tools: Craypat Reveal (NERSC Cori KNL Training 6/2017)
Description
From the Cori KNL Training held June 9, 2017. For slides please see http://www.nersc.gov/users/training/events/cori-knl-training-2/
A
Okay,
so
a
good
afternoon,
everyone,
my
name-
is
Rebecca
Hartman
Baker
I'm,
the
leader
of
the
user
engagement
group
here
at
nurse
I'm,
going
to
talk
with
you
about
using
cry
pet
and
reveal
on
Cory,
okay.
So
first
we're
going
to
talk
about
profiling
with
cry
pat
and
then
we're
going
to
talk
about
how
we
can
use
reveal
for
our
OpenMP,
so
first
of
all
profiling
with
Craig.
A
That
kind
of
so,
first
of
all,
does
everyone
see
the
joke
in
this
picture
right,
it's
a
little
profile
profile
of
Cochise
in
the
mountains,
wasting
that
little
joke
there.
Do
that
hopefully
wake
you
up
from
your
post
lunch
coma
anyway,
so
I
sort
of
explain
what
it's
cry:
pat
show
you
how
to
do
kind
of
a
simple
profiling
experiment
and
then
do
more
full
service
profiling.
So
clay
Pat
is
crazed
performance
analysis
tool.
Does
the
natal
pet?
A
You
can
evaluate
the
behavior
of
your
program
on
a
Cray
supercomputer
and
you
can
use
it
under
any
programming
environment.
You
can
use
it
to
find
hot
spots,
find
load
imbalances
in
efficiencies
in
your
code.
It
will
provide
you
information
about
your
I/o
and
memory
usage,
your
MPI
communications
number
of
flops
that
you're
using
and
sometimes
it
will
even
give
you
a
recommendation
for
a
rank
reordering
like
if
you
rerun
your
program
with
with
the
ranks
reordered
in
this
particular
way.
They
say.
Well,
we
estimate
you'll
get
a
little
bit
better
performance.
A
Okay,
so
it's
also
it's
primarily
it's
a
profiler.
It
has
some
limited
tracing
abilities.
There
are
better
tracing
tools
out
there,
such
as
map
and
vampyre
trace,
but
it
does
do
some
tracing
where
it
just
kind
of
does
a
play-by-play
kind
of
almost
like
a
movie
of
what
what
you've,
what
your
program
did.
A
Okay,
so
perf
tool
of
life
is
the
module
that
you
can
do
a
real
simple
pro
filing
with
this
module,
it's
much
easier
to
use
than
perf
tools,
and
it
does
almost
everything
that
you
would
want
to
do
anyway.
So
all
you
have
to
do
in
order
to
use
crepe
ad
if
you
just
compile
your
code.
While
you
have
this
perfect
tool
of
light
module
loaded,
then
you
run
your
code
as
normal
and
it
does
an
output
of
standard
out
and
in
a
RPT
file.
A
It
will
also
generate
a
file
that
it's
called
a
dot,
a
p2
file
that
you
can
view
with
apprentice
to,
and
that's
so
crazy
gooey
for
a
crepe
ad,
and
then
it
might
also
give
you
an
M
pitch
rank
reorder
file,
which
you
can
use
like
I,
said
to
figure
out
a
good
rank
reordering
that
will
increase
the
performance
of
your
code.
So
super
easy,
so
here
is
sort
of
an
example.
Output.
So
I
ran
this
on
a
code.
A
Excuse
me
a
code
that
I
wrote
so
you
can
see.
I
ran
it
on
64
MPI
processes
on
just
one
node
of
quarry
and
it's
sort
of
giving
me
some
information
at
the
bottom.
Here.
It's
telling
me
well
I
spent
about
almost
five
hundred
and
sixty
seconds
on
average
per
process,
I
used
about
I,
guess
almost
1,900
megabytes
and
my
IO
read
and
write
rates
all
kind
of
stuff
like
that.
A
Then
it
gets
really
interesting.
So
it
gives
you
these
tables,
so
the
table
is
a
profile
by
function,
group
and
function.
So
in
my
particular
case,
my
codes
that
almost
have
it's
time
doing:
sines
and
cosines
and
linear
algebra
that's
the
way
my
code
is
and
it
spent
a
vast
majority
of
its
user
time
in
this
function
called
int
GID.
So
actually
this
is
a
code.
That's
doing
a
lot
of
quadrature!
That's
that's
why
it's
doing
all
these
things
and
then
it
spent
a
fair
amount
of
time.
A
A
Okay.
So
how
do
we
do
it
first
thing?
Is
you
need
to
unload
the
dharshan
module
that
somehow
that
always
interferes
with
crepe
add
so
you
need
to
load
the
perf
tool
base
and
perf
tools
like
modules,
perfect
tools
base
just
have
all
the
man
pages
for
the
perf
tools.
It
doesn't
actually
really
do
anything
and
that
way
you
can
actually
load
that
and
look
at
them
before.
You
actually
run
with
perf
tools,
and
so
then,
once
you
have
perfect
tools,
Lite
loaded,
you
can
compile
and
run
your
code
as
usual.
A
Just
like
you
normally
would
there's
a
slight
overhead,
but
it's
not
a
very
big
overhead.
When
you're
running
these
jobs,
all
right
so
perf
tools,
lights
serves
the
purpose
for
most
people
does
what
most
people
would
ever
need
you
most
people
will
not
need
to
move
on
to
full
service
profiling,
but
if
maybe
you
need
more
information
than
perfect
tools
light
provides.
A
A
You
might
want
to
focus
on
a
particular
class
of
functions
to
see
how
it
those
particular
class
of
functions
is
performing,
and
maybe,
if
you
want
to
do
the
tracing
that
I
had
talked
about
rather
than
just
the
profiling.
So
if
any
of
those
things
apply
to
you,
then
you
might
want
to
try
more
of
a
full
service
profiling.
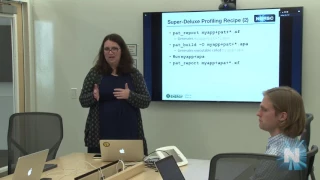
So
I'm
going
to
give
you
a
Super,
Deluxe
profiling
recipe
and
tell
you
about
some
of
the
to
pack
build
okay.
A
A
A
Ok,
so
next
thing
that
you
do
is,
after
you
have
those
XS
files,
you're
going
to
do.
Pat
report
on
those
and
it'll
generate
my
app
plus
Pat
plus
start
a
PA,
and
then
you
take
that
and
you
use
that
to
build
another
executable
called
my
app
plus
a
PA,
so
I'm
not
sure
what
a
B
ASIS
or
something
like
a
per
se
I,
don't
know
what
the
a
is
first
a,
but
it's
like
procedural
enough.
A
It's
like
looking
it's
like
kind
of
generally
taking
a
summarizing
look
at
what's
going
on
in
your
code
and
then
it's
going
to
focus
in
this
next
step.
It's
going
to
focus
on
particular
subroutines
or
functions
that
aren't
run
a
lot.
Ok,
so
then
you
run
this
my
app
plus
a
PA.
You
run
that
like
regular
and
then
you
you
get
out
just
these
excess
files
again,
and
you
do
Pat
report
on
that,
and
then
that
tells
you
that
will
give
you
all
the
information
you
ever
wanted.
A
Okay,
next
option
is
nice,
geez
trace
group,
so
trace
group
is
just
a
group
of
functions
that
they
think
you
might
be
interested
in,
so
one
of
them
would
be
like
NPI,
like
maybe
you're,
just
really
interested
in
finding
out
all
the
behavior
of
MPI
calls
in
particular
in
your
code.
You
don't
care
about
anything
else.
So
you
could
select
that
as
your
trace
group,
other
options
would
be
like
blah
fftw,
petsy
netcdf.
A
Okay,
then
there's
W
and
the
W
will
do
tracing
rather
than
profiling,
so
profiling
and
tracing.
Let
me
clarify
completely
so
everybody
understands
this.
So
tracing
is
where
you
really
are
kind
of
like
almost
creating
a
movie
of
what
happened
in
your
code.
It's
kind
of
a
time
time-lapse
of
what
happens
in
your
code,
not
the
individual
values
in
your
code
per
se,
but
like
all
of
the
calls
of
the
subroutines
and
all
of
the
memory
usage
and
all
those
things.
A
Profiling
is
just
more
like
you're
just
taking
samples
and
it's
sort
of
a
static
thing
not
dependent
on
time,
so
it
will
find
like
high
watermarks
or
low
water
marks.
But
it's
not
going
to
tell
you
you,
you
spiked
up
in
your
memory
usage
at
this
particular
point,
whereas
tracing
would
tell
you
something
like
that.
A
Okay,
so
now,
I'm
going
to
switch
gears
slightly
I'm
going
to
talk
about
using
Cray,
reveal
to
parallelize
your
code,
so
reveal.
Is
this
handy
tool?
I,
don't
know
if
anyone
else
here,
besides
being
super
lazy,
I'm
super
lazy,
I
break
rare
I,
readily
admit
that
so
I
don't
like
to
actually
try
to
figure
out
how
to
how
to
use
OpenMP
to
parallelize
my
code,
but
reveal
will
do
that
for
me.
So
that's
pretty
awesome!
A
That's
why
I
like
to
reveal
so
it's
a
tool
for
porting
your
code
to
a
shared
memory
or
offload
programming
model
but
of
course
we're
focusing
on
shared
memory.
Here
you
combine
profiling
in
so
that
you
get
from
creep
at
which
spiah
told
you
about
crazy
at
first
and
cray
compiler
annotations,
to
determine
where
we
can
place.
Openmp
directives
and
those
OpenMP
directives
are
generated
automatically
like
I
said
so,
I
don't
even
have
to
figure
it
out
it
just
does
it
for
me.
So
that's
super
great
excuse
me.
A
Unfortunately,
it
works
only
in
the
Cray
programming
environment
now
Cray
pad
itself.
You
can
use
with
the
crêpe
rogue
ramming
environment,
the
Intel
programming
environment
or
the
new
programming
environment,
but
because
this
relies
on
compiler
annotations,
then
we
have
to
use
the
Kreg
compiler
be
cuz,
that's
the
one
that
Kray
used
when
they
developed
this
tool.
A
Okay,
simple:
five
steps
for
using
Kray
reveal
number
one
compile
your
code
with
perfect
tools,
light
loops
to
set
up
perf
tools,
work,
loop
estimates,
experiments,
number,
two
run
a
representative
job
job
that
you
that
is
typical
of
your
code.
Number
three
rebuild
it.
With
the
CTE
program,
library
number
four
run
revealed
and
number
five
insert
directives
think
about
loop,
reordering
and
analyze
performance
from
those
optimizations,
and
then
leather
rinse
repeat:
go
back
to
the
top
okay.
A
So
for
step,
one
here's
how
we
do
it
first,
we
got
to
unload
dharshan
always
have
to
do
that.
Then
we
got
to
get
into
the
Kray
programming
environment
and
then
we
load
perf
tools
base,
because
you
have
to
always
load
that
add
perf
tools,
Lite
loops,
okay.
So
then
you
just
compile
and
Link
as
normal.
Okay.
A
Okay,
second
step
just
run
a
normal
representative
job
like
you
normally
would
when
I
say
a
representative
job
I
mean
something
that
runs
in
a
relatively
short
amount
of
time,
maybe
half
an
hour
or
something
like
that,
but
it
performs
proportionately
the
same
work
as
a
typical
production
run.
So
you,
if
there's
some
part
of
the
code,
that
you
know
it's
been
spoke
of
its
timing
in
this
run.
You
also
want
it
to
spend
the
bulk
of
its
time
doing
that.
A
A
All
right,
sorry
about
that
y'all
I'm
trying
to
get
over
cold
here.
Okay,
so
we've
got.
We
want
to
create
this
program
library,
and
what
that
is
is
that
is
where
the
compiler
kind
of
makes
some
notes
to
you
about
what
it
did
and
what
it
or
what
it
didn't
do
and
why
so
it'll
it'll
be
like
well
I
tried
to
I.
A
You
know:
I
I
tried
to
vectorize
this
loop,
but
I
couldn't
because
you
had
this
conditional
statement
in
it
or
I
tried
to
I
tried
to
reorder
this
other
loop
and
I
was
able
to
do
that.
So
it
will
tell
you
both
successes
and
failures.
Okay,
so
you
at
you
got
to
add
this.
Minus
h
PL
equals
some
full
path
for
a
program
library
directory
to
get
your
compiler
feedback
all
put
into
that
same
directory.
A
So
if
you
don't
put
a
full
path,
there
then
it'll
do
a
relative
path
which
works.
If
you
have
all
of
your
code
in
one
directory,
but
if
you
don't
have
all
of
your
code
in
one
directory,
then
it'll
make
that
relative
to
whichever
directory
it
moves
into
while
it's
doing
the
make.
So
then
it'll
be
in
multiple
places
and
reveal
one
more
because
I'm
gonna
be
able
to
find
it.
So
it
needs
to
be
everything
needs
to
be
put
into
one
directory.
A
A
Ok,
so
here
I
did
it
on
my
code
that
I
had
profile
previously.
So
you
can.
You
can
see
all
these
great
names
of
functions
that
are
quadrature
function,
so
DFS
HRE,
that's
a
quadrature
function,
some
really
old,
quadrature
thing!
Ok,
so
here
there's
it!
You
can
open
up
the
scoping
window
here
so
yeah.
So
this
this
is
kind
of
like
a
list
of
all
the
files
that
might
have
them.
Then
I
could
scope.
So
you
can
pick
all
of
them.
You
can
pick
from
that
list.
A
Do
I
want
to
scope
it
or
doing
that?
Ok,
so
here
is
an
example,
compiler
annotations
and
explanations,
so
this
particular
line
here
in
DL,
HRE
or
whatever
the
amount
of
file
is
I'm
on
line
133
because
I
have
it
highlighted
here.
He
says
so
it
has
a
red
circle
if
it's
bad
thing
and
it
has
a
green
square.
A
Ok,
so
that's
why
the
compiler
looked
at
it
and
said:
no,
no
can
do
there's
a
call
to
a
function
in
there
and
similarly
elutes
starting
a
line.
144,
which
is
within
the
scope
of
this
loop,
is
like
an
inner
loop.
It
says
it
wasn't
vectorize
because
it
contains
a
call
to
a
subroutine
online
152,
okay,
fair
enough,
and
then
we
have
some
kind
of
mixed
success
here.
A
loop
starting
at
line
152
was
partially
vectorize
with
a
single
vector
iteration.
A
So
then
here's
another
one
where
I
had
much
better
luck.
So
if
you
look
on
the
side
here,
this
is
like
a
list
so
I'm
I'm
in
program
view
I
can
choose
different
views.
I
can
choose
program
view.
I
could
choose
loop
view.
I
could
choose
a
bunch
of
different
views
so
in
this
particular
file,
DFS
href
in
this
particular
subroutine
I
have
three
loops
that
it
says
I
think
I
can
paralyze.
These
loops
I
have
three
loops
that
it
can't
paralyze
and
then
I
have
another
loop
where
it
says
it
can.
A
Okay,
so
I'm
just
picking
one
of
these
examples,
so
I
can
click
on
the
loop
and
I
can
get
it
to
scope
that
loop,
and
so
it's
showing
me
all
of
the
variables
associated
with
this
particular
loop,
and
it
says
what
type
of
a
variable
they
are
a
scalar
or
an
array.
It
says
the
scope
that
they
should
have,
whether
they're
a
private
variable
or
a
shared
variable,
or
sometimes
it
can't
figure
it
out
and
I'll
show
you
what
it
says
there:
okay,
so
then
I
can.
A
So
this
is
just
a
close-up
of
this
little
part
right
down
here.
So
I
can
hit
the
show
directive
right
there
and
it'll
actually
show
me
that
directive.
So
this
is
the
directive
that
it
would
put
into
my
code
if
I
want
to
for
the
openmp.
So
you
can
see
it's
a
directive
inserted
by
curry
reveal
so
that's
always
also
very
helpful.
You
can
have
it
say
that
and
then
you
don't
have
to
even
I
was
playing
these
directives
that
reveal
to
them.
A
A
Now,
here's
another
case
where
I've
had
an
unsuccessful
scoping
and
a
big
problem
here
is
that
there
are
a
bunch
of
variables
where
it
just
can't
figure
it
out.
It
can't
figure
out
whether
it
should
be
a
shared
variable
or
a
private
variable
or
if
there's
some
other
issue
here,
so
it
scoped
it
as
unresolved
unresolved
and
the
reason
is,
it
says:
there's
a
possible
recurrence
involving
this
object,
so
it
can't
it
doesn't
know
what
to
do
with
it
at
all,
and
then
this
one
it's
like
well,
assuming
there's
no
conflict
in
scatter.
A
Then
we
can
we
can.
We
can
do
that.
So
it's
so
there's
a
bunch
of
issues,
though,
that
it's
having
so
if
I
were
to
just
say
and
whatever
I,
don't
care
about
those
issues
whatever
reveal
I
I'm
smarter
than
you
are,
and
so
then
I
get
the
directive
here.
This
is
what
the
directive
is
going
to
look
like.
So
you
notice
it's
got
the
private
variables
and
the
shared
variables
it
also
has
unresolved
variables,
but
unresolved
is
not
a
keyword
in
in
openmp.
A
So
when
I
tried
it
when
I
stick
this
in
my
code
and
I
try
to
compile
it
compilers
going
to
fail,
it's
going
to
say:
hey!
Is
this
an
error?
I,
don't
even
know
what
you're
talking
about.
What's
resolved,
okay,
yeah,
that's
just
a
little
hand
there
to
just
show
you
unresolved
it's
going
to
do
that:
okay,
okay!
A
So
our
next
step.
This
should
be
step
5.
Is
we
insert
our
directives
so
I
had
some
successful
directives
in
there
could
have
been
sorted
them
and
then
another
thing
to
do
is
also
look
at
the
compiler
feedback
to
determine
a
potential
any
potential
for
loop
reordering.
So
you
can
also
get
much
improved
performance
by
reordering
loops.
Sometimes,
and
the
compiler
feedback
will
often
tell
you
it'll,
say
well:
I
tried
I
reward
this
loop,
so
you
could
read
it.
A
You
could
reorder
it
yourself
to
get
that
type
of
performance
out
of
other
compilers
or
you
could
also
look
at
some
of
the
other
feedback
that
you
get
like.
Oh
well,
there's
this
conditional
if
statement
inside
of
a
loop
and
then
maybe
if
you
can
figure
out
a
way
to
get
that
out
of
there,
then
it
could
sector
eyes
that
limit
for
whatever,
so
the
Craig
compiler
is
like
really
good
at
optimizing
code.
It's
actually
amazing
the
Fortran
compiler
in
particular
very
strong,
but
sometimes
it
requires
a
little
help
from
humans.
A
So
that's
just
something
to
to
note
so
then
after
you
have
inserted
your
directives
and
B,
then
you
can.
You
should
just
try
it
out
again
see
how
your
performance
is
after
these
optimizations
lather
rinse
repeat
so.
Your
performance
now
is
better
in
this
subroutine,
but
now
there's
another
subroutine.
That's
taking
up
all
your
time
so
then
examine
that
one
use
grey
reveal
to
figure
out
if
you
could
paralyze
that
with
openmp
and
just
keep
going
until
you
have
a
perfect
code
that
works
perfectly
all
time
which
I
know
everyone
will
get
there
someday.