►
From YouTube: Anomaly Detection in CLA
Description
By Subutai Ahmad, presented at 2014 Spring NuPIC Hackathon.
Source code referenced is at https://github.com/subutai/nupic.subutai/tree/master/run_anomaly
A
Okay,
you
good
okay,
let's
get
started
so
I'm
going
to
talk
about
anomaly
detection
using
the
cortical
learning
algorithm,
and
this
is
something
we
at
numenta.
We
really
started
doing
in
earnest
sort
of
last
year
and
started
looking
at
a
lot
of
data
sets
and
applications
for
this
and
in
the
beginning
you
know
we're
interested
in
it.
You
know
I
thought
it
was.
You
know,
anomaly,
detection
kind
of
cool.
You
know
detecting
novel
things
in
in
data
as
we
started
getting
more
and
more
into
it.
A
I
really
started
realizing
how
fundamental
anomaly
detection
actually
is-
and
you
know,
we're
living
in
a
world
where
the
number
of
sensors
and
the
streams
of
data
is
just
exploding
exponentially
and
all
of
you-
everyone
here
has
seen
those
graphs
of
you
know
the
internet
of
things,
graphs
and
all
that
stuff,
where
the
number
of
sensors
is
just
increasing
exponentially
and
with
so
much
data.
You
really
there's,
there's
no
way
to
really
sift
through
it
all,
and
one
of
the
most
efficient
tactics
you
can
use
is
look
to
see
what's
different.
What
is
unusual?
A
This
is
the
memo
baby,
how
many
of
you
here
have
kids
or
have
had
babies
or
our
parents,
and
so
on?
Okay,
how
many
of
you
have
been
a
baby
at
one
point?
Okay,
so
I
think
with
this
most
of
you
would
be
interested
in
this.
So
there's
a
company.
I
think
it's
called
rest
devices
or
something
it's
a
startup
in
boston.
They
make
this
baby
onesie
with
a
number
of
sensors
in
it,
so
it
senses
the
baby's
respiration.
A
It
senses
the
baby's
temperature,
it
senses
the
baby's
movement,
the
heartbeat
and
so
on,
and
it
streams
this
to
your
phone.
So
you
have
constantly
you
have
access
to
your
baby's
data
and
what
could
be
more
important
to
a
parent
than
doing
anomaly
detection
on
this
data
stream.
You
know
if
you
have
your
baby
and
you
want
to
know
if
something
unusual
is
going
on,
so
here's
an
example
of
something
that
you
know
where
zombie
detection
could
really
play
a
very
big
role
in
this.
A
Our
product
detected
an
anomaly
one
day,
and
you
know
it
shows
the
red
at
the
bottom
there
and
when
I
started
looking
at
what
urls
led
to
that
she
had,
I
think,
declared
that
she
had
a
miscarriage
or
something
and
the
web
had
gone
crazy
over
there.
So
whether
you
want
to
save
babies-
or
you
know,
you
know,
follow
the
paparazzi
anomaly
detection,
I
think,
has
a
pretty
lots
of
use
cases
so
anyway.
So
what
I'm
going
to
do
is
dive
into
some
of
the
details
of
how
we
do
it.
A
A
Okay,
so
those
are
the
three
things
I'm
going
to
try
to
cover
today
and
I
have
a
little
bit
of
sample
code
that
I'll
release
as
well
as
part
of
this,
and
maybe
it'll
make
your
life
a
little
easier.
If
you
want
to
do
anomaly
detection
today,
okay,
so
what
is
anomaly
detection?
So
this
is
a
definition
from
the
dictionary
you
know.
Anomaly
is
something
that
deviates
from
what
is
standard
normal
or
expected
in
our
case
that
something
is
a
data
stream
and
patterns.
So
this
thing
is
speaking
of
anomalies.
A
A
I'll
be
stuck
you'll
have
to
hear
from
me
for
the
okay.
Well,
we'll
figure
it
out,
okay.
So
in
our
case
this
something
is
patterns.
You
know,
patterns
that
are
coming
in
over
time
and
you
want
to
detect
when
the
patterns
have
deviated
from
normal
behavior,
but
there's
a
lot
of
subtlety
behind
the
statement.
So
one
example
of
the
type
of
anomaly
might
want
to
detect
is
a
simple
spatial
or
static
anomaly,
and
this
is
the
most
common
type
of
anomaly
detection
you'll
find
in
the
literature.
A
A
Spatial
anomalies,
so
here's
an
example
of
the
data
and
it's
falling
into
mostly
two
clusters,
and
you
can
see
that
you
know
there
are
two
points
there:
0
1
and
01
and
o2.
That
are,
you
know,
definitely
outside
the
cluster,
so
those
will
definitely
be
static,
statically
defined
anomalies
and
most
of
the
people
in
the
industry
actually
use
something
even
simpler
than
this,
which
is
thresholding.
You
know
so
they'll
say
you
know.
A
The
value
of
x
has
to
be
less
than
this
or
greater
than
this
or
value
of
y
has
to
be
between
this
range.
So
essentially,
these
are
like
rectangles
in
this
space
and
that's
what
we
see
most
commonly
in
the
industry,
so
o1
and
o2
would
be
anomalies.
O3
is
kind
of
interesting.
It's
it's
got
a
few
patterns
in
it.
You
know
a
few
dots
in
it.
You
know.
Is
that
an
anomaly
or
not?
Well,
you
know
maybe
the
first
couple
of
times
it
is
after
you
see
it
enough
times.
A
It's
not
really
an
anomaly,
it's
rare,
but
it's
not
really
novel
as
such,
so
but
nevertheless,
this
is
kind
of
the
one
type
of
anomaly
detection
that
that
you
might
want
to
do.
Then
there
are
temporal
anomalies,
and
this
is
a
data
stream.
I
think
it's
an
electrocardiogram,
so
it's
basically
heartbeats
over
time
and
you
can
see
that
in
the
middle
there
the
heart
didn't
beat,
and
apparently
this
is
indicative
of
arrhythmia
or
some
some
condition.
A
You
know
this
type
of
thing,
and
this
is
interesting,
because
the
previous
technique
of
looking
at
static
values
would
not
have
detect,
would
not
detect
this
anomaly.
In
fact,
the
values
that
are
in
red
there
are
completely
normal.
They
do
occur
quite
often
it's
just
that
they
don't
occur
in
this
particular
temporal
sequence.
A
Okay,
that's
what's
novel
here
is
that
the
is
the
temporal
sequence,
so
that's
another
type
of
anomaly
that
you
might
want
to
detect
okay,
a
little
more
complicated
than
the
previous
one.
Here's
a
real
world
example
of
this.
This
is
data
that
we
saw
last
year.
This
is
the
gear
bearing
temperature
from
a
windmill.
A
So
you
know
you
have
all
these
windmills
and
in
windmill
farm
and
they
have
tons
and
tons
of
sensors
and
they're
spitting
out
data
continuously,
and
what
you
can
see
on
the
extreme
right
is
when
the
windmill
actually
broke
down.
You
can
see
the
the
the
temperature
goes
way
up,
but
right
there,
the
temperature
actually
starts
act,
behaving
weirdly,
it's
a
little
subtle,
but
it's
actually
very
indicative
of
the
failure
that
happens
later.
A
A
Then
there
are
a
couple
other
types
that
we've
seen
you
can
have
a
very
random
behavior
and
you
can
have
anomalies
in
that
random
behavior.
So
this
is,
you
know,
we're
working
a
lot
with
it
data.
So
this
is
data,
that's
representative
of
latencies
in
your
load
balancer.
So
if
you
have
a
website-
and
you
hit
your
website,
how
long
does
it
take
before
you
get
that
page
out
and
most
of
the
time
it's
really
low,
it's
near
zero.
You
know
some
of
the
time
it's
near
half
a
second.
You
know
well.
A
That
was
another
anomaly,
so
you
know
most
of
the
time
is
there
and
every
once
in
a
while
a
few
times
a
day,
it
jumps
up
to.
You
know
two
and
a
half
three
second
range.
You
know
this
is
completely
unpredictable.
You
don't
know
when
it's
going
to
happen,
it's
it's
random.
Yet
you
can
clearly
tell
that
right.
There
there's
something
really
unusual
is
going
on.
Your
website
is
going
a
lot
slower
than
it
should
be.
A
Otherwise,
and
maybe
you
know,
developer
had
pushed
some
code
to
it
or
you
changed
the
configuration
of
your
system
or
whatever
you
know,
you
don't
know
what
it
is,
but
suddenly
the
latencies
have
gone
way
up,
and
this
is
really
hard.
It's
it's
there's
no
real
detectable
pattern
as
such,
it's
just
that
the
nature
of
the
randomness
has
changed.
A
So
this
is
a
cpu
usage
and
you
can
see
that
on
the
left
instead
of
hovering,
you
know
between
six
and
seven,
it's
noisy,
but
it's
sort
of
staying
in
that
range
and
then
there's
a
point
in
time
when
it
suddenly
spikes
up.
So
that's
an
anomaly.
Something
unusual
happens
right
there
and
then
you
know,
then
it
stabilizes
at
a
at
a
higher
level.
Now,
if
you
were
using
a
pure
threshold
or
or
some
other
system,
you
know
you
would
definitely
detect
this
anomaly,
but
then
you
would.
A
You
would
keep
triggering
an
alert.
However,
in
this
case
this
is
once
it
stays
there
and
you
can
see.
The
axis
is
on
the
order
of
days
once
it's
there
for
a
little
while
it's
the
new
normal,
it's
not
anomalous
anymore.
It's
only
anomalous
at
the
point.
It
shifted
from
one
value
to
another
and
once
it
stays
there,
it's
no
longer
anomalous,
okay.
So
the
regime
here
is
now
normal,
even
though
the
point
here
is
abnormal.
A
Okay.
So
there
are
a
number
of
different
kind
of
subtleties
that
you
have
to
handle
when
you
do
anomaly:
detection.
Okay,
so
just
to
recap,
anomalies
are
so
we're
defining
as
any
significant
deviation
from
normal
behavior
anomaly.
Detection
is
extremely
valuable
in
this
area
and
it's
hard
to
do
well.
There
are
many
flavors
of
anomaly
detection,
as
I
went
over
spatial
anomalies,
temporal
anomalies
changes
in
randomness
temporary
stuff,
where
you
have
to
adjust
to
a
new
normal.
A
So
all
of
these
kinds
of
things
have
to
be
handled
and
one
of
the
kind
of
hard
things
we
also
found
is
there
aren't
great
data
sets
that
capture
all
of
these
things
in
in
the
industry.
You
know,
maybe
there
are
some
we
haven't
found.
There
are
some
that
capture.
You
know
individual
things,
maybe,
but
it's
not
really
it's
hard
to
find
a
good
data
set.
That
really
captures
all
of
these
things
that
we
want
to
have.
A
A
It's
also
because
the
nature
of
the
cla,
it's
a
continuously
learning
online
system,
so
you
know
those
temporary
anomalies,
it'll
it'll,
detect
the
anomaly
and
then
it'll
quickly.
Learn
that
that's
the
that's
the
new
normal
and
one
of
the
really
unusual
things
about
the
anomaly
detection
in
nuke
pick
is
that
it
can
work
for
both
numerical
and
categorical
data.
A
In
fact,
you
can
actually
mix
the
two
in
the
same
data
stream
and
it'll
still
work
just
fine
and
the
the
reason
for
that
is
that
we
translate
everything
into
this
common
representation,
the
sparse
distributed
representation.
Then
everything
works
on
sdrs
and
as
long
as
you
can
convert
it
to
an
sdr,
you
can
do
anomaly
detection
on
it
with
with
newpic
okay.
So
this
is
a.
This
is
a
really
nice
property
of
the
anomaly
detection,
algorithm.
A
A
Okay
and,
as
you
know,
the
cla
is
constantly
learning
common
spatial
patterns
in
the
spatial
pooler
and
it's
constantly
learning
the
common
temporal
sequences
in
the
stream
of
inputs
that
are
coming
in
and
that's
done
in
the
temporal
pooler
and
then
at
each
time
step.
The
temporal
puller
is
actually
making
multiple
predictions
about
what
might
come
next,
okay,
so
at
every
time
step
it
has
a
expectation
of
what's
going
to
happen
in
the
next
time
step,
and
it's
not
just
a
single
expectation.
A
It
has
it
can
actually
branch,
it
can
have
multiple
predictions
of
what
might
actually
happen
next
and
an
anomaly
score
is
really
simple.
What
we
do
is
we
look
at
the
current
value.
That's
come
in
and
see:
okay
was
it
predicted
from
at
the
previous
time
step
and
how
well
was
it
predicted
if
it
was
predicted
really
well,
the
anomaly
score
is
zero.
A
If
it
wasn't
predicted
at
all,
then
the
anomaly
score
is
one,
and
if
the
prediction
is
somewhere
in
between,
then
it's
between
zero
and
one
and
the
way
this
works
is
if
you're
familiar
with
sdrs,
it
works
in
column
space.
So
the
the
the
current
input
is
represented
in
the
opf,
typically
as
a
set
of
40
columns
that
are
on
and
the
temporal
pooler
is
going
to
be
predicting
some
number
of
columns
to
come
on,
and
we
just
look
at
how
many
of
the
ones
that
were
predicted.
A
A
Okay,
let
me
give
you
a
simple
artificial
example,
and
let's
see
if
you,
if
you
get
this,
so
here's
a
simple
model
of
a
of
a
sequence,
so
you
start
at
a
and
with
80
chance
you
go
to
b,
15,
chance
c
5,
chance
d
and
then
no
matter
where
you
are
here,
you
always
go
back
to
a
okay.
So
here's
a
example:
temporal
sequence:
it's
coming!
Yes,
the
powerpoint
does
have
this
animation.
A
I
have
to
have
at
least
one
gratuitous
animation
in
there.
So
let's
say
you
have
this
sequence
and
you've
been
learning
on
on
these
statistics
and
you're
at
a
and
now
you
you,
you
have
some
prediction
about
the
next
input
that's
coming
in
and
let's
see
what
actually
happens
so
suppose,
b
c
or
d
occurs.
A
Either,
either
b,
c
or
d,
if
any
of
these
occur
here,
what
do
you
guys
think
the
anomaly
score
would
be
less
than
one
it'll
be
zero
here,
because
it's
if
it's
exactly,
b,
c
and
d
and
we've
assuming
we've
learned,
everything's
learned
well
and
stuff
it'll
be
zero,
because
the
temporal
pooler
will
have
predicted
the
union
of
these
three
to
occur.
Okay,
so
anomaly
score
will
be
zero.
A
A
Okay
and
then
the
next
thing
is
suppose
a
to
e
repeats.
Quite
often,
you
know
multiple
times
in
this
scenario.
Well,
then,
anomaly
score
will
drop
to
zero
again,
regardless
of
how
different
it
was
from
bc
or
d
okay.
So
this
is
the
continuous
learning
part
of
it
simple
example,
but
hopefully
gives
you
a
flavor
of
at
each
time
step
what
the
what
the
thinking
is.
A
So
here's
an
example.
This
is
the
same
data
set
I
showed
earlier.
This
is
the
the
value
and
then
this
is
the
anomaly
score
over
time,
and
you
can
see
that
this.
You
know
we're
continuously
learning
system,
you
start
from
the
very
beginning,
and
you
just
go
so
in
the
very
beginning.
The
cla
does
not
really
know
how
to
predict.
A
Of
course
it
didn't
predict
this
transition,
but
even
here
it's
not
predicting
the
step-by-step
transitions
because
it
hasn't
seen
enough
of
that.
But
then,
over
time
it's
going
to
go
down
again
and
again,
every
once
in
a
while,
some
random
event
will
occur.
You
can
see
it
picked
up
these
two
here
with
a
high
anomaly
score,
but
then,
after
that,
even
that
is
kind
of
expected
and
so
anomaly
score
will
will
go
down.
A
C
Yeah:
okay,
what
if
say,
there's
a
jump
in
the
data,
but
it's,
but
it's
not
necessarily
a
change
in
patterns.
It's
just
a
change
in
the
the
level
of
the
data.
If
the
same
patterns
continue
just
at
a
higher
level,
yeah
will
will
anomaly
scores
stay
high
after
the
transition,
or
will
it
understand
that
it's
the
same
pattern
just
at
a
higher
level.
A
So
it
depends
a
little
bit
how
you
encode
the
data.
If
you
just
encode
it
normally
like
the
way
we
do
it.
It's
not
it's
going
to
treat
this
as
completely
new
patterns,
and
so
once
it
jumps
up,
it's
going
to
start
learning
in
this
regime
again
and
that's
the
most
flexible
thing,
because
you
know
the
chance
that
it's
going
to
be
exactly
the
same
here
is
pretty
low.
Generally
speaking,
it's
going
to
be
different.
A
B
B
A
Yeah,
so
nupic
today
doesn't
implement
the
hierarchy
in
the
opf,
but
in
general
yeah
it
should
it
will
work
exactly
the
same
at
every
level
of
the
hierarchy
and-
and
you
know,
if
you
have
multiple
modalities,
you
know
you
could
have
an
anomaly
in
one
of
the
modalities
and
not
in
the
other.
So
you
know
if
you
have
melody
and
volume,
if
they're
encoded
separately,
you
know
you
could
actually
detect
the
fact
that
it's
the
same
in
one
area
and
actually
changing
in
the
other
part.
A
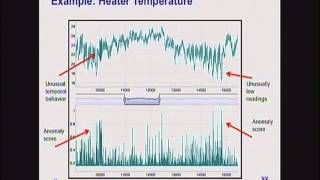
Okay.
Here's
another
example.
This
is
the
the
temperature
of
a
heater
in
a
in
a
office
building,
and
you
can
see
that
this
is
just
part
of
the
data
set,
not
the
whole
thing.
You
can
see
that
you
know
there's
sort
of
a
regular
behavior,
it's
a
little
hard
to
see
here,
but
there's
a
unusual
temporal
behavior
here
and
the
anomaly
score
here.
You
know
generally
jumped
up,
and
you
know
here
the
temperature
goes
down
and
it
became
unusually
low
and
in
this
case
the
anomaly
score
again
jumps
up
here.
A
A
Okay-
and
I
think
I
can't
see
exactly
here-
but
there
are
some
other
anomalies
when
you
actually
look
into
some
of
the
zoom
in
some
of
these.
There
are
some
unusual
things
that
that
it
finds
okay,
here's
one
of
the
toughest
cases.
This
is
the
random
data
I
showed
earlier,
and
you
know
the
anomaly
score
is
much
higher
here
than
than
average,
but
it's
kind
of
hard
to
tease
the
power.
So
this
is
a
example
of
where
the
current
scheme-
I'm
not
sure
it
really
adds
any
value
over
the
original
data
stream.
A
Here,
in
fact,
it's
a
little
more.
You
know
bushy
here,
but
I'll
show
you
a
little
bit
later
how
we
deal
with
this
kind
of
thing
in
grock,
but
this
is
here
where
this
the
data
set
is
just
inherently
unpredictable
and
so
step
by
anomaly.
Score
of
the
type
we're
doing
a
new
pick
doesn't
really
help
you
too
much
here.
Okay,
although
you
can
visually
see
that
it's
different.
A
E
I
ask
a
quick
question
yeah,
so
I
mean
if
you're,
when
you
were
talking
about
like
web
server
latency
I
mean,
can
you
just
filter
out
the
you
know?
Can
you
just
basically
do
like
a?
I
guess,
it'd
be
like
a
short
pass
filter,
a
low
frequency.
You
know
basically
filter
out
all
the
high
frequency
stuff
and
just
look
at
the
low
frequency
stuff
and
then
and
that'll
make
it
a
lot
clearer.
What's
going
on.
A
Yeah
yeah,
I
think,
with
I
think,
as
a
general
comment
with
any
of
these
data
sets,
if,
if
you
as
a
human
we're
looking
at
it,
you
can
craft
something
that
will
find
that
anomaly.
You
can
definitely
do
that
as
a
data
scientist
or
someone,
you
can
come
up
with
a
mechanism
to
craft
that,
but
the
thing
is
you
don't
know
what
it's
going
to
be
ahead
of
time.
A
You
know
in
a
you
want
to
build
a
system,
that's
going
to
do
well
on
a
very
wide
range
of
of
data
types,
and
you
know,
as
the
number
of
sensors
increases
so
dramatically,
you
can't
be
looking
at
each
single
one,
seeing
what
the
characteristics
are
and
then
you
know
come
up
ahead
of
time
with
with
what
the
exact
set
of
features,
if
you
will
that's
gonna
cap
that
so
I
think
I
think
you're
right.
I
think
for
this.
E
E
A
Okay,
so
I
put
up
some
sample
code
in
this.
In
my
github
repository,
it's
called
random
anomaly
and
I
put
in
some
of
the
data
sets
that
I've
been
showing
you
and
I
put
in
a
version
of
the
hot
gym
anomaly
script
that
scott
had
created
and
made
it
so
that
it's
easier
to
run
multiple
data
sets
and
output,
the
look
at
the
outputs
and
and
so
on.
So
you
could
take
a
look
at
that
and
these
data
sets
are
actually
in
there.
A
So
I
think
in
newpick
we
don't
really
have
a
great
anomaly
detection
data
set
today
we're
just
using
hot
gym,
which
is
not
really
an
anomaly
detection.
There's
nothing
truly
anomalous
going
on
in
there,
but
these
data
sets
there's
something
a
little
more
interesting
going
on.
So
you
can
take
a
look
at
that.
A
Okay,
so
let
me
switch
topics
and
talk
a
little
bit
about
grok
and
how
we
have
built
grok
on
top
of
new
pic
and
how
we
solve
some
of
the
issues
that
that
we've
seen
so
quick
kind
of
one
slide
description
of
grok.
If
you
haven't
seen
this
so
grok
is
the
product
that
we
put
out,
that's
built
with
new
pic
and
essentially
what
it
does
is
it
does
anomaly
detection
for
data
from
amazon.
A
You
know
data,
that's
coming
from
amazon
instances,
so
you
know
amazon
has
a
cloud
watch
service
which
is
constantly
monitoring
all
of
your
services
and
and
there's
a
data
feed
that
grock
can
input
from
and
from
there
we
will
automatically
put
out.
You
know
give
you
allow
you
to
monitor
all
the
metrics
and
then
see
what's
unusual
in
your
it
infrastructure
at
any
point
in
time.
Okay
and
the
nice
thing
about
this-
is
that
it's
completely
automated,
you
don't
have
to
tell
it
what
time
scale
or
you
don't
have
to
tell
it.
A
You
know
whether
it's
load,
balancer
or
database
data,
or
anything
like
that.
You
just
feed
in
you
know
hundreds
of
streams
of
data
for
each
one.
It
does
automatic
anomaly
detection
and
then
there's
a
really
nice
mobile
interface,
which
we
can
show
you
later
if
you're
interested,
which
you
know
sorts
all
of
your
metrics.
According
to
how
you
know
what
is
most
unusual
at
any
point
in
time.
So,
even
though
you
might
have
hundreds
of
machines,
you
can
just
very
quickly
and
efficiently
just
look
at
what's
unusual
right
now,
so
you
can.
A
You
can
just
focus
on
on.
What's
going
on,
we
also
have
an
api
to
feed
in
custom
metrics.
So
you
can
feed
in
data,
that's
not
from
cloud
watch,
but
your
own
data
and
you
can
feed
those
in
as
well,
and
that's
how
I
did
the
lindsay
lohan
thing
just
that
I
showed
earlier.
So
you
can.
You
can
feed
in
you
know
you
know
other
data,
that's
not
cloud
watch
data
as
well,
so
it's
really
kind
of
a
general
purpose.
A
I
wouldn't
say
general
purpose,
but
it's
a
it's
a
fairly
flexible
anomaly,
detection
platform
that
you
can
use
to
try
to
try
out
some
stuff
and
because
it's
using
new
pick,
it
has
all
of
the
advantages
of
the
cla
and
it
continuously
learns
and
adapts
to
changes.
It
deals
with
temporal
anomalies
and
so
on.
Okay,
so
let
me
show
you
a
couple
of
examples
of
what
we
can
detect
here.
So
this
is
the
essentially
the
same
kind
of
data
that
I
showed
earlier.
A
But
this
is
a
simple
case
where
we
detect
it
and,
as
you
can
see
once
it
detects
the
jump
it,
it
will
automatically
adapt,
and
this
is
now
the
the
new
normal.
But
at
least
you
you
get
an
alarm
when,
when
this
happens,
here's
another
case
where
the
cpu
usage
is
a
is
extremely
noisy
and
it's
sort
of
gradually
drifting
up,
and
you
know
after
a
while,
when
it
gets
beyond
kind
of
the
noise
period.
You
see
that
the
anomaly
score
goes
way
up,
because
now
it's.
A
Finally
you
know
it's
anomalous
at
this
point.
If
you
were
to
just
look
at
this
point
well,
it
could
still
be
part
of
the
noise,
but
once
it's
here
it's
definitely
anomalous
and
you
want
to
know
about
it,
and
this
kind
of
thing
is
quite
hard
to
catch
and
often
important
to
catch.
If
you
have
a
memory
leak
or
some
process
leak
or
something
like
that,
you
won't
be
able
to
catch
that
kind
of
stuff,
but
it
can
also
catch
some
pretty
subtle
changes.
A
So
here's
an
example
of
an
instance-
and
let
me
just
explain
the
display
a
little
bit.
This
is
one
server
that
it's
monitoring
and
these
are
different
metrics
that
are
associated
with
this
server.
So
there's
disk,
io
network
input
and
cpu,
and
it's
detected
an
anomaly
in
the
network
bandwidth
for
this
instance-
and
you
can
click
on
this
and
then
see
the
data
that
actually
led
to
this,
and
you
can
see
it's
this
very
bizarre,
dense
usage
here
and
there's
an
anomaly
right
in
the
middle
here.
A
These
are
like
regular
cron
jobs
that
do
a
backup
or
something
regular
intervals,
but
it
did
it
caught
an
anomaly
somewhere
in
here,
so
you
can
actually
drill
in
there
and
see
what's
going
on,
and
what
happened
is
that
when
you
go
to
the
daily
level,
you
can
see
that
there's
a
very
regular,
extremely
regular
pattern.
That
happens
very,
very
predictably
and
at
one
point
in
time
that
that
thing
happened
twice
and
it
caught
that.
So
it's
extremely
unusual,
given
how
regular
the
pattern
is
this
this
particular
thing
is
extremely
unusual.
A
If
this
had
been
very
noisy,
then
this
would
not
have
been
unusual.
It
wouldn't
catch
it,
but
because
it
was
so
regular
it
caught
it,
and
quite
often
we
find
that
when
this
kind
of
thing
happens,
it's
usually
you
know,
one
of
our
engineers
has
logged
into
the
system
and
is
doing
something.
That's
unusual
for
that
for
that
server,
so
detecting
these
kind
of
behaviors
is,
is
a
really
nice
feature
of
garage
here.
A
So
how
do
we?
How
do
we
do
this?
What
have
we
learned
in
the
process
of
using
new
pick
for
anomaly
detection?
Okay?
So
what
have
we
learned
from
grok?
So,
first
of
all,
again,
anomaly.
Detection
is
extremely
useful
as
I've
been
showing
you
real
world
data
is
really
really
noisy,
and
it
may
be
that
for
some
of
them
we
can
never
build
a
perfect
predictive
model.
A
A
Okay,
so
what
we
do,
is
we
compute
a
probability
model
of
the
anomaly
score?
We
see
what
what
are
the
average
values
of
the
anomaly
score
likely
to
be.
We
compute
a
model
of
that
and
then
given
a
new
set
of
not
recent
anomaly
scores
see
what
the,
how
likely
it
is
that
that
was
actually
predicted.
Actually,
let
me
just
have
a
slide
on
that.
So
what
we
do
is
for
every
new
data
point.
A
We
compute
the
anomaly
score
using
the
lpf,
exactly
like
I
showed
you
before,
and
then
we
estimate
the
probability
distribution
of
the
historical
anomaly
scores.
If
you
look
at
all
the
anomaly
scores
that
have
happened
up
to
this
point
in
time.
What
is
the
distribution
of
those
and
we
model
it
as
a
as
a
gaussian
today
and
then,
given
that
past
probability
distribution,
we
look
at
the
recent
anomaly
scores
and
see.
How
likely
is
it
that
that
previous
distribution
generated
this
recent
anomaly
scores?
Okay,
so
we
can
compute
a
likelihood
a
probability
for
that.
F
A
Yeah,
so
this
is
just
kind
of
stressing
that
a
single
anomaly
score.
You
know
you
cannot
threshold
or
use
a
single
anomaly
score
by
itself
when
you
have
inherently
noisy
data,
you
look
at
the
distribution
of
anomaly
scores
and
we
are
comparing
the
recent
distribution
against
the
long-term
historical
distribution.
A
Okay,
we're
not
doing
it
on
the
data,
we're
doing
it
on
the
anomaly
score
itself
and
that
you
know
that
trick
actually
helped
tremendously
in
some
of
the
the
data
sets
that
I
showed
you
and
I
think
in
a
practical
system,
you
at
least
with
the
the
state
of
newpick
today.
You'll
have
to
do
do
something
like
this.
So
let
me
give
you
a
couple
of
examples.
A
Here's
a
example
of
a
cpu
usage.
You
can
see
that
there's
here's,
you
know
one
type
of
behavior
and
then
it
starts
behaving
differently
and
then
it
spikes
up
again
and
here's
the
raw
anomaly
score
again.
You
can
you
can
see
it's
it's
definitely
it's
different
here
than
elsewhere,
but
if
you
were
just
to
do
a
threshold
on
the
anomaly
score,
you'd
pick
up
on
a
lot
of
extra
stuff,
but
when
you
run
it
through
the
likelihood
model,
you
can
see
that
it
really
teases
this
apart.
A
So
here
you
could
see
that
that
recent
distribution
of
anomaly
scores
is
extremely
unlikely,
given
the
past
distribution,
so
it
very
cleanly
picks
up
this
spike.
But
what's
also
interesting
is
that
there
are
a
couple
of
other
places
where
it's
also
high,
and
you
can
see
that
it
picked
up
on
this
square
behavior
here.
So
the
right
way
to
I
think
to
look
at
this
is
to
say
suppose
suppose
you're
here
at
this
point
happen
in
the
future.
You're
right
here,
you've
seen
this
and
you
see
this
square
up.
A
Is
that
an
anomaly
or
not,
and
I
think
you'd
say
it
is,
and
it
manages
to
pick
that
up.
It
also
picked
up
this
little
behavior
here
as
anomalous.
You
know
when
it's
changed
from
going.
I
don't
know
what,
from
this
kind
of
behavior
to
this
kind
of
more
cyclical
behavior,
I
picked
up
on
that
change,
but
then
that's
normal
now
and
it's
fine
and
then
it
picked
up
on
this
drastic
change.
A
A
A
You
know
notifications
or
alerts
or
whatever
you
want
to
do
with
the
anomaly
score
with
with
the
system
than
if
you
just
look
at
the
anomaly
score
itself
and
what's
also
kind
of
nice
is
you
can
actually
put
a
probability
measure
on
it,
so
you
can
say
you
know,
notify
me
if
you
know
there's
a
one
in
a
thousand
chance
of
this
happening.
So
you
know
you
can
kind
of
control
the
frequency
of
your
notifications
that
way,
naturally,
okay,
here's
the
other
example.
A
I
showed
you
where
you
have
extremely
random
data
and
when
you
run
it
through
grok,
you
can
see
that
the
likelihood
stuff
picks
up
that
regime
very
nicely
it.
You
know
it
picks
it
up
as
an
anomaly
and
you
can
kind
of
zoom
in
and
see
that
it's
able
to
do
it
actually
pretty
quickly
as
soon
as
it
starts,
these
latencies
start
slowing
down
a
lot.
A
More
often,
let's
see
this
is
the
windmill
data
that
I
had
shown
earlier,
and
you
can
actually
run
that
through
grok,
and
you
can
see
that
it
picks
up
the
anomaly
right
where
it's
the
wiggle
starts
to
happen.
This
is,
I
think,
a
stretched
out
version
of
this.
It's
a
little
hard
to
see,
but
this
this,
the
point
of
where
it
picks
it
up,
is
exactly
where
it
starts.
Wiggling,
more.
A
Okay,
so
the
anomaly
likelihood
code,
so
the
nominee
likely
scheme
has
proven
to
be
pretty
critical
instead
of
converting,
where
we
are
today
with
nupeg
into
a
practical
application
and
so
we're
actually
making
the
code
available.
It's
on
that
same
github
account
right
now,
I've
a
copy
of
the
code
there
that
you
can
take
a
look
at
it's
right
now,
just
a
self-contained
function.
It
takes
in
a
list
of
anomaly
scores
and
outputs
a
likelihood
for
them.
I
think
it's,
it
might
be
useful
to
look
at.
A
I
wouldn't
say
it's
in
a
super
easy
to
use
form.
Yet
it's
it's
in
kind
of
the
way
we
use
it
in
grock,
but
one
of
the
things
I
think
we
could
do
is
create
better
sample
code
around
this
and
then
maybe
integrate
it
directly
into
the
opf.
So
the
opf
itself
is
outputting,
not
only
just
the
anomaly
score,
but
also
the
likelihood
code.
So
then
you
can
you
know
you
can
decide
which
one
you
want
to
use.
A
Because
I
mean
the
brain
is
not
doing
the
nominee
likelihood,
but
you
know
we're
able
to
see
these
anomalies,
so
there's
got
to
be
a
eventually
a
better
way
to
do
it
yeah,
but
I
think
you
know
in
terms
of
building
a
practical
product
with
today's
code.
This
is
a
pretty
good
scheme,
I
think,
but
I
wouldn't
say
it's
the
be
all
and
end
all
of
every
thing.
A
Okay,
so
that's
one!
Probably
the
biggest
thing
we've
learned
in
in
building
the
practical
system
is
that
data
sets
are
really
noisy
you,
don't
you
can't
threshold
the
anomaly
score,
but
building
this
kind
of
probabilistic
model
really
helps
you
kind
of
tease
apart,
where
the
changes
actually
are
and
by
the
way
the
the
simplest
stuff
also
works
with
this.
A
A
Okay,
so
the
second
thing
we
learned
is
a
little
bit
about
swarming.
So
what
about
swarming?
We
talk
a
lot
about
swarming.
So
swarming
is
an
automated
parameter
selection
mechanism
in
newpick,
so
it
basically
allows
you
to
run
hundreds
of
models
with
many
different
permutations
of
the
encoder
parameters,
the
spatial
puller
parameters
and
so
on,
and
it
picks
the
best
model
and
the
best
combination
of
feels
that
that
gives
you
the
best
predictability.
A
So
in
swarming
is
actually,
if
you
run
it,
it's
a
pretty
time
consuming
process
and
it
it's
really
impractical
to
use
it
in
in
a
product
if
you
want
to
get
results
very
quickly.
So
what
we
do
in
grock
is
we
actually
use
a
single
pre-swarm
parameter
set,
and
we
can
do
this
because
we
have
a
very
constrained
kind
of
setup
within
grok,
so
we
have
a
very
fixed
set
of
fields.
We
have
the
timestamp
and
the
metric
value.
A
We
have
data,
that's
fed
in
every
five
minutes,
and
what
we
found
is
that
the
single
pre-sworn
parameter
set
works
really
well
across
different
data
sets
as
long
as
they
have
kind
of
these
two
characteristics
here.
If
you
can
fit
it
in
here,
it
seems
to
work
pretty
well.
You
can
still
do
better
if
you
swarm,
but
the
improvements
is,
you
know
incrementally
pretty
small.
So
you
know
this
was
a
really
huge
step.
A
One
of
our
interns
actually
figured
this
out
last
year
and
it
just
made
a
whole
bunch
of
problems
go
away
when
in
in
doing
doing
a
production
system,
so,
at
least
within
this
constraint
set
you
can
use
a
single
pre-swarm
parameter
set,
I
think
in
general
you
will
still
need
to
swarm
or
do
some
sort
of
model
selection.
I
think
there's
a
great
set
of
tutorials
online,
put
together
by
madden
there's
lots
of
people
here
who
can
help
you
if
your
data
can't
fit
into
this
format.
A
You'll
probably
want
to
do
some
swarming,
but
the
good
thing
is
what
this
really
taught
us
is
that
the
system
is
pretty
insensitive
to
small
parameter
changes.
You
know
if
the
structure
of
your
system
is
of
your
problem
is
not
changing
much
then
you
may
not
need
to
swarm
too
often
you
can
swarm.
You
know
once
or
twice
and
just
use
that
model
parameters.
So
it's
this
was
a
a
really
nice
kind
of
learning
that
we
had
last
year.
F
Yeah,
I'm
just
going
to
add
something
on
top
of
that,
the
comment
and
the
second
bullet
up
there,
where
it
says
fixed
set
of
fields.
It
was
interesting
with
this
intern,
who
did
this
determined
this
by
looking
at
data
that
was
unrelated
to
what
brock
looks
at,
and
so
I
want
to
make
it
clear
that
the
the
pre-swarmed
model
is
not
pre-swarmed
on
the
data
we
actually
use
in
grok
for
servers
right.
It
basically
seems
to
be
independent
what
the
data
represents.
F
F
F
F
D
F
A
Yeah
and
you
could
see
that
with
the
windmill
data
that
I
passed
in,
you
know
I
worked
on
that
it
was
never
swarmed
on
that
it
wasn't
swarmed
on
the
I.t
data.
I
didn't
know
anything
about
lindsay,
lohan
or
anything,
but
it
you
know
as
long
as
it
fits
into
this
format,
it
seems
to
work
pretty
well,
and
you
know
that
might
be
important.
You
know,
if
you
you
know,
for
the
hackathon,
if
you
think
about
anomaly,
detection
and
projects,
if
you
can
fit
it
into
this
format,
you
can
just
avoid
swarming.
A
Okay,
so
that's
grok,
and
so
you
know:
where
do
we
go
next?
You
know,
I
think,
we've
seen
that
the
cla
is
proving
to
be
really
good
at
detecting
anomalies
in
a
large
range
of
data
sets
that
we've
tried
so
far
and
within
the
context
of
grok.
It's
fully
automated
there's
no
parameter
tuning
whatsoever.
A
A
We
can
get
better
and
better
at
this
this
process,
but
at
the
same
time
it's
clear,
I
think
we're
just
scratching
the
surface,
there's
so
many
other
types
of
data
and-
and
you
know
multivariate
anomalies
and
all
sorts
of
stuff
that
we
haven't
really
sorry
to
capture,
let
alone
you
know
you
might
want
to
do
anomaly,
detection
on
text
streams,
you
know
using
the
sept
api
or
some
you
know,
there's
anomaly
detection,
I
think
again
is
a
very
fundamental
capability.
So
I
think
we've
just
started
scratching
the
the
surface
of
this.
A
A
A
So
this
is
something
that
we're
just
getting
started
on.
We're
hoping
it'll
be
useful
to
the
newpick
community
as
well
and
hoping
you
guys
can
contribute
to
it
as
well.
Please
see
ian
danforth
who
actually
stepped
out
for
a
couple
hours
but
he'll
be
back
again
he's
the
main
person
putting
this
together
for
us
or
see
me
or
any
one
of
us.
A
If
you're
interested
in
kind
of
contributing
to
this
okay
and
then
last
slide
a
couple
of
resources,
jeff
wrote
a
white
paper,
the
science
of
anomaly
detection,
which
is
on
our
website,
which
covers
a
lot
of
the
the
topics
I
I
spoke
about.
So
you
should
definitely
download
and
read
that
there's
the
github
repository
again
and
here's
a
kind
of
a
random
thing
if
you're
interested
in
other
machine
learning
techniques
for
anomaly
detection.
This
is
a
pretty
nice
survey
of
that.
A
G
D
A
E
D
A
Yeah,
that's
right!
So
the
question
is,
you
know
we
don't
turn
learning
on
off
at
all,
so
you
know,
wouldn't
it
learn
the
anomalies
and
it
it
does,
and
you
know
so.
If
a
particular
pattern
happens
more
than
a
couple
of
times,
it's
not
going
to
be
flagged
as
an
anomaly,
and
so
there's,
actually
you
know
in
most
cases,
that's
what
you
want.
Like
you
saw
in
that
step
up
function,
you
don't
want
to
keep
giving
alarms
continuously.