►
From YouTube: 2021-12-16 meeting
Description
No description was provided for this meeting.
If this is YOUR meeting, an easy way to fix this is to add a description to your video, wherever mtngs.io found it (probably YouTube).
A
A
E
A
A
E
F
A
A
C
A
C
C
A
A
A
D
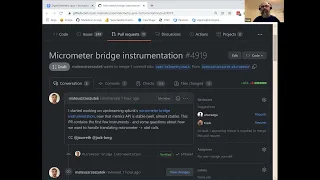
I
I
have
it
so
that
I
could
create
this
draft
just
before
this
meeting,
so
I
just
very
recently
started
working
on
upstreaming
our
meter
bridge
instrumentation.
We
use
micrometer
internally
in
splunk
agent
to
send
some
metrics
and
we
had
a
micrometer
instrumentation
that
breached
the
micrometer
from
the
application
to
the
micrometer
in
our
agent,
which
is
really
similar
to
how
open
telemetry
api
bridge
instrumentation
works
in
in
the
upstream
agent,
and
now
that
matrix
api
is
stable.
D
We
want
to
upstream
that
and
slowly
start
moving
our
stuff
to
the
upstream
we
go.
So
this
is
like
the
first
step.
Maybe
half
of
the
first
step
and
well
translating
micrometer
to
micrometer
was
pretty
simple.
I
mean
these
were
the
same
objects
just
in
different
packages,
because
one
was
shaded,
but
hotel.
D
No
micrometer
to
auto
is
is
a
bit
more
complicated.
So
I
added
this
pr.
It
contains
like
three
different
instruments
I
used
counter
gauge
and
timer
counter
engage
are
pretty
straightforward.
They
have
like
pretty
much
one-to-one
equivalence
with
open
telemetry,
which
is
not
the
case
for
it
for
timer,
because
timer
in
micrometer
exports,
oh
yeah,
that
that
was
it's
blank.
A
D
A
D
D
D
D
Let
me
check
that
but
yeah,
something
like
that.
The
timer
is
a
bit
more
complex
because
in
micrometer
timer
exports
free
signals.
It
exports
the
total
time
the
max
time
in
the
count,
and
aside
from
that,
it
also
supports
micrometer
histograms,
where
you
can
define
like
slos
or
instagram
number
percentiles
that
you
want
to
capture
in
in
buckets
and
micrometer,
then
creates
gauges
for
each
packet.
D
D
I
think
either
bundles
or
has
a
separate
jar
that
basically
forwards
micrometer
metrics
to
drop
wizard
matrix
registries
and
they
use
the
they
basically
implemented
timer
in
a
way
that
just
uses
an
existing
histogram
with
instruments.
And
if
you
define
micrometer,
if
you
pass
any
histogram
distribution
settings
to
micrometer,
then
it
also
creates
those
additional
gauges.
D
So
it
I
use
the
same
behavior
here
so
that,
possibly,
if
you,
if
your
application,
defines
a
timer
that,
for
example,
defines
several
service
level
objectives
and
you're
also
using
like
custom
views,
then
you
will
have
like
duplicated
histograms.
But
I
I
guess
this
is
probably
fine,
because
it's
it's
not
possible
to.
D
I
Right
now
in
the
agent,
but
absolutely
should
it
be
yes
yeah.
So,
like
though
this
is,
this
is
a.
We
should
I'd
love
to
talk
more
about
that.
This
is
amazing.
By
the
way
I'm
super
excited.
Thank
you.
Views
are
meant
to
solve
that
problem
of
I
I
need
to
export.
You
know
max
as
its
own
gauge
or
count
as
its
own
gauge
or
like
a
percentile.
I
We
we
only
specified
like
four
kinds
of
aggregation,
so
the
like
percentile
aggregation
that
is
computed
client-side
is
not
there.
So
it's
just
not
a
feature.
Hotel
has
the
idea,
so
you
know
you
could
take
two
approaches
here
of
one
is:
if
micrometer
someone
says
that
they
want
a
percentile
gauge
exported
and
they're
using
hotel
hotel
exports,
a
histogram.
Sorry
like
that's,
that's
just
an
unsupported
feature,
initially
option
number
two
is:
we
can
actually
look
into
starting
to
specify
sdk
hooks
where
you
can
provide
the
views.
I
I
If
we
had
a
way
to
basically
get
those
percentiles
back
out
for
users
who
want
to
preserve,
you
know
old,
behavior
and
slow
migrate,
you
know
that'd
be
amazing,
but
we're
just
missing
it
right
now
in
the
sdk,
but
I'd
love
to
get
it
added
and
make
sure
we
support
that
use
case
yeah.
That
would
be
awesome.
B
D
B
Yeah,
like
I
thought
I
thought
like
with
the
way
I
was
reading,
what
you
were
saying
is
you
know
you
take
this.
This
histogram
from
from
micrometer,
which
has
more
information
than
our
histograms
and
open
telemetry
have,
and
you
translate
that
to
an
open,
telemetry,
histogram,
plus
some
additional
instruments
to
capture
the
information.
D
D
I
I
For
for
the
timer,
you
actually
can
specify
a
timer,
and
you
specify
the
timer
with
your
kind
of
aggregation
that
you
want
right.
That's
that's!
That's
what
we
would
call
it
so
like.
That's
all
your
histograms.
We
had
this
thing
called
a
hint
api
that
was
meant
to
allow
you,
when
you
instrument
to
say
here's
the
views.
I'd
like
you
to
use
if
possible,
right
and
then
the
you
would
do
this
all
in
the
api.
So
you
could
say
like
hey,
this
is
a
histogram,
but
you
should
export.
I
I
But
what
if
we
allowed
some
configuration
as
an
optional
thing,
when
you
create
the
instrument
that
got
cut
so
we
don't
have
it,
but
that's
what
I'm
suggesting
is.
If
we
understand
what
you
need
here,
the
one
of
the
goals.
I
think
that
riley
had
was
to
get
him
api
back
in
starting
next
year
into
the
api
once
the
sdk
is
stabilized.
I
I
think
what
was
proposed
would
not
have
allowed
you
to
solve
this
problem,
but
it
really
should
have
right
and
so
like.
I
have
the
same
issue
with
open
census,
actually
so
open
census.
There
is
no
instrument,
there's
just
measurements
and
everything's
a
view,
and
I
have
no
way
to
bridge
the
two
at
all.
So
we
went
with
a
completely
different
approach
so
anyway,
sorry,
I'm
talking
too
much.
D
Yeah,
and
just
just
by
the
way,
my
computer
also
has
measurements,
which
I
just
completely
ignored,
because
they
don't
really
need
to
be
read
by
by
our
metrics
registry
and
well,
we
can.
We
have
no
way
of
reading
them,
retrieving
the
data
from
the
api
so
and
yeah,
so
the
hint
api.
I
think
it
if
it
would
be
possible
to
translate
all
those
histogram
aggregation
settings
then.
I
I
I
do
want
to
get
percentile
calculation
in
client
added
back
in
at
some
point.
If
it's
a
mandatory
thing
for
users,
I
think
it's
better
to
do
it
in
the
server.
But
if,
if
people
want
it
client-side
we
can
totally
do
it.
Can
you
open
an
issue
that
describes
something
for
people
who
don't
have
context
on
micrometer
or
java
in
the
spec
around?
Like
hey,
I
tried
to
do
bridging
here's.
The
issues
I
ran
into,
I
feel
like.
We
need
a
solution
to
this.
B
And
just
to
confirm
so
these
the
percentiles
that
are
being
emitted
from
these
micrometer
histograms.
It's
something
like
you
know.
You
tell
micrometer.
I
want
you
to
also
emit
the
75th
percentile
of
this
timer
and
then
it
it
says:
okay,
yes,
and
it
like
when
you
export
it,
it
emits
okay,
the
70th
percentile
for
this
window
was,
you
know,
88
milliseconds
or
something
yeah.
That
okay
and
you
know
pretty.
B
B
Yeah,
so
I
guess
what
we
should
probably
look
to
understand.
Josh
is
like
we
should
probably
study
what
a
micrometer
histogram
consists
of
and
just
like
see
if
all
of
the
settings
can
translate
to
things
that
you
could
do
with
a
vue
in
open
telemetry,
because
if
there's
not
a
one-to-one,
then
you
know
it
doesn't
really
matter
what
the
hint
api
provides.
We
can't
do
it.
I
If
you
look
at
the
aggregations
we
have
available
in
our
api,
it
is
optimized
around
only
exporting
otlp
and
doing
everything
else
in
like
a
collector,
but
in
practice
I
think
we
might
need
to
offer
more
client-side
telemetry,
especially
for
java.
If
you
look
at
drop
wizard,
if
you
look
at
micrometer
like
there's
an
expectation
there,
but
we
only
have
the
minimum
right
now.
A
A
D
A
F
I
Okay,
I
wrote,
I
wrote
my
thoughts
in
the
bug
it.
I
know
that
john
you
and
anurag
both
thumbs
it
up.
So
I
I'm
just
curious.
If
anyone
has
anything
they
want
to
talk
about
here,
we
did.
If
I
recall
correctly,
we
had
almost
exactly
the
same
discussion
with
the
same
proposal
in
the
sake
but
effectively.
I
The
question
here
is:
there's
a
concern
around
the
fact
that
our
counter
returns
a
int
counter
and
has
an
of
doubles
in
the
builder
to
switch,
and
then
our
histogram
and
gauge
return,
double
recording
things
and
have
of
longs
or
events.
I
forget
which
one
it
is
to
switch
and
that
that's
inconsistent
and
hidden
and
confusing
to
users.
I
D
B
J
It
was
okay,
once
I
got
my
head
around
it,
I
I
used
bind
in
a
couple
of
places,
but
it
wasn't.
It
wasn't
super
essential.
My
my
my
feeling
is,
you
know,
providing
me
document
this
stuff
properly
and
actually
get
a
good
introductory
user
guide
to
it.
Then
I
think
it
will
be
fine
it.
It
was
a
little
counter-intuitive
at
the
start,
but
once
I
I
bashed
my
head
against
it
for
the
for
the
requisite
period
of
time.
I
I
thought
it
was
a
pretty
decent
api.
I
Did
you
get
hung
up
by
of
double
and
oblong,
like
was
that
you
said
you
had
to
bash
your
head
against
it?
Was
it
more?
One
of
our
assumptions
is
that
picking
instruments
is
the
confusing
part.
We
want
users
to
think
through
what
that
is
picking,
whether
you're,
recording
a
double
or
long
is
not
really
that
important
to
most
people,
and
we
wanted
a
good
default.
So
I'm
kind
of
curious
how
true
that
is.
J
A
A
I
I
I
Google
cloud
monitoring
is
one
of
those
systems
where
we
can
actually
store
integers
and
doubles
separately.
You
get
the
precision
of
an
int
when
you
store
an
int,
you
get
the
precision
of
double
when
you
store
a
double
in
practice,
though,
like
there
are
times
where
it
matters,
and
it's
not
significant
enough
that
I
even
care
for
the
most
part
for
instrumentation.
If
we
went
with
a
all
double
solution,
it
wouldn't
be
the
end
of
the
world
for
open,
telemetry
and
it'd,
be
in
line
with
other
things.
I
I
A
A
I
I
don't
think
it's
a
we
have
we
have
our
championship,
volleyball
game,
so
I
don't
know
if
I'm,
if
I'll
make
it
or
not
depends
yeah
thanks,
yeah
man,
recreational
volleyball,
it's
totally
a
thing,
so
if,
if
I
do
make
it
cool
my
my
current
thinking,
though,
is
that
we
had
already
discussed
this.
I
think
most
of
us
are
on
board.
That
of
doubles
and
of
longs
is
not
the
problematic
part
of
our
api.
I
yeah
the
I'm
more
worried
about
up
down
counter
honestly,
but.
A
Close
to
the
right
too
many
tabs,
okay
onto
logging,
there's
been
some
good
progress
in
the
in
the
sdk
repo,
also
with
logging.
I
think
we're
kind
of
all
chipping
away
at
it.
If
you
have
a
chance.
This
is
the
kind
of
appender
api
that
we've
discussed,
which
we
need
in
the
instrumentation
repo,
because
we
don't
want
instrumentation
to
depend
on
the
sdk
directly
on
the
sdk.
A
Well,
you
could
at
later
on
at
run
time,
so
that
that's
certainly
an
option,
and
then
this
will
allow
us
to
bridge
in
the
agent
is
also
why
we
need
a
api
to
be
able
to
bridge
into
the
agent
very
similar
to
helmet.
Ish
was
describing
the
micrometer
bridge
bridging
into
the
agent
so
yeah.
If
you
have
a
chance
to
take
a
peek
at
this,
I'm
sure
this
will
evolve
over
time
as
we
get.
It
looks
like
we're
getting
possibly
a
global
in
the
sdk.
A
B
A
A
H
Yeah
really
really
quick.
I
opened
an
issue
on
the
other
configuration
size
and
I
wanted
to
to
know
your
opinion
about.
It
is
because,
in
the
open
telemetry
for
the
tracer
configuration,
we
are
registering
a
shutdown
hook
for
jvm
to
call
dot
close
on
the
tracer
or
actually,
then
it
calls
the
the
dot
close
on
the
on
the
worker
thread
that
exports
all
the
spans
right.
H
H
So
it
means
that
on
the
auto
configuration
side
of
things,
you
cannot
call,
or
you
cannot
register
the
shutdown
hook
for
a
dot,
close
method
on
on
the
tracer,
meaning
that,
on
the
auto
configuration
side,
you
have
to
have
a
way
to
exclude
the
registration
of
the
shutdown
hook,
but
the
tricky
part
is
then
you're
able.
Then
you
require
to
have
an
instance
of
the
tracer
or
actually
is
the
sdk
tracer
provider,
because
that's
the
one
that
implements
closable
to
be
able
to
call
dot
close.
H
A
I
I
Yeah
yeah,
but
the
issue
is
like
flush
and
close
are
only
available
in
the
sdk
and
we
never
exposed
the
sdk
ever.
That
was
like
considered
a
thing
java
doesn't
do
so
like
anyone
who's
doing
anything
manual
just
cannot
close
or
flush
any
sdk.
It's
not
just
tracers,
it's
metrics
and
I
I
don't
know
what
logs
looks
like,
but
probably
logs.
If
that
has
a
flush
or
a
close,
so
I
think
it's
just
like
it.
I
I
ran
into
this
as
well.
B
H
B
I
wait.
I
must
be
missing
something
because
if
you
call
like,
I
thought
you
were
calling
auto
configured
open,
telemetry
sdk
initialize
at
the
beginning
of
your
application,
yeah,
and
if
you
call
that,
then
you
can
call
after
that.
You
have
an
instance
of
auto
configured,
open,
telemetry
sdk,
and
from
that
you
can
get
an
open
telemetry,
sdk
instance,
and
from
an
open
telemetry
sdk
instance,
you
can
get
like
sdk
tracer
provider
without
any
obfuscation
or
reflection.
A
B
Yeah,
so
if
you
have
a
auto
configured
open
telemetry
sdk
instance,
you
can
set
that
globally,
wherever
you
want
or
statically
wherever
you
want
and
then
access
it
and
it's
and
therefore
you
have
like
a
static
accessor
for
the
sdk
tracer
provider
or
whatever
you
want
now
we
still
don't
solve
your
problem
of
you
know.
We
still
have
that
shutdown
hook.
That's
added
and
there's
no
way
to
not
add
that
or
is
it
would
you
want
to
remove
that
shutdown
hook,
or
would
you
just
want
to
when.
H
H
If
you
only
have
the
object
directly
now
on
the
on
the
other
configuration
side,
I
think
there
needs
to
be
a
way
for
you
to
optionally,
not
register
the
shutdown
hook
right,
so
it
can
still
be
as
a
default,
but
then
even
either
on
the
api.
I
have
a
way
to
say:
do
not
register
the
shutdown
hook
or
just
have
a
configuration
to
skip
the
registration.
A
H
H
A
A
A
A
B
So
so
the
the
agent
listeners
can
have
access
to
the
resource
so
auto
configured
open,
telemetry
sdk
gives
you
access
to
the
resource,
along
with
just
the
open,
telemetry
sdk.
So
therefore
sdk
tracer
provider,
sdk
meter
provider
and
and
so
now
we
can
safely
and
that's
a
that's
a
use
case
in
in
the
splunk
distribution.
B
E
A
E
D
So
I
I
right
now
I
prefer
using
config
in
the
agent
because
it
has
config
properties
is
not
safe.
If
you
call
a
method
on
it,
and
you
know
somebody
configures
an
integer
which
is
not
actually
integer,
you
get
the
config
files
exception
or
whatever,
while
the
java
agent
config
doesn't
throw
ever,
it
will
return
the
default
value
that
you
that's.
The
user
of
this
api
have
provided
so
it's
very
safe
to
use
in
sites
instrumentations
like
if
you're
injected
into
some
third
party
class.
B
Not
I
can't
address
the
global
piece,
but
I
suppose
the
the
exception
free
accessors
and
the
optional
aspect
that
you
mentioned.
Those
are
those
are
definitely
nice
usability
things.
You
could
probably
get
away
with
some
utility
functions
that
accepted
config
properties
and
applied
those
you
know
it
wouldn't
be
as
user
friendly,
but.
D
Yeah,
I
I
also
thought
about
maybe
just
slightly
refactoring
config
so
that
it
doesn't
have
like
its
own
copy
of
the
whole
configuration,
but
it's
just
a
like
a
safe
wrapper
over
complete
properties,
but
we
would
have
to
pretty
significantly
remodel
the
whole
edge
agent
initialization
procedure.
But
I
think
that
that
would
be
possible
too.
E
E
A
A
A
But
then
there
was
also
a
bug
in
this
version
that
was
fixed
in
this
version
so
that
the
library
instrumentation
really
only
worked
in
this
version,
but
in
auto
instrumentation
we
injected
the
library
over
here.
So
that
was
just
a
mess.
So
we
decided
to
take
advantage
of
the
fact
that
nobody
should
be
using
library
instrumentation
on
anything
less
than
216.
Now
so
library
instrumentation
now
targets
auto
instrumentation,
still
targets
2,
7
and
above
but
starting
at
216.