►
From YouTube: Medical images analysis has to scale, let’s automate it!
Description
See a demo on how to scale medical imagery by using edge computing
Learn more at openshift.com/edge
A
Medical
images
analyses
has
to
scale
so,
let's
automate
it
hi.
My
name
is
guillaume
mutier.
I
am
a
technical
evangelist
at
red
hat
in
the
storage
business
unit.
So
what
are
we
trying
to
achieve?
What
is
our
problem?
Let's
say
we
are
at
a
hospital
and
we
have
x-ray
images
to
review
well.
Of
course,
an
aiml
model
can
definitely
help,
but
how
can
we
efficiently
analyze
the
images
as
they
come
in
for
a
continuous
flow
of
thousands
of
images?
A
A
So
here
is
the
workflow
of
the
demo.
Imagine
we
are
at
a
hospital,
that's
a
range
location.
We
will
send
a
flow
of
x-ray
images
inside
a
safe
object,
storage
bucket.
This
will
automatically
trigger
a
notification,
and
this
message
will
be
sent
to
kafka
topic
using
connective
eventing
with
a
subscriber
to
this
topic.
Creative
serving
will
launch
one
or
many
parts
depending
on
the
load.
A
A
Of
course,
this
risk
assessment
pipeline
can
be
reproduced
at
many
other
locations
at
the
edge
each
one
benefiting
from
this
shared
model
training.
Let's
go
see
it's
running.
First,
let's
take
a
look
at
my
openshift
environment.
In
my
project,
I
have
an
image
generator
which
will
generate
these
flow
of
images
that
are
sent
to
our
sf
bucket.
A
I
have
a
kafka
topic
subscriber
that's
part
of
cognitive
eventing,
and
I
have
my
cognitive
serving
risk
assessment
service.
Okay,
and
for
this
demo
you
know
I've
merged
the
two
functions
of
the
risk
assessment
of
the
anonymization
of
the
image.
But
that's
that's
for
the
the
sake
of
this
of
this
demo.
A
I
have
also
in
my
project
deployment
of
grafana,
where
I
will
have
this
dashboard,
where
we
will
be
able
to
monitor
this
flow,
we'll
see
it
in
in
a
moment,
and
I
have
also
some
helpers
a
database
where
I
will
record
all
the
events
happening.
So
all
the
images
coming
in
processed
and
anonymized-
and
I
have
a
small
helper
here-
it's
an
image
server
that
will
allow
us
to
see
those
live
images
coming
into
graphene.
A
A
And
now
that
the
processor
started,
let
me
give
you
a
quick
tour
of
this
of
this
dashboard,
so
here,
of
course,
you
can
see
the
the
pipeline
live
with
the
number
of
images
that
are
uploaded,
the
imf,
images
that
are
processed
and
eventually
the
number
of
images
that
are
anonymized.
So
that's
when
the
model
again
is
unsure
of
its
certainty.
A
We
have
here
a
panel
with
the
cpu
and
ram
usage,
a
panel
with
the
number
of
containers
that
the
risk
assessment
parts
are
running
and
the
number
of
diploma
deployments
it
uses.
So
you
see
it
has
some
slight
delay
in
displaying
the
the
result,
but
we
can
see
here
that
we
have
one
replica
of
the
risk
assessment
part
which
contains
two
containers.
Okay,
we
have
also
here
a
panel
that
gives
the
risk
distribution
for
the
model
with
the
normal
pneumonia
or
unsure
assessment,
and
the
number
of
images
that
are
processed
by
model
version.
A
A
A
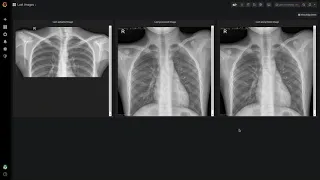
Okay,
so
here
you
have
the
the
kind
of
images
that
are
uploaded
so
a
pure
x-ray
image,
with
some
personal
information
here
at
the
bottom
left
that
gives
the
name
and
date
of
birth
and
and
other
information
here,
that's
how
we
process
the
image.
So
what
we
do
we
make
a
risk
assessment
here
and
we
print
it
on
on
top
of
the
image.
A
So
that's
what
it's
printed
here
and
sure,
with
the
risk
of
steve
72,
we
are
unsure
because
it's
in
it's
less
than
80
of
certainty,
but
we
still
have
this
personal
information
written
here
in
in
the
bottom.
So
what
we
do
in
the
process
is
that
we
anonymized,
we
anonymize
the
images
by
blurring
here.
This
part
where
the
personal
information
are,
and
if
we
go
back
to
our
main
panel,
we
will
see
also
that
we
change
the
the
name
of
the
images
themselves.
A
A
So
you
see
our
process
is
going
well,
but
I
will
try
to
put
some
more
pressure
on
it
by
sending
10
images
per
second
and
we'll
see
how
it
scales
and
what
I
will
do
at
the
same
time
is
also
change
the
the
version
of
the
model
we
use.
So
let's
say
we
have
received
those
images
at
our
data
science
lab
and
we
have
trained
a
new
model
and
this
model
now
will
be
pushed
to
to
a
repo
which
will
trigger
a
change
of
model
that
is
used
here
in
our
pipeline.
A
We
have
now
two
deployments
of
our
risk
assessment
pod
to
be
able
to
to
to
handle
this
load
and
at
the
same
time,
we
can
see
that
we
have
switch
models.
So
now
we
are
using
the
version
2
model
to
process
our
our
images.
Okay,
we
could
also
increase
increase
this
rate
many
more
times
or
we
could
put
it
down
to
zero
and
those
pods
will
just
go
down
to
zero
and
our
resources.
Consumption
would
go
to
zero.
That's
that's
how
canadian
serving
works,
so
we
can.
A
The
the
the
whole
pipeline
we
scale
accordingly,
we
have
also
made
a
change
in
the
model
that
that
we
are
using
and
we
can
see
that
there
was
no
no
involvement
of
any
team
to
be
able
to
to
re-redo
this
pipeline.
Everything
has
been
fully
automated,
so
that's
exactly
how
you
can
scale
your
your
data
pipelines
for
data
science,
for
example.