►
Description
No description was provided for this meeting.
If this is YOUR meeting, an easy way to fix this is to add a description to your video, wherever mtngs.io found it (probably YouTube).
A
All
right,
let's
get
started,
hey
everyone
thanks
for
attending
the
harvard
community
meeting
the
agenda
for
today
is
one
of
birmingham's.
Tencent
will
talk
about
the
upcoming
work
that
we're
doing
for
prometheus
integration
to
you
know,
collect
metrics
for
prometheus
and
still
can
have
you
know
more
better
monitoring
of
the
harvard
system
of
the
the
registry
itself,
as
well
as
the
underlying
environment,
the
kubernetes
kubernetes
cluster
itself.
A
A
Also,
there
was
a
recent
announcement
from
dockerhub
on
the
raid
limiting,
so
you
will
be
re-eliminated
based
on
the
number
of
polls
for
both
authenticated
requests
as
well
as
anonymous,
and
so
I
just
want
to
say
you
know
we
we
users
have
been
coming
to
us
with.
You
know,
problems
of
being
rate
limited
or
ip
banned,
and
so
we
worked
on
the
proxy
cash
sort
of
in
anticipation
of
this,
not
this
announcement.
But
you
know
this
development
and
you
know
so
now
that
you
have
proxy
hashing
2.1.
A
These
new
limits
imposed
by
docker
hub-
essentially
you
know,
by
by
pulling
into
a
proxy
you're
minimizing,
reaching
out
to
docker
hub
to
get
the
image
if
the
image
is
cached
in
your
environment
already
and
it'll
just
serve
that
directly.
Instead
of
you
know
going
out
to
to
get
the
image
from
docker
hub,
we
are
making
an
improvement
to
the
proxy
cache
in
the
2.2
or
the
2.1.1
patch
release,
rather
because
the
rate
limiting.
A
Even
if
the
image
hasn't
been
updated,
we're
still
reaching
out
to
the
upstream
registry,
in
this
case
docker
hub
to
do
a
comparison
to
see
if
digest
has
been
updated
to
determine
if
we
have
to
re-pull
the
image.
So
we're
making
a
small
change
to
to
make
that,
because
it's
using
a
get
request
right
now,
we're
gonna,
you
know,
make
it
into
a
head
request,
and
so
hopefully
that
will
that
won't
trigger
the
rate
limiter.
In
that
sense,.
B
Yep,
okay:
let's
get
started
and
yeah
I
wanna
in
in
this.
In
the
next
release,
we
propose
to
provide
the
metric
features
for
the
harbor
and
and
the
background
for
the
for
the
harbor
matrix
is
because
the
council
is
a
cloud
related
in
the
cloud
native
community.
Almost
all
the
applications
provide
the
metrics
and
the
matrix
is
really
important
for
the
for
the
in
production.
B
It
is
very
important
in
production
operation,
so
it
also
a
lot
of
issue
open
in
the
hubble
repository.
So
we
just
want
so
we
plan
to
provide
the
promise
use
metrics
in
the
hubble
in
the
length
release
and
okay,
so
that
the
first
thing
is
that
we
what
contents
we
we
can,
we
will
expose
and
the
currently
I
I
just
need
some
some
here
and
we
can
comment
on
the
proposals
pr
and
to
enrich
this
list,
and
currently
I
I
wanna
expose
the
runtime
informations
other
promises.
B
Job
a
library
express-
and
the
second
thing
to
expose
is
some
metric,
some
performance
metrics
about
the
api
like
the
api,
latency
and
the
request
in
flight
or
and
the
rps,
or
something
like
that-
that
the
total
number
of
requests
not
like
this,
and
the
next
thing
is
some
components
also
provide
provided.
The
distribution
information
is
like
a
docker
distribution
and
we
will
enable
it
and
expose
it,
and-
and
there
are
some
other.
B
Metrics,
like
related
to
the
business
logics
and
like
the
the
total
pro
for
pro
number
and
post
number
in
projects
or
something
like
that.
This
kind
of
data
is
already
exist
in
our
database
and
we
want
to
expose
them
in
harbor
and
the
okay.
Let's
talk
about
how
to
expose
them
and
the
runtime
information
is
pretty
easy.
The
goal
sdk
is,
can
expose
them
directly
and.
B
The
api
request,
the
performance
metrics,
are
related
to
the
apis.
We
can
write
a
middleware
and
to
record
the
start
time
and
in
the
time
and
expose
them
with
with
the
go
sdk
from
issues
and
and
the
other,
the
other
thing
to
mention
we.
We
need
to
open
another
port
for
the
harbor
to
expose
the
metrics.
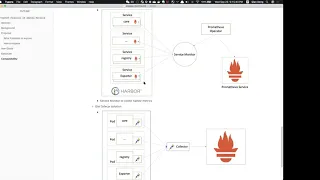
B
In
order
to
avoid
confused
of
the
normal
api
and
the
metric
api,
this
is
the
draft
of
the
architecture
of
the
hubble
matrix,
and
we
in
in
every
component,
so
we
will
add,
will
add
the
metrics
in
them
and
expose
by
promiscuous
sdk
and
the
religious
tree
were
exposed
by
itself
and
we
also
provide
exporter.
The
exporter
is
a
is
another
container
or
another
service
in
which
collects
all
the
metrics
from
the
harvard
database
and
expose
them.
B
And
besides
that,
we
also
introduced
the
one
new
component
is
collect.
The
collector
will
collect
all
the
metrics
from
the
hardware
components
and
expose
them
with
a
one-in-one
api
to
expose
them
to
publish
use
and
the
collector
will
use
the
open,
telemetry
collector,
because
it's
already
here
and
we
can
just
use-
use
the
use
the
hotel
collector
to
to
collect
them,
and
it
also
supports
another
another
format
like
open,
sensors,
open
animatry,
or
something
like
that.
So
we
cannot.
We
can
comfortable
with
other
systems
other
than
prom
issues.
If,
if
we
want.
B
B
I
think,
most
of
the
time
where
people
will
use
a
hubble
in
ig
environment
in
kubernetes
and
so
in
kubernetes
way.
We
we
can
also
use
calendar
solution,
because
if,
if
the
hardware
is
installed
in
the
same
class
with
your
prom
issues,
we
can
using
from
issues
operator
and
the
service
monitor
to
collect
the
data.
B
B
And
they
send
the
need
to
collect
and
collect,
expose
the
metrics
to
the
outside
the
promiscuous
surveys,
and
also
we
can
support
some
third-party
third-party
monitoring
system
like
inflex
deck
and
the
wavefront,
because
of
the
waveform
and
influx
db,
or
support
the
telegraph
to
collect
metric
data
and
which
is
comfortable
with
problem
issues.
So
we
can
use
a
telegraph
to
collect
matrix
and
also
you
can
use
the
influx
db
of
in
front
as
a
remote
backhand
for
problem
issues,
and
it
also
can.
B
A
A
Yeah,
I
think
you
know
when,
when
it
runs
as
a
h8
cluster,
when
when
you
run
hardware
as
an
energy
booster
via
our
operator
deployment,
it
would
be
really
nice
to
capture
some
information.
Like
you
know,
dead
processes,
the
health
status
of
the
specific
components
they're
supposed
to
be
aj
like
pgc
correct,
is
persistent
storage.
B
Yeah
in
the
first,
there
are
two
solutions
of
operator
solution,
because
the
service
monitor
can
find
can
cause
a
kubernetes
api
to
get
the
information
of
the
hubble
service.
Because
in
the
service
monitor,
you
can
define,
select
to
select
the
labels,
and
so
how
also
we,
the
label
will
match
the
hubble
service,
and
so
when
some
service
is
down
and
up
down
an
app
or
the
or
maybe
the
service
or
a
lot
of
replicas
and
the
service
monitor,
can
also
find
them
and
monitor
them.
B
And
the
side
side
conclusion,
because
because
the
service
monitor
also
only
works
in
the
same
class
that
if
we
we
don't
have,
I
have
installed
hubble
and
the
chrome
issue
service
in
the
same
class.
The
way
we're
using
the
side,
car
solution
and
each
hubble
service,
each
hubble
components,
parts
will
start
with
a
side
car
in
the
side
car.
Actually
in
the
side,
car
is
a
collector
which
can
collect
all
the
metrics
and
send
them
to
the
center
collector.
A
B
A
Nice,
I
think
that's
it's
something
that
you
know
we've
been
meaning
to
get
to
for
a
long
time
now.
I
think
we
always
knew
that
prometheus
was
the
right
solution
for
this
because
of
the
you
know
the
support
for
basic
kubernetes
building
blocks.
All
of
that
is
already
exist
existing
and
it
was
raised
to
us
many
times.
It's
just.
B
This
is
not,
I
think,
there's
no
some
coding
effort
here.
I
think
we
just
can
provide
some
document
here
for
the
user
to
collect
the
metrics,
because
in
standalone
we
use
the
collector
to
collect
the
metrics,
while
in
the
hay
environment
in
kubernetes,
we
use
the
steadfast
third
party
solutions,
so
we
just,
I
think
we
just
provide
a
document.
A
B
A
A
A
A
A
B
A
A
A
B
Also,
although
it's
it's
another
platform
value,
it's
comfortable
with
the
pro
issues,
and
I
think
the
prom
issues
is
the
only
only
metric
solution
for
in
the
can
help
open
the
elementary,
and
so
I
think
it
also
provides
some
something
like
like.
We
can
deploy
the
cyto
cut
of
an
enemy
transit
car
which
can,
I
think
it
seems
like
changes
a
pole
mode
to
push
mode.
So
we
don't
need
to
care
about
the
service
discovery
in
the
second
solution.
If
we
introduce
the
open,
animatry.
B
B
B
Yeah
you
can,
as
you
can
see,
this
is
using
the
collect
to
collect
this.
This
post
is
for
collector
and
it
included
the
hubble
core.
Also,
you
can
say
the
hubble
core
information
and
also
have
have
a
registry
information
and
they
can
compile
combine
them
as
one
the
configuration,
I
think,
is
very
easy.
B
It's
just
it
just
collects
the
core.
The
registry
and
the
collect
itself
in
this
configuration,
collect
three
component
and
expose
them
using
aaa
9
ports.
I,
but
I
I
think
it's
very
easy,
and
in
standalone
we
can
generate
the
config
for
the
users
and
the
users
don't
need
to
take
care
about
it
and
if,
if
the
user
enables
the
metrics-
and
we
can
configure
the
other
things
and
expose
collect
all
the
components,
metric
status
and
expose
them
using
collector.