►
From YouTube: Ard Demo
Description
No description was provided for this meeting.
If this is YOUR meeting, an easy way to fix this is to add a description to your video, wherever mtngs.io found it (probably YouTube).
A
A
So
this
is
linear.
All
output
of
the
layers
will
be
the
input
next
one.
First,
mr.
verifiable
claim
layer,
for
example.
This
is
just
like
a
use
casing
example
and
ladders.
No
certain
land
steward
making
a
claim
on
noted
practice,
happened
in
a
given
period
of
time,
which
is
the
time
of
interest
on
a
given
land
parcel.
This
is
the
area
of
interest
and
the
time
of
interest
can
be
defined
by
two
parameters
saw
date.
A
A
These
three
parameters
will
define
this
jessfishy
temporal
query,
which
will
be
the
input
of
the
square
layer
where
we
will
access
the
names
of
the
satellite
data
products
or
satellite
images
which
cover
our
time
for
interest.
So
you
those
which
were
acquired
between
March
and
May,
and
covers
our
a
oh
I
like
overlaps
with
with
them,
do
geographically
just
patient.
You
know
the
output
of
the
query
layer
will
be
on
this
list
of
these
satellite
data
product
names,
and
this
list
will
be
the
input
of
the
ARD
layer
oops.
A
A
A
So
I
call
these
data
purpose
of
single
images,
which
is
a
defined
sequence
of
pre-processing
steps
how
the
data
moves
over
time.
So
if
we
block
one
Sentinel
to
tile
into
this
AR
D
production
environment,
they
dis
da
Christ,
AR,
D
production
environment
will
perform
a
very
defined
sequence,
steps
which
is
basically
the
pre-processing,
the
lineage.
So
the
video
here
we
go
up
to
main
core
previously
same
lineage,
first
rate
of
Santino,
one
lineage
and
the
under
son,
Max
2002
lineage,
like
date
pre-processing
lineage
now
every
dude
is
second.
A
Very
important
thing
is
like
these:
do
this?
Because
of
data
provenance
provenance,
we
have
to
be
certified
the
integrity
of
the
previous
of
satellite
data
in
the
blockchain,
like
data
bytes,
we
need
to
trace,
keep
track.
Every
modification
made
to
the
original
raw
data
by
storing
a
record
in
the
different
levels
of
the
data,
along
with
the
production
environment,
trusts,
third
party
environment,
which
represents
top.
So
this
is
what
I
call
organization
so
after
process
started
up
one
by
one.
A
Algorithm
which
will
derive
this
thematic
information,
whether
a
field
of
the
team
at
guys,
polygon,
you
know
lamp
or
so
in
a
given
period
of
time,
were,
was
killed
or
not.
It
wasn't
killed
because
that's
at
the
end
is
the
result
layer
which
we
are
actually
interested
in,
so
the
whole
execution
of
it
is
just
because
of
days,
yes
or
no
I,
don't
feel
this
deal
tell
them
no
till.
A
A
A
This
is
our
a
a
I've
just
roughly
again,
this
is
just
for
you
know,
demonstration
purposes
and
I
want
to
query
my
time
with
interests
between
March
and
May
and
I'm
interested
in
having
similar
one
day.
Two
products
covering
this
area
of
interest
in
covering
this
time
of
interest
with
this
product
type
and
santel
to
this
product
type
I
will
show
all
of
the
tiles
and
granules
which
covers
the
area
and
the
time
yeah
so
see.
A
A
A
A
These
data
products
contain
a
lot
of
other,
not
just
the
image
itself.
This
is
the
structure
of
it.
Subfolders
PDF,
not
the
data
file.
This
is
something
I
wanted
for
us.
The
measurements
are
under
the
measurements
of
where-
and
this
is
the
row
row
later,
which
is
needs
to
be
purposes.
So
these
are
the
VH
vertical
horizontal
and
vertical
vertical
band,
while
Santa
to.
A
A
A
Our
fields,
so
this
is
called
the
bounding
most
its
extent
on
field
which
can
be
derived
by
the
field
by
these
shaped
by
it.
So
just
for
demonstration
purposes.
This
is
what
I
will
test
to
help
only
the
extent
cut
out
from
the
tile
itself,
because
you
know
this
is
dialing
grid
tiling
scheme
of
incentive
with
the
identification
codes.
A
We
can
download
this
thing
and
we'll
prepossess
the
whole
file,
but
we
are
only
interested
in
these
pixels
which
covers
our
fields,
but
for
this
demonstration
testing
out
our
ard,
lineage
I
will
use
the
extent
now
we
will
represent
one
central
one
date
product
and
once
entry
date
product
using
the
two
different,
a
are
the
repositories
I
will
show.
You
note
that
we
are
here.
This
is
the
building
block
just
and
tyre
about
the
processing
pipeline.
A
Here
we
are
Lapointe
central
one
day
to
nature
brightness
centre
to
latent
image.
These
rectangles
are
tourists,
so
these
are
the
steps
which
are
docked
right
by
the
oskins
satellite
facility
for
the
sentinel
one
day,
the
product
they
call
it.
The
radiometric
charting
correction
RTC
repossessing-
and
this
is
the
part
which
is
entirely
talk-
arise
by
me,
something
to
take
boxes.
Sync
data
lineage.
They
use
their
own
data
center.
A
They'll
ask
answered
like
facility
data
pool
to
access
the
images
because
ask
a
satellite
facility,
the
Nasdaq,
which
means
the
official
satellite
data
distributing
our
hive
in
Central
and
at
this
point
of
this
solution
tools.
Images
from
the
Google
cloud
here
is
repository
of
the
ace
of
71
two
books,
and
here
is
where
you
can
find.
Under
the
region.
Science
repository
the
STAAR,
the
subdirectory,
the
docker
container.
A
A
So
it
was
some
night
repositories,
Cheadle
and
then
W
get
to
the
jeiza
snap
framework,
which
is
functionality
entirely
used
inside
this
document.
Al
and
also
they
all
own
repository
I,
think
just
for.
Like
actual
theory,
they
downloading
the
entry
point
is
the
end
point
of
this.
Is
this
RTC
item
25.
A
Which
is
under
the
script
or
no
RC
thing,
so
this
is
the
total,
don't
so
later
on
solution
to
purposes
only
a
single
day
to
product
only
one
way,
which
is
coded
basically
hard-coded
here.
So
there
is
no
configuration
available.
All
the
input
which
is
needed
is
the
granule,
the
name
of
the
granule,
which
is
talking
about
like
query
date,
product
name
and
things
like
that,
and
just
that's
the
only
input
and
then
you
have
to
do
go
through
an
authentication
forward.
Do
you
access
the
data
product
from
the
asking
satellite
facility
data
center.
A
A
A
A
And
they
start
stretching
the
granule,
and
everything
starts
running
this
process,
so
I
picked
queried
like
the
name.
Today's
product
went
through
the
authentication
and
then
started
doing
this
process,
and
it
will
outfit
the
to
the
vertical
horizontal
vertical
vertical
bands
of
The
Sentinel
date
product,
which
was
the
input
as
a
pre-business
gamma,
no
to
be
called
gamma
note
Oh
later
in
the
ant,
is
what
which
really
is
output.
A
So
here
offshore
authentication
it
downloaded
granule
did
apply
orbit.
Did
the
calibration
it's
back
up
filtering.
Did
the
multi
looking
the
deuterium,
flattening
during
correction
retiring
correction
needed
digital
elevation
model,
so
we
downloaded
the
covering
a
search,
IAM
and
needy
product.
I
think
it
that's
where
you
did
it,
so
it
was
like
an
initialization
stuff
together,
like
a
third
party
or
image,
which
you
need
to
access
to
do,
deterring
correction
properly
and
also
it
proposes
the
data
into
a
30
meter
resolution.
A
A
That's
how
I
look
on
the
docket
file
since
I
said
it's
under
this
s2
ard
subdirectory,
the
doc
file
is
nice,
only
boon
to
distribution,
say,
pulls
Minicon,
dog
and
so
Python
environment
installs
to
package
G
Doland
vital,
F
mass,
which
is
cloud
like
skincare
library,
then
put
Santa
Corps,
which
is
the
European
Space
Agency.
This
very
correction,
software
installs
gsutil,
chill
average
in
the
command
line.
Interface
at
that
point
is
this
ard
the
pie
Python
script,
which
we
can
find
the
under
D.
As
you
see
some
directory.
A
Obviously
pulls
the
data
product
from
as
I
said
earlier
earlier,
moved
from
Google
cloud
and
then
it
runs
yeah,
Pacific,
correction,
Santa,
Co,
atmosphere,
correction,
module.
If
you
fly
get
false,
you
will
not
run
the
specific
correction
and
then
it
runs
the
eff
mask,
which
is
the
cloud
masking
home
module.
A
A
Obviously
we
have
to
it.
So
this
is
like
a
standardized
change
at
this
point
with
customization
like
this.
With
this
G
Jason
I
also
integrated
this
arm
craft
coupling
option,
which
is,
will
crop
out
the
area
of
interest.
You
know
from
the
tile
itself,
because
that's
at
the
end,
which
we
want
to
plug
into
the
analyzes
layer,
if
you
remember
so
this
without
put
the
ARD
the
purposes
data
product
and
then
they
the
purposes
they
put
like
really
plug
it
into
dentistry,
so
make
sense.
You
have
only
the
field
data
which
you
are
interested
in.
A
A
A
Beside
the
tip
sent
11
images
I
showed
earlier.
There
is
the
synthetic
stacked
image.
These
are
not
stacked.
These
are
separate.
Every
band
is
separate
single
file.
Well,
we
can,
you
know,
merge
them
together
and
we
have
like
a
multi-dimensional
image
like
here,
because
we
have
here.
It's
just
for
testing
and
demonstration
purposes:
I
mean
5
bands
for
Santa
to
ban
that
image,
and
it's
tagged
it
after
that.
A
I
moved
these
images
under
the
output
and
an
output
directory
I
created
here
just
to
make
it
easier
to
copy
from
the
virtual
machine
onto
my
laptop,
like
no
loop
drive,
because
eventually
I
would
like
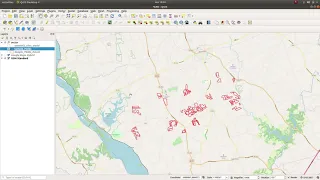
to
see
them
in
Mayan
on
qgi
in
QGIS.
That's
where
I
is
copying
the
files
and
that's
why
I
have
add
files
are
so.
This
is
to
Sentinel
one.