►
Description
Here is a link to the slides: https://docs.google.com/presentation/d/1kOe7-t_Kn20CEAcgZM5FbddZYsag-hnEZoTrRCKEazw/edit#slide=id.p
A
A
My
primary
goal
with
that
was
to
take
many
different
apis
that
exist
in
open,
opencv,
openmbg,
etc,
and
the
many
different
visual
slam
frameworks
out
there
that
kind
of
exist
for
research
purposes
and
then
create
cohesive
apis.
That
would
allow
people
to
swap
in
and
out
their
algorithms
and
also
to
be
able
to
create
computer
vision
pipelines
really
simply
so
that
people
can
get
into
computer
vision
quickly.
A
So
I
this
this
talk
is
going
to
be
just
a
brief
introduction
to
photogrammetry
we're
not
going
to
go
into
too
many
of
the
the
the
really
deep
details
on
it.
My
hope
is
that
for
peop,
some
of
the
people
here
that
may
not
be
as
familiar
with
photogrammetry,
specifically
or
that
for
people
that
are
looking
at
the
recording
that
I
might
point
people
to
just
just
to
get
an
idea
of
what
this
is.
Maybe
this
can
help
inspire
some
people
to
be
interested
in
this
topic.
A
So
let's
go
ahead
and
dive
in.
So
first
thing
is
what
is
photogrammetry
so
photogrammetry?
Just
means
taking
measurements
from
images,
but
today,
typically
what
that
means
is
you'll,
hear
it
used
in
the
movie
industry
or
for
the
game
industry
to
mean
we're
taking
some
images,
creating
a
3d
model
of
a
person,
a
rock
or
something,
and
putting
that
asset
into
into
some
environment,
that
that
process
typically
called
structure
from
motion,
and
sometimes
we're
also
using
this
for
robot
navigation.
A
So
you
might
have
a
video
feed
coming
from
a
robot
and
that
is
kind
of
creating
a
three-dimensional
representation
of
the
environment,
and
then
that
is
allowing
it
to
navigate
along.
So
this,
this
general
concept
of
taking
measurement
from
images
has
changed
a
lot
over
the
years.
You
can
still
just
take
measurements
by
creating
these
reconstructions
and
then
measuring
them.
But
of
course
it
is
now
very,
very
all-encompassing.
A
So
today,
what
we're
going
to
talk
about
is
what's
kind
of
spelled
out
here,
so
we're
going
to
talk
about
what
a
visual
slam
pipeline
or
structure
from
motion
pipeline
might
look
like,
and
I'm
going
to
talk
specifically
about
some
things
that
that
we
do
use
in
rust,
cv
and
some
things
that
we
don't
so
a
cause.
A
is
one
of
those
things
and
rather
than
using
bundle
adjustment,
we
may
use
constraints,
but
these
principles
are
generally
useful
so
that
people
can
understand.
A
So
the
first
thing
I'll
talk
about
is
scale
and
computer
vision.
So
it
appears
that
we're
looking
from
the
the
the
corner
of
a
room
high
up,
perhaps
off,
of
a
balcony.
Looking
down,
you
see
the
chairs
fireplace,
but
in
actuality
it
was
really
just
a
doll
house.
So
what
happened
there?
So
really?
What
happened
was
everything
was
much
smaller
than
we
thought.
A
Not
only
is
the
the
furniture
significantly
smaller,
but
also
the
distance
that
we
are
from
the
objects
is
significantly
smaller,
but
the
relative
scale
that
we
got
from
from
looking
at
that
is
is
approximately
we
we
knew
what
direction
we
were
in
right.
We
knew
we
were
up
near
the
balcony.
We
actually
are
still
taking
a
photo
from
the
same
angle,
and
that
was
something
we
could
recognize,
but
we
couldn't
tell
how
far
away
we
were
right.
A
A
So
on
the
left
here
we
have
an
example
of
what
is
typically
called
the
pinhole
camera
model,
so
the
way
that
a
camera
works
is
that
light
is
is
coming
in
from
some
point,
so
light's
traveling
in
roughly
a
straight
line.
It
comes
in
from
let's
say
the
top
of
this
tree,
and
if
we
did
not
have
a
pinhole
or
a
focal
point
on
the
camera,
then
it
would
just
be
a
huge
blur
right.
If
you
look
at
the
light
reflected
on
some
surface,
that's
white.
A
We
actually
just
know
that
what
direction
it
came
from
which
is
really
important,
and
now,
if
we
look
at
the
the
right
view
by
having
that
right
view,
if
we
know
where
it's
located,
if
we
can
observe
that
point
now,
assuming
there's
no
error
right,
we
could
know
exactly
where
that
that
point
is
located,
because
we
have
two
intersecting
rays
that
basically
overlap
and
then
tell
us
in
space
where
that
point
is
this.
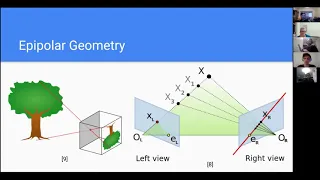
This
general
concept
is
typically
referred
to
as
epipolar
geometry.
A
So
the
the
the
point
el
on
the
left
view
as
the
the
epic
polar
points
here
and
that's
basically
where
the
the
the
camera
on
the
right
would
actually
its
focal
point
would
show
up
on
the
the
image
on
the
left
view.
Because,
again,
everything
is
just
a
direction
in
this
case
and
the
the
the
plane
there
is
referred
to
as
epi
the
epipolar
plane
and
the
the
epipolar
line-
and
this
is
very
important-
is
the
red
line
on
the
right
view.
A
So
if
we
were
to
observe
point
x
on
the
left
view
right,
it
could
exist
along
a
line
and
now,
if
you
project
that
line
onto
the
right
view,
that
red
line
shows
all
the
possible
positions
on
the
right
view
where
we
could
observe
that
point
just
based
on
the
information
we
got
from
the
left
view.
But
since
we
also
know
where
it
is
in
the
right
view,
that's
how
we're
able
to
constrain
where,
on
that
line.
That
point
is
located.
A
A
So
in
our
pipelines
we
actually
handle
this
using
homogeneous
coordinates,
which,
which
is
very
convenient
for
doing
transformations
on
cameras
and
things
of
that
nature.
But
it
allows
us
to
to
represent
points
which
exists
very
far
away,
and
in
that
case
the
only
information
we
really
preserve
is
the
direction
that
that
feature
came
in.
A
So
the
only
information
we
really
get
from
this
process
is
is
what
direction
is
it
in,
and
this
can
still
still
be
useful
in
various
fields,
it's
not
as
useful
for
tracking
the
position
of
the
camera,
but
it
could
be
helpful
for
tracking
the
rotation
of
the
camera
because
you
would
know,
regardless
of
where
you
you
move
around.
You
would
expect
this
feature
to
exist
in
the
same
direction.
A
A
A
What
what
it's
doing
is
is
similar
but
but
slightly
different,
so,
rather
than
blurring
the
whole
image,
it
actually
blurs
the
image
selectively.
So
this
this
process
basically
generates
a
map
of
the
the
scale
space.
So
looking
at
okay
are
there
very
fine,
grained
fine
details
in
certain
parts
of
the
images
on
the
right
you
can
see
at
two
different
scales
so
on
the
left
is
a
a
higher,
a
higher
or
a
lower
level
of
detail
or
the
level
zero.
A
What
that
looks
like
so
on
the
left
is
a
finer
detail
level
and
then
on
the
right
is
a
higher
detail
level,
where
it's
kind
of
blurred
out
the
features
in
the
floor
to
where
you
can
only
see
the
floor
tiles.
Now
you
can
no
longer
see
the
actual
grains
of
the
wood,
and
things
like
that.
So
this
is
this
is
very
useful
for
us
to
be
able
to
to
detect
features
and
images
at
various
scales.
A
The
next
thing
that
it
that
we
need
to
do
is
is
actually
find
the
features
and
extract
information
about
them.
So
what
is
done
in
this
case
is
we're
actually
looking
for
areas
of
interest
in
the
image
which
it's
going
to
define
in
this
case,
as
curvature
peaks
in
luvanosi
or
or
rather
extremas
of
of
luminosity.
So
to
do
that,
we
actually
need
to
kind
of
look
at
what
are
the
changes
in
the
image
across
the
vertical
and
the
horizontal
so
on.
A
The
left
here
is
an
example
of
a
a
sharp
filter
which
is
very
quick
to
run,
and
it
approximates
it
approximates
the
the
gradient
computation
from
a
horizontal
and
vertical
gradient
perspective.
So
we
can
compute
a
what
is
it?
What
is
the?
How
is
the
luminosity
changing
along
the
vertical
and
the
horizontal
in
the
image,
and
by
applying
that
in
in
different
directions,
we
can
actually
compute
the
the
the
extremas
in
the
in
the
luminosity
so
kind
of
those
peaks
and
troughs,
and
if
you
do
this
at
different
scales.
A
So
where
is
that?
Where
is
that
peaking
at
different
scales?
We
actually
get
different
kinds
of
information.
So
on
the
right,
here's
an
example
of
the
what
those
peaks
look
like
at
different
scales
on
the
top
is
at
a
fine
level
of
detail.
So
you
can
see
lots
of
little
features
there
peaks
around
like
the
plants,
you
can
even
see
on
the
floorboard,
some
the
shoes
and
things
in
the
environment
and
then
below
that
you
get
these
really
big
blobs.
That
kind
of
show
all
right.
A
This
is
there's
a
big
feature
for
this
whole
shoe
or
for
this
you
know
just
some
very
large
object
in
the
environment.
It
kind
of
goes
to
a
larger
scale,
and
you
see
significantly
less
points
at
these
scales
because
we've,
you
know,
there's
less
information
at
them.
So
this
is
important,
though,
because
if
we
are
close
to
an
object,
then
we
will
see
more
more
details,
but
we
also
want
to
extract
those
high
level
details
so
that
when
we're
further
from
the
object,
we
can
recognize
that
object
again.
A
And
so
what
we
end
up
with
is
on
the
right.
These
key
points
detected.
This
is
kind
of
a
visualization
of
the
key
points
and
their
their
size
roughly.
So
this
will
show
you
what
scale
have
we
detected
these
key
points
at
and,
as
you
can
see,
it's
found,
for
instance,
on
the
curtains.
It
finds
lots
of
really
tiny
features
and
on
the
the
shoes,
the
objects
on
the
table,
those
are
much
larger
features,
and
so
this
this
is.
A
This
is
the
kind
of
information
we
want
to
extract,
and
now
the
last
stage
is:
how
do
we
actually
get
the
description
of
that
feature
out
that
the
algorithm
will
use
to
tell
two
different
features
apart
so
on
on
the
bottom,
we
have
the
information
sources
that
we
have.
In
this
case,
we
have
the
actual
image
itself,
the
luminosity,
so
we
kind
of
we've
removed
the
color.
A
A
A
A
So
when
we
take
these,
these
comparisons
we're
just
looking
at
how
many
of
these
these
bits
are
going
to
be
different
from
each
other.
It
turns
out
that
this
is
incredibly
easy
to
do
incredibly
quick
to
do
for
a
modern
computer
effectively
with
some
caveats.
This
is
basically
an
xor
and
a
pop
count.
A
This
is
I,
I
believe,
brisk
or
brisk
features
that
are
being
compared
between
two
images
and
and
match,
and
there
is
not
very
much
verification
being
done
on
it.
No,
nothing
is
used
about
the
geometry
to
to
filter
outliers
and
things
like
that.
We
just
kind
of
have
a
huge
bag
of
matches
and,
as
you
can
see,
some
of
them
are
are
definitely
wrong.
They
just
kind
of
go
to
random
places,
but
a
lot
of
them
are
right.
A
You
can
kind
of
see
a
bunch
of
straight
lines,
moving
from
one
image
to
the
other,
so
there's
there's
some
kind
of
idea
that
a
lot
of
these
matches
are
correct
and
on
the
bottom
we
have
an
example
where
a
cause
a
is
used
which
starts
out
with
less
outliers
to
begin
with,
but
then
we
also
apply
what's
called
geometric
filtering
to
it,
so
we
we
take
into
account.
Where
could
the
features
be
based
on
those
epipolar
lines
we
saw
before
they
can
only
lie
in
a
certain
area?
A
A
There's
there'll
be
a
few,
though,
for
sure,
depending
on
your
settings,
of
course,
so
the
way
that
we
actually
perform
that
filtering
is
using
a
sample
consensus
process.
So
the
most
common
one
is
called
ransack,
there's
many
others
and
there
are
alternatives
to
this.
But
but
what
we're?
What
we're
trying
to
do
is
find
a
hypothesis
that
best
fits
our
our
data
points
sometimes
referred
to
as
a
model
as
well
of
the
of
the
data.
A
So
in
this
case
our
model
is
how
are
those
two
cameras
or
where
is
this
camera
located
in
respect
to
a
whole
bunch
of
pre-existing
3d
points
and
in
the
case
of
of
line
fitting
the
way
this
this
works?
Is
you
have
two
points?
You
can
compute
a
line
so
effectively
a
y-intercept
and
a
slope
or
there's
different
ways
to
represent
line,
but
you
find
some
line
and
you
define
some
threshold
for
what
is
an
outlier
and
what
is
an
inlayer
and
on
the
bottom
left.
A
You
can
see
that
there
is
a
line
generated
there
from
those
two
points
that
has
a
bunch
of
yellow
points
which
are
considered
inliers,
a
bunch
of
blue
points
that
are
considered
outliers
now.
That
is
clearly
wrong,
but,
as
you
continuously
run,
this
process,
you'll
you'll,
take
those
points
and
you'll
generate
models
from
them.
Eventually,
you'll
generate
a
model
from
a
point.
Let's
say
two
points
that
are
are
strongly
on
the
line
and
that
will
fit
the
points
very
well.
A
That
does
occasionally
happen,
but
but,
as
you
get
more
information
from
more
cameras-
and
you,
you
observe
a
feature
from
multiple
images,
you
can
be
more
sure
about
how
correct
that
point
is,
but
this
is
kind
of
how
we
initially
take
those
matches
and
filter
them
out.
So
this
gets
us
a
good
set
of
quality
data.
Assuming
that
a
good
deal
of
our
input
data
is
correct.
If
it's,
if
the
data
is
not,
it
has
a
lot
of
outliers.
We
may
not
be
able
to
find
a
good
model
at
the
data
and
now.
A
The
next
thing
that
we
that
we
want
to
do
is
is
create
a
3d
model,
so
we
we
have
some
model
that
we're
kind
of
assuming
here
we
have
some
model
that
exists
right
and
we're
adding
a
new
frame
to
that
model.
The
main
metric
for
how
good
a
given
match
in
an
image
is
the
the
what
is
actually
used
as
the
the
distance
to
the
line
in
this
sample
consensus
process
in
our
when
we're
actually
performing
that
with
cameras
is
what's
called,
reprojection
error.
A
So
you
basically-
and
this
is
not
the
only
way
to
do
this-
you
can
also
use
sine
or
cosine
distance
among
other
things,
but
what
you
can
do
is
basically
take
the
points
figure
out
where
it
should
show
up
on
the
image
and
then
figure
out
where
the
it's
actually
showing
up
on
the
camera.
So
where
is
the
feature
detected
on
the
camera
in
the
image
and
where
should
it
show
up
on
the
image
and
then
that's
kind
of?
A
That's
that's
our
error
right
there,
the
distance
of
that
point
or
it
can
be
separated
into
x
and
y
separately,
and
so
what
we
actually
want
to
do
is
take
all
of
these
cameras
and
all
of
these
reprojection
errors
and
minimize
them.
So
what
you
need
to
do
is
basically
look
at.
How
could
we
tweak
every
single
point,
every
single
camera
position,
every
single
camera
rotation
such
that
it
would
reduce
these
reprojection
errors,
and
so
this
actually
creates
a
very
large
jacobian
matrix.
A
That
is
sometimes
solved
as
a
least
squares
problem
and
one
one
example
is
using
levenberg
mccart
mccart
there's
also,
but
there's
some
other
things
you
can
do
as
well,
and
then
this
is
put
this
on.
The
right
is
actually
an
example
of
the
approximate
hessian,
which
is
generated
from
multiplying
the
jacobian
by
transpose.
A
So
that's
a
lot
of
math
mumbo
jumbo,
but
basically
the
gist
of
this
is
we
want
to
move
and
those
little
cameras
around
and
the
points
around
in
the
reconstruction
such
that
everything
lines
up,
so
that
the
points
are
in
the
place
that
is
predicted
by
the
observation
in
the
image.
So
you
kind
of
like
move
the
cameras
around
until
they're
all
in
the
best
spot.
A
They
can
possibly
be
to
reduce
that
error,
and
then
we
triangulate
those
points
and
on
the
left
is
an
example
of
a
3d
reconstruction
produced
using
rust
cv
on
what
you
can
see
is
actually
apartment,
complex
building
and
some
trees
and
and
grass
just
below
it,
and
then
a
parking
lot
in
front
of
it
and
you
can
maybe
make
out
a
few
cars.
Might
there
might
be
some
compression
going
through
zoom,
but
that
that's
that's
what
it
is
and
this
and
that's
also
from
video.
A
I
took
myself
as
well.
So
basically
it's
it's
a
really
cool,
a
really
cool
process
that
you
can
actually
recreate
3d
information,
even
though
it's
been
collapsed
down
into
2d,
going
into
your
camera,
really
cool
stuff
and
there's
my
credits
so
and
my
citations
all
right
does
anyone.
I
think
that's
it.
We
can
go
into
questions.