►
Description
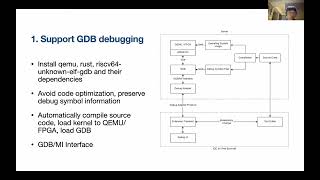
Zhiyang Chen describes his experience building (in conjunction with paper co-authors Ye Yu, Zhengfan Li and Jingbang Wu) an interactive kernel debugger for the rCore Rust kernel. The debugger is implemented as a VSCode front-end plugin against the GDB back-end, targeted at the web version of VSCode (but also running on desktop). The debugger provides the full capabilities of GDB for both user and kernel code, with the convenience of the VSCode interface.
The source code is available at https://github.com/chenzhiy2001/code-debug.
A
So,
firstly,
I
want
to
talk
about
what
we
what
we
want
to
implement
this
kind
of
tool.
We
want
to
try
to
learn
some
raw
space
operating
systems
like
blogos
and
alcohol
feels
a
little
bit
like
logo
is,
but
it
has
a
very
detailed
Chinese
document,
so
people
people
want
to
learn
operating
system,
buy
it
and
we
may
we
basically
faced
two
problems.
A
So
first
thing
configuring,
the
environment
is
going
to
be
complicated.
You
need
to
compile
your
own
cumu
and
there's
Ross
tool
chain
and
dependencies
and
Risk
by
two
chains,
because
awkward
runs
on
risk
5.
So
it's
a
little
bit
complicated
and
the
second
thing
is:
if
you
want
to
debug
it
I
mean
many
people
when,
when
they
first,
when
I
first
tried
to
try
to
make
their
own
operating
system,
they
wanted
way
to
to
divide
their
operating
system.
So
but
GDB
feels
not
very
convenient.
It's
text,
user
interface,
many
people
not
family.
A
Familiar
with
that.
So
we
want
to
solve
those
two
problems,
so
our
shotgun
goal
is,
is
a
rust
or
is
online
debugging
tool
that
runs
on
cumu
and
in
the
long
term
we
want
to
make
a
a
kind
of
box
and
inside
the
box
there
is
a
fpga
or
risk
5
board,
and
it
has
this
kind
of
online
debugging
too.
So
people
just
buy
this
box
and
and
they
can,
they
can
start
debugging
and
starting
running
their
operating
system.
Very
conveniently
so
this
is
an
online
debugging
system.
A
We
hope
to
make
it
similar
to
build
our
classrooms,
which
means
it's
browser-based.
You
don't
need
to
configure
everything,
just
open
your
browser
and
everything
starts
there.
You
can
start,
you
can
start
doing
your
experiments
and
the
deborder
is
separated
from
debugging
kernel
and
it
means
that
the
kernel
is
running
on
server
and
your
client.
A
It
just
enjoys
a
web
browser,
so
so
this
is
more
inconvenient
and
there
is
a
vs
code
plugin
that
provides
debugging
features,
and
we
do
this
way
because,
because
we
wanted
this,
this
plug
plugin
can
also
be
used
in
local
BS
code.
So
so
many
more
people
will
try
to
use
that,
and
this
is
our
a
screenshot
of
our
tool.
So
you
can
see
on
the
right
side.
A
It
has
three
tabs,
it
has
a
register,
tab,
a
memory
Tab
and
break
points,
Tab
and-
and
this
breakpoint
is
it
has
kind
of
as
a
kind
of
cache
cash
for
city
is
a
little
bit
different
and
only
that
you
can
see
we
can
set.
We
can
separate
points
wherever
where
we
want
and
on
the
bottom.
This
is
a
GDP
command
that
actually
sends
to
to
the
cumulus
GDP
stock.
A
A
You
know
whether
you're
in
Chrono
or
you're,
in
user
programs
and
and
the
important
thing
is
when
you're
running
in
kernel,
you
can,
you
can
set
a
breakpoint
in
in
user
mode,
and
this
is
not,
and
this
is
not
doable
when
you're
using
text
text
based
GDP.
You
could
try
to.
For
example,
if
you
try
to
I'm
running
on
a
Chrono
and
you
hit
a
kernel
breakpoint
and
you
want
to
set
a
user
mode
breakpoint,
that
user
mode
grade
point
will
not
be
hit,
it
will
just
it
will
just
not
is
eligibly
disabled.
A
So
this
this
is
a
trouble
when
we
want
to
tracking
system
calls
and
another
thing:
is
it
automatically
loads
and
replace
simple
files,
because
we
have
inside
our
example?
There
is
a
single
file
for
kernel
and
there
is
a
symbol
file
for
for
the
program
print
this
program
or
that
program
different
program.
Different
user
programs
have
different
simple
files,
and
this
is
our
architecture.
A
What
it
does
is
so
we
have
our
source
code
on
server
and
there's
a
compile,
compile
process
of
the
compile
process.
We
get
two
files.
The
first
one
is
the
execute,
which
is
the
operating
system
image
and
we
load
it
into
cumu
automatically,
and
the
second
thing
is
the
debugging.
Both
files-
and
this
is
important-
I-
will
talk
about
it
later
and
this
file
will
be
added
to
GDB
and
will
actually
be
connect
to
cumul,
and
in
this
time
you
finish
the
first
step,
which
is
super
GDP
debugging.
A
A
So
in
the
first
step,
there's
a
GDB
debunking
step
so
for
time,
limitations
I'm,
not
diving
too
much
on
that.
So
basically
you
just
install
its
dependencies
and
and
you'll
avoid
some
code
optimal
optimization
by
avoiding
code
optimization,
you
need
to
configure
basically
two
places.
The
first
place
is
cargo.com
and-
and
you
might
be
familiar
with
that
and
yeah-
you
need
to
say-
debug
is
true
to
make
it
present
debug
information.
But
that
is
not
enough
and
then
there's
another
another
attribution
which
is
optic,
optimization
level,
and
this
this
is.
A
This
is
very
important
if
you
study
to
one
the
two
other
default
value
is
three
usually
zero.
It
has
a
minimum
optimization
level
and-
and
there
are
more
places
where
you
can
set
breakpoints
so
such
that
is
energy
vs
code.
The
main
thing
we
do
here
is
a
is
a
process
called
debug
adapter,
because
in
vs
code
you
don't
directly
connect
to
200
debugger.
In
this
time,
it's
GDP
vs
code
will
connect
to
a
project
called
debug,
adapter
and
debug
adapter
will
tell
GDP
what
to
do
so.
A
This
is
a
default
adapter,
and
this
is
a
UI.
Ui
has
three
parts:
there
is
a
particle
extension
front
end
and
it
it
will.
It
will
coordinate
with
debug
adapter
and
do
some
UI
change,
so
I'm
I'm.
So
this
is
the
second
problem,
which
is
a
most
most
important
work
we
do
is
resolve
the
conflict
by
resolving
the
conflict,
we
made
a
new
data
structure
which
is
a
which
is
this
breakpoint
groups
with
separate
breakpoint
in
different
groups.
A
For
example,
here's
a
group
name,
you
can
see
kernel
group
name,
which
means
breakpoints
in
kernel
and
this
innate
Block
in
a
proc
breaking
group
and
which
means
great
Point
groups
in
in
April,
and
there
are
different
user
mode.
Application
has
different
groups
and
kernel,
which
is
one
which
one
breakpoint
group
and
we're,
and
we
also
have
two
key
breakpoints.
We
call
it
border
break
points
when
those
breakpoints
are
set
up.
So
when
those
four
points
are
shipped
when
those
whatever
I
hit,
it
means
your
previous
model
change.
A
When
it's
running
in
grade
point,
it
means
running
on
any
block
also,
so
we
have
a
yeah.
We
have
an
animation
here,
you
add
a
border
and
the
reporting
change
go
to
user
program
a
and
run
it
back.
The
breakpoint
will
change
again
and
you
go
back
to
Kernel
and-
and
this
way
then
go
to
another
user
program
back
and
forth.
So
in
this
way
you're
going
to
support
multiple
user
programs
and
we
we
do
in
this
kind
of
thing
in
awkward
tutorial.
So
people
wanting
to
do
this
in
other
operating
systems.
A
So
when
switch
breakpoint
groups,
you
also
update
privilege
mode
premium
information,
because
Opera
runs
on
risk,
5
and
risk
five
there's,
no,
a
register
that
can
tell
you
what
current
privilege.
So
you
are
now
so
you
need
to
doing
duties,
kind
of
work
around
and
finally,
I'm
talking
about
the
limitations
and
or
future
work,
so
also
is
now
based
on
GDB.
So
GDB
has
some
lost
support,
but
not
very
sufficient.
A
So
GDB
has
some
limitations
on
R2
also
has
limitations,
so
GDP
cannot
inspect
itself,
which
is
because
then
it'll
become
inconvenient
and
back
back
DQ
back.
You
can
actually
see
what's
inside
Vector,
Cube
some
pointer
values
as
well
and
you're,
saying
so.
A
lazy
stack
because
lazy,
stats,
lazy,
static,
the
value
is
actually
return,
return
from
a
function,
and
this
is
hard
to
track
so
and
all
in
the
future.
We
wanted
to
solve
those
problems.
We
want
to
solve
problems
we
need
to.
A
B
A
Yes,
we
started,
we
started
his
project,
this
January,
so
it's
basically
half
a
year
and
there
is
a
hard
thing,
because
vs
code
doesn't
actually
have
very,
very
detailed
documentation.
You
you
you,
you
can
all
you
need
always
need
to
do
through
a
vs
code
source
code
to
get
things
you
want
and
many
apis
just
has
no
documentation
or
just
not
no
detailed
enough.
A
B
C
C
No,
no
not
about
operating
system
support,
but
about
like,
like
a
debugger,
especially
like
a
breakpoint
debugger,
is
intended
to
help
with
a
category
of
bugs
where
it's
useful
to
like,
stop
and
observe
the
state
of
the
operating
system
right,
but
I'm
curious.
What
like
other
categories
of
bugs
that
people
write
when
they're
creating
operating
systems.
You
think
aren't
effectively
addressed
by
this
like
a
breakpoint
based
debugger
that
you
think
like
further
tooling
or
future
work
could
address.