►
Description
No description was provided for this meeting.
If this is YOUR meeting, an easy way to fix this is to add a description to your video, wherever mtngs.io found it (probably YouTube).
A
A
I'm
going
to
show
how
the
glue
platform
management
plan
can
be
deployed
to
multiple
regions
and
have
automated
failover
between
I'll,
be
using
AWS,
with
clusters
deployed
to
two
different
regions
connecting
to
one
management
server
at
a
time
and
an
active
passive
configuration.
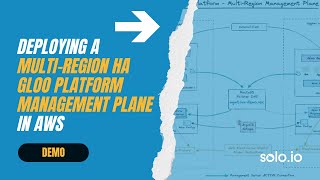
Let's
take
a
quick
look
at
the
components
used
in
the
demo,
I'm
not
going
to
Deep
dive
on
the
architecture
or
multiple
management
server
requirements.
A
A
Some
of
this
will
be
explained
in
more
detail
as
we
go
through
the
demo.
Steps
and
I'll
refer
back
to
this
diagram
as
we
progress
through
the
failover
steps.
First,
we're
using
two
regions:
USC's
one
and
uses
two.
Each
region
has
a
workload
cluster,
we're
not
going
to
Deep
dive
on
the
data
plane
or
cover
the
data
plane
in
this
demo,
but
there
is
live
traffic
going
to
the
data
plane
and
an
active
active
configuration
between
the
two
regions.
A
A
Next
we
have
the
two
management
servers,
one
in
each
region,
we're
using
Argo
CD
to
sync
our
management
server
configurations
to
both
clusters
between
the
two
regions
and
finally,
we
have
the
AWS
Alaska
global
data
store
that
lets
us
have
a
shared
Regis
across
two
regions,
you'll
also
notice,
Orlando
deployed
to
each
region.
This
exists
because
AWS
doesn't
have
an
automated
way
to
perform
a
failover
between
the
primary
and
secondary
and
the
global
redis
data
store.
A
You
can
find
a
link
to
the
GitHub
repo
for
the
alumni
redis
promoter
in
the
YouTube
comments
below.
Let's
take
a
look
at
the
starting
State
before
failover
occurs.
This
is
a
split
view
of
the
US
East
One
dashboard
on
the
left
and
the
USC's
2
dashboard
on
the
right.
As
you
can
see,
the
beginning
state
is
that
USC
stolen
is
the
active
management
server
and
the
agents
are
connected.
A
A
A
Before
we
simulate
a
failover
I
want
to
show
evidence
of
how
things
are
currently
configured
in
the
AWS
environment.
So,
let's
start
with
the
failover
record
for
the
management
plan,
the
DNS
name
is
management.ajdemo.vpc,
so
we
can
see
here
there's
a
failover
record
set
with
the
primary
and
secondary
each
one
points
to
a
network
load
balancer
that
sits
in
front
of
its
respective
management
server.
A
Here
are
the
Dig
results
for
each
of
those
Network
load
balancers
and
for
the
management
endpoint
showing
that
it
is
pointed
to
the
US
East
London
region.
Now,
let's
simulate
a
regional
failover
of
an
Android
server
I'm
going
to
do
this
just
for
demonstration
purposes
by
scaling
the
management
server
to
zero
in
U.S
east
one.
This
will
cause
the
health
check
for
the
load
balancer
to
fail,
which
will
in
turn,
cause
the
AWS
Route
53
record
to
failover
to
USC's
too.
A
A
A
Let's
take
a
quick
look
at
the
agent
pods
and
the
workload
clusters.
One
of
them
shows
a
restart,
but
that
was
from
the
beginning
of
setting
up
the
cluster
before
I
even
started
the
demo.
So
both
of
these
pods
were
up
and
running
before
the
demo
started.
They
have
not
had
restarts
and
they
are
currently
empty.
A
A
A
Now,
let's
take
a
look
at
our
global
redis
data
store
and
see.
What's
going
on
there,
we
can
see
that
the
Lambda
has
promoted
what
was
the
primary
instance
to
be
secondary,
and
now
the
secondary
is
primary,
meaning
that
uses
two
is
now.
The
primary
read,
write
instance
for
the
global
red
estate
is
stored
as
further
evidence
of
how
that
Red's
promotion
happened.
A
This
is
a
log
line
output
from
the
promoter
Lambda
that
promoted
secondary
to
primary
and
USC's
too,
for
the
final
bit
of
evidence
that
we've
had
a
successful
transition
to
us,
East
2
and
that
we're
fully
operational,
meaning
that
we
can
continue
to
push
blue
mesh
configuration
changes,
I'm
going
to
show
adding
a
new
route
to
the
demo.
Api
that's
been
running
in
the
data
plane,
so
here
I
can
see
in
the
terminal
that
the
slash
Foo
route
does
not
exist.
A
Now,
I'm
going
to
copy
my
sanity
direct
response
route
and
add
a
new
route
called
who,
with
the
prefix,
Foo
and
I'll,
just
replace
the
message
with
a
message
indicating
that
we
just
added
around
so
I
push
that
new
route
up
to
GitHub
and
it
was
synced
to
the
currently
active
management
server
at
uscs2
with
Argo
CD.
Now
I'll
just
go
back
to
the
CLI
and
try
that
through
route
again
to
demonstrate
that
it
was
picked
up
and
is
actually
being
served
by
the
data
bleed
and
we
can
see
on
the
command
line.
A
The
curly
Quest
now
is
showing
the
direct
response
that
we
just
added
and
pushed
up.
Saying
this
is:
who
wrote?
That
concludes
the
demo.
I
hope
you
enjoyed
it.
You
can
check
out
the
source
code
used
for
the
demo
in
GitHub
that
contains
terraform
artifacts
to
build
out
the
complete
two
region.
Four
cluster
configuration
and
install
blue
platform
links
to
the
GitHub
repo
and
the
companion
blog
posts
are
in
the
YouTube
comments
below
thanks
for
watching.