►
Description
Date: 03/05/21
Presenter: Jonathan Schwabish
Institution: Urban Institute
Title: "Teaching Data Visualization to Kids"
http://sbdh-prod.ideas.gatech.edu/resources/newsblog/education-and-workforce-working-group
A
A
All
right,
please
give
me
a
thumbs
up,
so
I've
spent
some
time
teaching
dataviz
at
their
well,
my
daughter's,
not
in
middle
school,
but
at
elementary
school
I
I've
taught
dativis
there
and
since
the
pandemic,
I've
taught
some
virtual
classes
in
around
the
country.
I've
done
a
few
classes
in
florida,
a
couple
in
new
york.
I
did
one
a
fourth
grade
class
in
new
york
last
week
through
the
skype,
a
scientist
program
or
a
project.
A
But
I'm
gonna
talk
about
how
I've
approached
teaching
database
to
kids
in
you
know,
basically
an
hour
or
90
minute
session,
especially
for
for
elementary
and
middle
school
students
and
as
we're
not
a
mention.
This
is
ultimately
going
to
be
part
of
a
much
larger
project
that
my
urban
colleague,
claire
bowen
and
I
are
working
on.
A
Is
one
of
the
south
data
hub
seed
grants
we'll
be
working
on
a
portal
to
provide
information
to
teachers
and
educators
on
how
to
teach
stem
and
data
science
to
kids,
especially
in
the
virtual
world,
which
I
know
many
of
us
can
sort
of
see
the
end
of
the
tunnel
of
the
pandemic.
But
I
think
we
can
also
all
agree
that
the
the
digital
the
virtual
world
is
here
to
stay,
and
so
it's
going
to
be
a
challenge.
A
I
think
for
lots
of
of
people
and
communities
and
educators
to
to
continue
their
efforts
to
teach
kids.
So
let
me
talk
about
dative
is
in
general,
so
you
know
I
have.
I
don't
think
this
is
a
sort
of
crazy
belief,
but
a
lot
of
us
know
our
basic
charts,
like
bar
charts
and
line
charts
and
pie
charts,
because
we
learn
about
them
in
elementary
school.
My
kids
actually
get
taught
histograms,
which
I
think
is
is
incredible,
but
a
lot
of
people.
A
You
know,
I
think
one
of
the
challenges
of
communicating
complex
data
is
a
lot
of
people.
Don't
know
graphs
like
histograms
or
scatter
plots
and
there's
lots
of
other
graph
types
out
there
that
we
can
use,
as
as
content,
creators
and
those
other
graph
types,
those
different
types
of
graphs
we
can
use,
because
sometimes
they
are
inherently
better
at
showing
data.
A
So
to
get
them
out
of
not
you
know,
they
don't
just
know
line,
charts
and
bar
charts
and
pie,
charts
that
they're
going
to
learn
about
different
graph
types
so
that
they
can
be
good
data
consumers
and
ultimately
many
of
them
will
be
data
producers
when
they
grow
up.
The
second
thing,
especially
for
elementary
school-aged
kids,
is
to
have
you
know
an
active
physical
learning
environment
so
then
to
actually
do
something,
I
think
for
anyone.
Well,
we've
all
been
kids.
A
If
you
can
remember
for
some
of
us
remembering
back
further
than
others.
If
you
can
remember
back
that
long
of
what
it's
like
to
you
know,
sit
in
a
fourth
grade,
classroom
and
and
listen
to
someone
drone
on
it's,
you
know
not
as
comfortable
as
that
as
it
we
may
want
it
to
be,
and
so
getting
the
kids
to
do.
A
I'm
gonna
show
you
how
I've
done
that,
so
the
basic
structure
of
this
hour
hour
and
a
half
session
is
first,
I
talk
about
data
visualization.
Then
we
do
a
drawing
exercise
and
then
in
when
it's
in
person.
Obviously
I
haven't
done
that
in
about
a
year
when
it's
in
person,
we
have
a
card
game
that
we
play
and
I've
set
up
the
card
game
to
be
sort
of
a
tournament
of
sorts.
So
in
the
virtual
world.
A
I
just
do
these
first
two
activities
but
I'll
talk
about
this
third
activity
as
well.
Today,
okay,
so
first
we
talk
about
the
lecture
and
and
again
what
I
focus
on
is
expanding
their
graphic
literacy,
so
I'm
gonna
show
them
a
variety
of
different
graphs,
but
within
the
con
within
this
confine
of
having
you
know
pretty
much
about
an
hour,
I'm
not
going
to
do
a
lot
of
different
graphs,
but
I
am
going
to
focus
on
maps
and
I
focus
on
maps
for
a
couple
of
different
reasons.
A
One
is
that
the
kids
generally
are
going
to
recognize
maps.
They
are
going
to
be
familiar
with
how
maps
work
this
sort
of
general
maps,
how
they
work,
and
so
I
start
with
showing
them
showing
them
a
map
of
the
world
and
generally
I'll
also
say
I'm
on
my
mac
today,
but
in
the
virtual
world.
I've
been
doing
this
on.
A
On
my
surface
pro,
so
I
can
actually
draw
on
the
screen:
it's
a
little
bit
harder
with
the
with
the
mac
to
do
that,
but
when
I
show
them
this
map,
I
start
asking
them
some
questions
and
again,
I'm
focusing
on
the
virtual
rule
today
do
this
in
person
two.
But
you
know
you
know
circle,
austria,
I'll
circle,
australia.
You
know
what
country
is
this
circle,
china?
What
country
is
this
circle
some
of
the
smaller
countries?
A
Maybe
the
countries
that
they
don't
that
I
wouldn't
expect
them
to
know
about
and
see
how
many
they
can
sort
of
get
they
they
automatically.
They
immediately
get
engaged
with
that
because
the
this
is
a
a
familiar
visual
to
them.
This
is
something
that
they
can
recognize,
and
many
of
them,
especially
fourth
and
fifth
graders-
are
have
have
learned
about
this.
The
last
country
I
focus
on
is
the
united
states.
A
I
haven't
taught
this
outside
the
u.s
yet
so
that
would
that
would
change
my
approach,
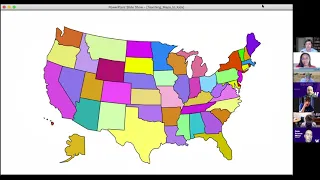
but
then
we
focus
on
the
u.s.
We
focus
on
do
the
same
sort
of
exercise
circle.
Some
some
states
see
if
they
can
find
their
state
and
then
we
zoom
in
to
their
area.
So
this
is
my
town
of
mclean
virginia
when
I've
taught
this
in
my
kids
elementary
school.
This
is
where
we
focus
in.
I
ask
them
to
identify
some
some
areas.
A
You
know
my
home
over
here
on
the
on
the
right,
the
elementary
school
there
and
then
the
the
little
league
ball
fields
in
the
bottom
right
and
then
there's
a
big
tyson's
corner
mall
over
there
on
the
left
and
so
on.
You
know-
and
I've
done
this
when
I
do
this.
When
I've
been
doing
this
virtually
for
other
places,
you
know
it's
really
easy
to
just
go.
A
So
we
started
with
the
world
we
dive
into
the
united
states.
We
then
go
to
the
city
or
then
we
go
to
the
state.
Then
we
go
to
the
city,
and
then
we
talk
about
their
their
home
that
we
can
actually
draw
maps
of
anything,
and
this
is
going
to
be
the
drawing
exercise
and
we're
going
to
come
back
to
this
in
just
a
little
bit.
So
then
I
dive
into
some
data-driven
maps
and
I've
tried
to
use
maps
that
I
think
are
interesting.
That
will
engage
them.
A
That
will
get
them
to
think
a
little
bit.
So
this
is
a
called
a
dot
density
map.
It
has
a
dot
for
every
graveyard
in
the
united
states,
there's
clearly
a
sort
of
yellow
glowy
area
in
you
know
that
tennessee
kentucky
west
virginia
area.
When
you
ask
the
kids,
you
know,
why
do
you
think
there's
there's
a
lot
of
graveyards
there.
You
know
I'll
say
pretty
quickly.
A
In
my
experience
they
actually
figure
out
that
it's
the
civil
war,
that's
why
you
have
a
lot
of
a
lot
of
graveyards
in
that
particular
area
of
the
country
and
I've
had
kids.
You
know
note
that
you
know
wise.
Is
this
glowy
area
in
connecticut
and
rhode
island-
and
you
know
that's
probably
due
to
the
revolutionary
war,
so
so
they
they
tend
to
figure
it
out
pretty
quickly.
A
The
other
question
that
comes
out
of
this
map
is:
why
is
it
so
dark
in
the
rocky
mountain
area
and
when
that
question
eventually
comes
up,
I
flip
to
this
map.
This
is
a
map
that
shows
the
distance
to
the
nearest
mcdonald's,
and
here
we
can
talk
about.
You
know
why
are
there
such
bright
clusters
in
the
big
metro,
areas
of
chicago
and
new
york
and
los
angeles,
but
not
so
much
in
the
in
that
rocky
mountain
area?
A
And
we
get
to
talking
about
there's
just
not
a
lot
of
people
living
there,
and
so
you
know
we
get
to
talk
about
that.
I
also
show
them
that
there
are
other
ways
to
show
maps
that
you
don't
they
don't
have
to
be
your
sort
of
standard
geographic
maps.
We
talk
about
this
one.
Now
it's
interesting
every
time
I've
done
this
class.
They
all
figure
out
that
colorado.
A
If
you
can
sort
of
see
my
cursor
here,
colorado's
the
happiest
state,
and
I
hesitate
to
tell
them
why
they're
so
happy
in
colorado,
we
haven't
legalized
marijuana
in
virginia
yet,
but
but
you
know,
it's
not
quite
appropriate
to
talk
about
drug
use
with
the
fourth
graders,
but
they
all
in
every
class.
I've
taught
they
somehow
key
on
on
colorado,
okay,
so
that's
sort
of
getting
them
keyed
up.
A
A
Yet
so
the
kids
all
draw
their
maps,
they
show
them
on
the
screen.
We
talk
about
that
a
little
bit
and
then
I
ask
them
to
place
some
data
on
the
map
and
I'll
say
again
when
I'm
using
my
my
tablet.
You
know
I'll
actually
do
this
exercise
first
I'll
actually
draw
a
map
of
my
house
on
the
screen
so
that
they
can
see
it
and
then
they'll
start
drawing
and
I'll
prompt
them
a
little
bit.
A
You
know
you
can
draw
circles
for
how
much
time
you
spend
reading
or
playing
video
games
or
where
you
walk
in
the
house
or
where
your
you
know,
your
pets
sit
and
then
you
know,
ask
what
did
they
create
and
they
actually
are.
You
know
they
get
pretty
excited
about
what
they,
what
they
show
and
I'll
just
show
some
pictures
of
of
what
the
kids
created
when
I
was
at
my
son's
elementary
school
in
2019
in
the
fall
of
2019.
I
did
this
over
there.
A
You
can
see
that
with
the
tracing
paper,
they
actually
you
know
they
they
get
pretty
into
this
and
and
they
get
excited
about
all
the
drawing
and
they're
they're,
pretty
pretty
smart
and
pretty
clever
about
what
they
draw.
And
you
see
we
actually
in
this
in
this
one
classroom.
We
had
a
lot
of
things
that
they
that
they
that
they
drew
the
time
how
much
they
like
the
room
where
they
use
their
computer,
their
ipad,
where
they
played
where
they
walk
rooms.
They
don't
go
in.
A
A
You
know
I
live
in
virginia,
I
can
see
virginia
in
the
map
and
they
can
see
this
very
specifically
when
you're
talking
about
you
know
give
me
a
map
of
your
of
a
floor
in
your
house
and
then
the
final
project,
when
this
is
in
person,
is
to
play
a
game,
and
I
have
a
data
visualization
card
game
on
my
website
and
I'll
link
to
that
in
the
in
just
a
moment.
But
it's
basically
if
anyone
has
played
spot
it,
it's
basically
a
version
of
spot
it.
A
You
have
multiple
graphs
on
each
card
and
the
game
is
to
just
identify
the
matches
of
the
different
different
game,
the
different
graph
types,
and
so
what
I
do
is
I
give
each
kid
they
get
their
own
deck
that
they
can
take
home.
They
get
their
own
deck.
They
spend
about
five
or
ten
minutes
trying
to
learn
about
the
different
graph
types.
A
The
last
thing
I'll
just
mention
is
we
did
had
a
proposal
right
at
the
end
of
right
before
the
pandemic
starts
to
actually
do
an
evaluation
of
this
learning
sequence
that
we
were
going
to
do
in
the
spring
of
2020
at
my
kids
elementary
school.
But
of
course,
once
things
closed
down,
we
weren't
able
to
do
it.
But
basically
we
had
this.
A
In
another
class
we
were
going
to
do
a
lecture,
a
matching
exercise,
so
they
were
going
to
get
a
piece
of
paper
with
a
graph
on
one
side
and
the
name
on
the
other
and
and
then
they
were
going
to
get
the
the
mapping
exercise
and
then
a
quiz
and
then
the
third
class.
They
would
get
this
other
combination
and
we
were
going
to
do
a
quiz
that
day
and
then
come
back.
A
A
few
weeks
later,
we
actually
had
an
agreement
in
in
hand
with
the
principal
of
our
school,
and
then
the
pandemic
happened
and
everything
sort
of
shut
down,
but
this
is
still
in
the
in
the
in
the
back
of
my
head,
so
something
that
hopefully
we'll
be
able
to
do
in
in
you
know
probably
2022,
which
would
be
you
know,
which
would
be
fun
to
really
see
how
this
how
this
works.
So
again,
our
goals
here
were
to
expose
the
kids
to
different
graph
types.
A
We
wanted
to
make
it
active
and
physical,
which
we
did
drawing
the
map
and
playing
this
game
and,
of
course,
having
fun
and
then
the
activities
the
basic
activities
were
to
have
this
lecture.
Then
this
drawing
exercise
and
then
the
card
game
and
then
later
on.
We
would
have
these
additional
exercises
that
we
have
the
kids
do.
A
So
I
am
going
to
just
pop
this
code
in
here
from
fanny
chevrolet
and
her
and
her
colleagues
about
developing
data,
visualization
literacy
and
again,
you
know
the
way
that
people
become
good
data
vis
and
data
consumers
and
producers
is
they.
Is
they
learn
about
these
different
graph
types
and
different
ways
of
of
working
with
data,
and
so
that's
what
we're
trying
to
do
here
and
get
this
started
right
in
an
early
age.
So
I
will
stop
there
and
hand
the
screen
back
to
renata
and
thank
you
so
much.
B
Muted,
okay,
I
hit
it
said
I
said,
thank
you
so
much
john.
There
was
a
lot
of
interest
in
the
chat
about
the
game,
the
name
of
it
and
the
link
to
where
you
could
get
it.
So,
if
you
put
that
in
the
chat
we'll
put
in
the
ether
pad
or
if
you
put
it
directly
in
the
ether
pad
that'd
be
great,
there
may
also
be
questions
over
there
for
it.