►
From YouTube: WebPerfWG call 2021 09 16 - Smoothness
Description
No description was provided for this meeting.
If this is YOUR meeting, an easy way to fix this is to add a description to your video, wherever mtngs.io found it (probably YouTube).
A
A
So
no
talk
on
animations
is
great
without
some
nifty
animations,
but
since
I
dared
not
cast
them
over
video,
here's
just
a
photo
of
the
most
popular
animation
I
could
think
of.
For
those
who
don't
know.
This
is
a
poster
circle
and
it
was,
I
remember,
being
deeply
inspired
in
sort
of
compositor
driven
animations
and
css
animations
back
in
the
day.
A
I
want
to
look
under
the
hood,
at
least
for
chromium
and
then
my
team's
efforts
in
the
space
and
the
help
and
feedback
wanted
again
all
right
might
as
well
dive
right
in
so
hopefully
the
broad
definition
of
animations-
and
this
is
somewhat
intuitive,
the
goal
being
to
show
every
single
visually
complete
animation
frame
or,
to
put
it
more
plainly,
no
jank,
but
the
specifics
of
how
exactly
to
measure
that
can
be
a
bit
elusive
and
essentially
we'll
have
to
dive
into
the
details
involved
there.
So
for
now.
A
A
So
why
even
work
on
this?
So
very
common
feedback
from
developers
includes
the
the
following.
So
so,
for
one
thing:
a
replacement
for
raf
polling
to
diagnose
main
event,
loop,
hip
cups,
so
rath
polling
for
those
who
don't
know,
is
using
request
animation
frame
api
to
continually
ask
for
animation
frame,
callbacks
count
how
often
those
actually
get
fired
as
compared
to
the
expected
number
and
sort
of
guess
how
often
the
main
thread.
Therefore
event
loop
was
blocked,
preventing
animation
frames.
A
Now
the
the
act
of
wrath
polling
has
implications
on
performance
and
measurement.
So
it's
not
a
good
idea,
it's
a
bit
of
an
anti-pattern,
but
for
lack
of
a
of
an
alternative.
It
still
gets
done,
and
so
often
we
hear
about
folks
doing
it
only
periodically
to
take
a
sample
just
to
get
a
at
least
an
estimate,
and
so
this
was
kind
of
one
of
the
design
goals
for
the
frame
timing,
api.
A
A
The
page
is
often
split
up
into
tiles
and
everything
on
screen
and
is
nicely
rendered,
things
that
are
off
screen
may
or
may
not
be
rendered
or
discarded,
and
if
you
scroll
very
quickly,
you
might
see
sort
of
blank
portions
of
the
page
show
up
and
folks
often
say
you
know.
Why
is
my
page
broken?
Is
it
my
framework?
A
Is
it
this
or
that
or
whatever,
and
there's
no
real
insight
to
know
that
this
is
just
you
know,
the
gpu
is
just
trying
to
catch
up
with
rendering
what
was
already
previously
rendered
and
there
are
things
developers
could
do
to
lessen
the
likelihood
or
increase
the
likelihood
of
those
things
happening
and
there's
broad
confusion.
Often
we
see
reports
folks,
don't
even
know
that.
That's
the
reason
and
another
very
common
thing
is:
oh
hey.
We
just
did
this
big
revamp,
we
added
a
bunch
of
animations.
A
We
want
to
do
big,
rich
transitions
in
in
response
to
the
user
interaction.
What
effect
did
this
have
on
ux?
Is
it
even
running
smoothly?
Is
it
useful
for
users?
Is
it
doing
well
and
of
course,
sort
of
as
browser
and
animation
framework
implementers?
Are
our
changes
making
the
right
improvements,
so
most
of
these
questions
are
not
possible
to
answer
with
web
platform
apis
today
it
can
even
be
sort
of
exceptionally
difficult
to
diagnose
locally
with
with
detailed
instrumentation.
A
So
if
we
have
time
I'd
be
keen
to
learn
about
any
tools
or
tactics,
folks
in
this
room
are
aware
of
today,
or
you
could
just
reach
out
to
me
later,
but
hopefully
I
could
provide
at
least
some
clarity
about
how
we
tend
to
do
it
now.
Obviously,
I
will
have
to
skip
over
many
important
details
today.
So
here's
just
a
few
links
that
that
go
into
detail.
If
you
want
to
read
up
on
it
later
all
right.
So
let's
look
under
the
hood
at
least
for
chromium.
A
A
It
could
have
a
fixed
frame
rate,
a
variable
frame
rate
and
even
an
adaptive
frame
rate
and
the
gpu
process
gets
the
signal
and
then
it
decides
if
a
frame
is
needed
and
worth
attempting
you
know,
pages
aren't
always
in
the
foreground.
Sometimes
the
gpu
is
busy
we're
already
sort
of
have
back
pressure,
but
but
most
of
the
time
we
request
from
the
renderer
to
begin
creating
a
new
frame.
A
Now
within
the
renderer,
the
layer
compositor
gets
the
signal
and
it
starts
updating
its
internal
data
structures.
There's
a
bunch
of
input
that
can
be
directly
driven
on
the
compositor
thread
and
and
much
like
the
gpu
could
decide
not
to
start
a
frame.
The
compositor
could
decide
not
to
start
a
main
type,
but
typically
it
sends
that
signal.
A
So
it
sends
a
signal
to
the
main
thread
to
begin
maintoing
and
now
in
parallel,
both
the
composite
and
main
thread
are
trying
to
produce
a
frame,
the
main
thread
event
loop
could
be
experiencing
queuing
delay
due
to
tasks
and
then
there's
a
lot
of
work
that
goes
into
painting.
So
I'm
skipping
over
all
of
the
details
here,
but
this
is
typically
when
you
look
at
breakdowns
within
dev
tools
or
other
things
like
a
lot
of
focus
goes
into
this
main
thread:
update
portion
of
work.
A
A
We
raster
a
bunch
of
textures
that
moves
the
pixels
to
the
gpu
and
there's
this
extra
step
of
activation,
because
in
the
compositor
we
actually
have
copies
of
data
structures,
and
so
we
have
to
move
things
from
the
sort
of
temporary
working
copy
to
the
live
copy
that
gets
submitted
to
the
gpu,
the
gps,
the
draw
everything
swap
thing,
and
if
we
did
that,
all
before
the
vsync
timeline
or
deadline,
that's
when
a
fully
completed
frame
is
presented,
okay
and
we'll
have
to
run
along.
I
know
it's
complicated.
A
A
So
what
happens
here
is
the
compositor
sets
a
time
limit
for
the
main
thread
update.
If
that
limit
is
exceeded,
we
still
go
ahead
and
we
still
update
the
frame
with
the
latest
compositor
update.
Only
we
will
use
the
previous
state
from
the
last
main
thread
update
if
we
have
one
so
the
key
point
being
that
we
will
still
produce
a
new
frame
update,
it
might
not
have
all
of
the
rendering
changes
eventually
in
the
future
that
main
thread
update
will
complete.
A
We
hope,
and
whatever
active
compositor
update
at
that
time
is
available.
It
will
pick
up
those
changes
and
they'll
get
shipped,
so
we
very
often
see
a
steady
stream
of
partial
frame
updates.
That's
what
we
call
this
when
the
compositor
provides
an
update
without
a
main
update.
You
know:
how
do
you
account
for
that?
There
is
a
study
stream,
but
it's
just
not
fully
complete
and
what
happens
if
that
late
main
update
actually
ends
up
with
no
rendering
changes
at
all.
A
Okay,
there
was
no
update,
even
desired,
in
which
case
all
of
those
past
partial
updates.
They
were
actually
visually
complete
after
all,
okay,
we
only
know
that
in
hindsight,
all
right,
so
how
do
we
account
for
that
or
what?
If
there
was
a
visual
update
from
the
main
thread,
but
it
wasn't
an
animation,
you
know
what
would
that
look
like
to
the
user,
so
you're
just
loading
some
content
into
some
placeholder
you're
attempting
a
visual
update,
but
it
gets
delayed
by
a
frame
or
two
you
know
for
the
user.
A
It
just
looks
like
any
other
loading
flow.
Okay,
the
delay
visually
to
the
update
is
identical
to
delay
from
the
network
or
processing
or
rendering.
It's
not
really
what
we
call
an
animation
jank
and
sometimes
you
know
there
really
is
a
visual
update
and
that
update
really
is
an
animation
and
it
really
is
delayed
a
frame.
A
A
A
A
Okay,
so
let's
look
at
some
real
examples,
all
right
to
do
so,
we're
going
to
use
a
tool
called
tracing,
there's
a
new
tool
called
perfedo,
but
for
today
I'm
going
to
focus
on
the
old
one.
Tracing
for
anyone,
not
familiar
tracing
is
sort
of
the
the
raw
signals
that
tools
like
devtools
use.
Underneath
the
hood
anytime,
you
do
a
like
a
performance
recording.
It
gathers
a
bunch
of
trace
events
and
then
it
sort
of
displays
it
in
a
custom
ui.
But
you
could
actually
record
your
own
traces
with
your
own
categories.
A
A
So
there's
a
bit
of
a
pipeline
here
that,
with
like
messages
sent
across
these
boundaries-
and
it
could
be
quite
daunting
to
follow,
especially
as
things
get
busy
so
for
that
reason,
there's
been
a
long-standing
effort
within
chromium
to
help
diagnose,
simplify
the
diagnostics
here,
so
I
like
to
think
of
it
as
sort
of
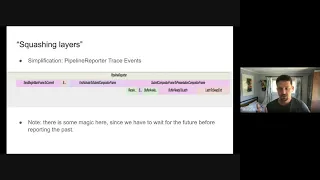
squashing
the
layers.
So
in
chromium
we
produce
something
called
the
pipeline
reporter
trace
event
and
from
from
here
on
in
this
talk,
this
is
kind
of
what
I'm
focusing
on.
A
So,
as
a
quick
note
in
order
to
report
this
summary
correctly,
we
have
to
actually
wait
kind
of
for
the
future
before
reporting
about
the
past,
so
it
it
makes
it
a
lot
easier
to
look
at
traces
that
were
recorded
in
order
to
make
them
understandable.
But
just
know
that
when
you
see
some
of
these
things
reported,
they
weren't
actually
known
at
the
time
that
they
were
reported.
A
If
that
makes
sense,
also
for
anyone
who
will
dig
in
here
a
bit
about
naming
some
of
these
breakdowns
have
long-winded
names
like
submit
begin
mainframe
two
commit
that's
just
basically
saying
from
the
the
point
in
time
where
we
submitted
the
big
and
mainframe
call
until
we
started
committing,
and
so
it's
the
time
in
between
those
two.
But
I
linked
to
some
of
the
docs
earlier
that
go
into
greater
detail.
A
A
That's
because,
as
I
said,
a
missed
frame
with
no
update,
we
don't
really
consider
a
jank,
so
some
animations
are
obvious
and
sort
of
easy
to
define,
such
as
scrolling
or
css
animations.
You
know,
raph
driven
animations
are
more
conditional.
The
mere
act
of
creating
a
callback,
a
request,
animation
callback.
It's
not
really
sufficient
to
prove
that
there's
a
running
animation.
A
It
depends
on
what
happens
within
that
callback
and
at
least
in
chromium.
We
recently
we're
trying
to
detect
sequences
of
direct
style
updates
on
animatable
properties
of
elements,
okay,
so
so
kind
of
style
like
direct
js,
driven
animations.
This
is
not
my
area
of
expertise,
so
I
link
to
a
document
that
goes
into
much
greater
detail.
A
So
if
we
were
to
select
any
of
these
pipeline
reporter
events
within
a
trace,
you'll
get
a
lot
of
metadata.
I
think
I'll
skip
some
of
this,
but
but
it
tells
you
the
frame
sequence
and
what
active
animations
we're
running,
and
this
is
very
useful,
and
so
if,
if
pipeline
reporter
events
know
about
the
animations
that
were
active,
we
can
also
sort
of
flip
the
script
and
look
at
the
active
animations
which
know
about
the
frames
that
were
produced
all
right.
A
And
so,
if
you
dive
deep
you'll,
be
able
to
look
at
the
details
here.
So
here
we
have
a
touch
scroll
animation
and
we
could
see
how
many
frames
were
expected
over
the
duration
of
that
scroll
and
we
know
how
many
were
actually
produced.
So
in
this
case
you
know,
five
frames
were
dropped
according
to
this
particular
definition.
A
So
one
interesting
detail
here:
this
animation
took
over
four
seconds
and
if
we
assume
60
frames
a
second,
we
should
probably
expect
245
frames,
but
we
actually
see
125
are
expected
and
I
would
ask
the
audience
to
guess.
But
I'll
say
it's,
because
it's
driven
by
your
finger
and
your
finger
isn't
always
necessarily
moving
a
sufficient
amount
to
produce
a
new
frame.
So
it
really
depends
on
how
fast
you're
flicking,
if
that
makes
sense,.
A
A
You
know
we
have
partial
updates
where
we
we
know
we
have
a
stale
main,
but
we
produced
a
new
frame
with
some
new
thing.
What
happens
if
you're
rapidly
scrolling
and
it's
a
perfectly
smooth
scroll
and
some
of
the
mainframe
update
is
lagging
it's
not
even
you
know,
is
that
even
detectable
by
a
user
does
it
matter
if
the
scroll
is
very,
very
slow
if
it's
creeping
or
if
it's
flinging,
you
know
there
are
nuances
there.
A
What,
if
you're
dropping
frames
during
animation
idle
periods?
You
know
there
could
be
other
updates
happening.
That
could
be
interesting.
There
could
be
other
pages
that
are
sharing
a
renderer
process
that
have
updates
that
are
interesting
and
then
another
topic
is,
you
can
have
perfect
animation.
Smoothness
every
single
frame
is
presented
exactly
complete
and
on
time,
but
you
could
still
have
poor
animation
quality.
A
A
simple
example
here
is
video,
so
we
can
have
a
video
that
is
producing
every
single
frame
on
time,
but
the
actual
bit
rate
is
really
low.
There's
poor
network
quality,
the
user
isn't
impressed
with
the
actual
quality
of
the
video
another
example.
There
was
shared
to
me
by
microsoft.
Some
edge
engineers
were
working
on
scrolling
and
in
their
attempts
to
make
scrolling
buttery
smooth
and
always
instant.
They
sort
of
parallelized
enough
in
the
compositor
that
it
stopped
being
sticky.
A
You
would
have
this
jitter,
where
the
main
certain
updates
would
not
be
in
sync
with
others,
and
you
would
have
the
page
sort
of
jittering
around.
So
it's
perfectly
smooth
frames
were
generated,
but
it
wasn't
what
users
expected
users
preferred
a
slightly
less
performance
scroll
that
was
consistent
and
and
sort
of
visually
stable.
So
it's
a
trade-off
animation
impact
area.
You
know
some
animations
are
tiny
little
icons
in
the
background
that
are
barely
noticeable,
even
if
you
do
a
recording
and
look
at
them
in
slow
motion,
others
are
full
bleed.
A
You
know
obviously
important
and
that's
related
to
this
broad
concept
of
you
know
from
a
ux
perspective,
who's
to
know
which
animation
is
important
for
the
user.
It's
tough
all
right.
So,
for
all
these
reasons,
conceptually
it
seems
that
drop
frames
isn't
really
a
boolean
value.
It's
not
that
a
frame
is
dropped
or
not.
It's
a
bit
of
a
fractional
value
might
even
be
worthwhile
to
consider
it
a
probability
probability
that
it
mattered
to
the
user.
A
So
we
know
that
there
are
missing
updates
and
we
know
there
was
an
active
animation.
That's
not
what
is
a
probability.
It's
just
the
likelihood
that
this
was
actually
noticeable.
Jenk
for
the
user
is
a
probability,
and
so,
when
you
diagnose
real
live
pages,
we
find
small
imperfections
are
plentiful.
Okay,
even
in
the
smoothest
best
sites
that
users
rate
there
are
still
examples
of
of
core
performance,
but
because
not
all
of
these
imperfections
are
necessarily
noticeable
for
users.
A
A
A
Okay.
So
a
quick
recap
before
we
move
on
every
frame
may
be
fully
presented
partially
presented
dropped
entirely.
There
may
be
any
number
of
active
animations
which
require
an
update
from
either
place
even
fully
presented.
Frames
may
have
other
rendering
issues
such
as
checkerboarding
or
video
quality,
or
that
sort
of
thing
some
animations
are
trickier
to
track
than
others
and
user
expectations
for
animations
are
trickiest
of
all.
A
So
hopefully,
now
we
can
talk
about
why
something
like
frame
timing,
v1,
we
feel,
might
probably
doesn't
cut
it
at
the
very
earliest
motivations
for
frame
timing.
V1,
as
I
understand
it
at
least
they
included
understanding,
animation
performance,
especially
things
like
scroll,
but
it's
really
evolved
towards
just
providing
data
about
browser
event.
Loop,
there's
no
coverage
for
compositor
updates.
As
far
as
I'm
aware,
which
is
where
most
many
important
animations
like
scrolling
tend
to
happen.
A
There's
no
notion
about
active
animations
at
all
either.
So,
while
there's
certainly
value
in
understanding
browser
event
loop,
we
already
have
long
tasks,
we
have
event
timing
and
we
have
element
timing
which
cover
presentation
times
for
specific
key
moments,
which
is
why
we
think
we're
seeking
an
alternative
to
frame
timing
v1.
At
least
we
discussed
that
a
bit
last
year
at
tpac.
I
suspect
we'll
want
to
continue
to
discuss
it
this
year.
A
So
in
case
I
haven't
convinced
you
that
it
can
get
tricky.
Here's
a
screenshot
of
how
things
tend
to
look
on
real
live
sites,
so
tracing
ui
will
create
sort
of
a
new
row
every
time
it
needs
to
make
room
for
overlapping
events,
and
here
we
have
at
least
six
rows
created,
because
many
parts
of
this
pipeline
can
happen
in
parallel.
There
are
always
frames
in
flight,
okay,
new
compositor
updates
might
start.
While
we
stop
pending
main
updates,
as
you
saw,
the
gpu
could
be
working
to
show
the
last
update.
A
We
could
start
multiple
main
thread
updates,
even
within
a
single
vsync.
In
case
we
get
an
even
newer
update
within
deadline,
especially
if
you
have
an
old
stale
one
that
just
finished.
We
might
want
to
start
a
new
just
try
to
get
a
quicker,
sequential
update
and
then
somewhat
specific
to
the
way
chromium
reports.
These
events,
you
can
have
copies
of
these
things
just
because
the
trees
tend
to
fork,
and
so
you
just
need
to
duplicate
some
of
the
breakdowns.
A
So
all
this
to
say,
pipeline
reporter
was
added
to
simplify
things,
but
it's
still
very
complicated,
so
some
of
my
own
experiments
are
focused
here.
So
how
do
we
take?
These?
Live
traces
from
real
sites
convert
all
the
pipeline
reporter
events
into
a
single,
simple
timeline
as
best
as
we
can.
How
do
we
convert
that,
like
all
those
individual
data
points
into
a
rolling
score
over
time
and
then
try
to
convert
that
timeline,
which
has
a
bunch
of
detail
into
a
single
summary?
Okay,
all
right
so
visuals?
A
So
here's
a
a
graph.
This
is
this
is
some
of
the
post-processing
that
I've
been
working
on,
which
shows
the
different
signals.
You
could
look
at
different
animations
different
frames,
different
criteria,
so
here
sort
of
the
large
red
area
is
when
we
know
we
have
missing
main
thread
updates
during
main
thread.
A
So
if
you
look
at
a
recording
of
what
this
actually
looked
like,
there
were
visible
hiccups
early
on,
but
they
felt
very
much
just
like
loading
issues
and
then
later
on.
Scrolling
was
actually
very
smooth,
and
maybe
there
was
a
lack
of
timely
main
thread
updates,
but
they
certainly
weren't
noticeable,
because
scrolling
was
smooth
and
that's
what
the
user
was
doing.
So
in
this
particular
timeline,
there
is
plenty
of
imperfection,
but
the
x,
the
page
experience
of
this
example
actually
felt
pretty
good
to
users.
It's
pretty
tough,
pretty
tough,
to
draw
conclusions.
A
You
have
sort
of
a
merged
timeline.
Unfortunately,
this
has
to
be
a
bit
opinionated,
since
the
relative
value
of
each
of
these
signals
will
differ
and
the
merged
graph
has
scores
if
you
notice
that
they
lie
kind
of
between
the
extremes
of
each
of
the
signals
and
then
we
can
try.
We
could
try
to
convert
that
timeline
into
a
single
score
and
again,
this
kind
of
has
to
be
a
bit
opinionated
and
we're
not
even
close
to
sure
what
the
right
approach
is
here,
so
we're
trying
a
bunch
of
things.
A
So
in
chrome
today,
if
you
use
canary,
you
could
find
this
flag
where
you
can
ask
to
display
a
performance
hud.
Not
only
will
it
short
core,
what
show
you
live
core
web
vital
scores?
There
are
some
early
experimental
definitions
for
some
different
ways
of
considering
drop
frames,
so
the
way
we
detect
animations
continues
to
evolve.
The
way
we
turn
those
into
the
definition
of
a
drop
frame
continues
to
evolve
and
then
the
overall
turning
it
into
a
single
score.
A
We
also
have
some
early
entries
in
sort
of
chrome,
ukm
data,
which
is
our
field
data
collection,
but
yeah.
The
definitions
don't
necessarily
match
all
of
what
I
I
mentioned
today.
Yet
they
continue
to
evolve,
but
just
pointing
this
out
and
then
there's
also
some
integration
already
dev
tools
to
displaying
timelines.
Do
performance
recordings
you'll
see
the
the
frames
displayed,
but
then
they're
also
color
coded
according
to
the
statuses
like
what's
in
there.
A
A
You
need
to
use
tools
like
what
I
showed
today,
and
so
hopefully
I
gave
you
a
few
new
tactics
to
play
with,
but
if
your
goal
is
to
understand
field
data,
I
think
that
you
need
a
lot
of
simplification
and
generalization
and
we,
I
think
we
still
have
a
lot
left
to
learn.
So
we
are
playing
with
our
own
experiments
here
to
try
and
understand
what
our
own
expectations
are,
but
this
is
an
evolving
process.
A
Now.
Last
time
I
presented
ryosuke
asked
a
great
question
specifically
around:
why
are
we
focused
on
drop
frames,
especially
in
a
world
with,
like
variable
refresh
rates?
You
know
shouldn't
we
be
striving
to
produce
frames
as
often
as
possible,
as
opposed
to
failing
to
produce
when
we
try-
and
it
was
a
very
good
question-
and
I
think
that
we
often
have
been
talking
about
it
in
terms
of
percentage
dropped.
A
So
for
every
attempt
was
it
successful
or
not,
and
then
turning
that
into
sort
of
percentage
and
the
reason
we
think
about
it?
That
way
is
because
idle
time
we
consider
good,
like
it's,
fine
idle
time
is
smooth
and,
and
so
percent
drop
is
kind
of
like
frames
per
second,
if
you're
playing
a
game,
it's
really
a
one-second
rolling
average.
A
Of
how
many
times
a
new
update
was
presented,
but
even
within
games,
there's
a
trend
towards
more
accurate
times,
more
accurate
measurements
like
frame
to
frame
delay,
and
this
is
you
could
take
the
maximum
frame
to
frame
delay
within
a
second
or
the
average
frame,
different
delay.
And
so
you
know,
if
you
just
look
at
fps,
you
might
have
60
fps
that
drops
down
to
55..
A
You
know
that
could
look
different.
That
could
be
five
frames
equally
dispersed
within
that
second
or
it
could
be
five
frames
in
a
row
which
was
very
obviously
a
long
latency
for
a
new
frame
update,
and
so,
if
your
goal
is
to
ensure
that
every
animation
update
takes
no
more
than
say
10
milliseconds
of
latency,
which
would
be
a
crazy
high
goal.
But
if
that's
your
goal,
I
still
think
you
probably
want
to
identify
animations
ignore
animation.
A
Idle
periods
still
solve
these
nuances
of
what
do
you
do
with
partial
frame
updates
for
compositor,
driven
animations
and
what's
important
for
users,
but
then
you
could
take
this
data
and
interpret
it
in
a
way
where
your
your
goals
are
a
lot
higher
than
things
so
so
this
is
where
there's
differences
of
opinion.
I
think
it
will
depend
on
your
outcomes
if
that
makes
sense,
but
I
think
a
lot
of
the
groundwork
is
shared,
no
matter
how
you
interpret
the
results.
A
Okay,
all
right!
Now
we
get
to
how
we
can
help-
and
hopefully
some
discussion
today.
So
first
of
all,
you
know
I
said
frame
timing.
V1
is
not
sufficient
for
measuring
animations,
but
is
there
still
some
strong
desire
for
better
diagnostics,
specific
to
main
event,
loop
processing?
I
would
love
to
know
that,
and
then
I
talked
about
how
animation
smoothness
only
during
animations
could
miss
other
downsides
of
of
skipping
rendering
such
as
progressive
loading
or
responsiveness,
but
I
think
these
are
already
covered
by
more
directly
by
existing
perf
apis.
A
Like
event,
timing
and
element,
timing
and
long
tasks,
so
do
folks
agree
is
that
is
that
good?
Is
that
separation
of
concerns
agreeable
for
the
other
implementers
I've
you
know
tried
to
investigate
as
much
as
I
can,
but
I'd
love
to
know
if
there
are
any
surprises
if
breakdowns
are
significantly
different.
If
we
need
to
change
entirely
the
way
we're
thinking
about
this,
so
the
more
we
can
learn
quicker,
the
better
and
then
for
field
data
consumers,
you
know
how
much
detail.
Do
you
want?