►
Description
PagerDuty had the misfortune of watching its abused, underprovisioned Cassandra cluster collapse. This talk will cover the lessons learned from that experience like:
• Which of the many, many metrics did we learn to watch for
• What mistakes we made that lead to this catastrophe
• How we have changed our use to make our Cassandra cluster more stable
Owen Kim is a Software Engineer at PagerDuty and enjoys whiskey, riding his Honda Shadow 600 (named "Chie") and discussing the finer points in narrative and expression in video games.
A
A
Basically,
this
is
a
talk
on
essentially
pagerduty
back
in
june.
Had
the
misfortune
of
watching
our
cassandra
cluster,
like
crumble,
fall
to
pieces
and
melt,
and
so
this
is
essentially
a
story,
a
story
of
that
and
the
lessons
learned
from
that
yeah.
You
always
just
shut
your
eyes
right
like,
but
there's
always
the
one
guy
who
doesn't,
and
that
was
us
anyway.
So
I'd
be
a
little
bit
remiss
if
I
didn't
talk
about
what
page
of
duty
is
to
start
with,
someone
would
probably
yell
at
me.
A
What
page
of
duty
is,
if
you
don't
know,
is
pagerduty
is
an
alert
notification
and
incident
management
system.
Essentially,
if
you're
running
any
kind
of
web
service,
you've
probably
got
you
know
a
swath
of
different
monitoring
services
to
make
sure
that
you
know
everything
is
fine
and
dandy.
Well,
we
integrate
with
all
of
those
monitoring
services,
centralize
them
all
into
one
place
and
also
collect
you're
on
calls.
A
You
know:
notification
contact
contact
methods,
their
preferred
ways
to
be
contacted
they're
on
call
schedules,
your
escalation
policies
in
case
someone
doesn't
answer,
and
basically,
and
essentially
when
something
goes
wrong
within
your
system.
We
make
sure
that
someone,
someone
is
notified
so
that
they
can
hop
on
it
and
handle
it,
and
so,
with
that
in
mind
again,
the
key
point
is
that,
if
what
we're
providing
is
you
know,
a
notification
when
your
systems
are
down?
Obviously
a
huge
constraint
on
us
is
to
be
up.
You
know
what
good
is.
A
What
good
is
an
alert
notification
service
that
doesn't
actually
receive?
You
know
receive
events
if
you
can't
tr
and
if
you
can't
trust
us
who
can
you
trust
so
to
kind
of
go
into
that?
What
how
pagerduty
works
at
cassandra
and
how?
What
we're
kind
of
using
it
for
is
a
lot
of
it
is
around
kind
of
this,
the
redundancy
and
the
independent
faults
and
the
distribution,
so
we
actually
use
it
for
providing
durable
and
consistent
re
reads
and
rights
in
sort
of
a
critical
pipeline
in
pagerduty.
A
For
us,
we
integrate
with
http
endpoints,
which
either
generically
first
party
integrations
without
monitoring
services
or
just
a
generic
email
endpoint,
but
basically
we
we
have
a
set
of
a
set
of
distributed
endpoints
and
then
that
flows
through
the
whole
system
goes
to
the
say
in
instant
management,
goes
through
a
notification,
management
service
and
they'll
ultimate
to
the
messaging
service
that
actually
reaches
out
to
reaches
out
to
people.
So
we
we
have
this
sort
of
pipeline
of
separate
surfaces
that
that
provide
that
must
always
be
up
and
flowing
and
healthy.
A
This
is-
and
this
is
also
this
is
built
on
top
of
separate
scholar,
scholar,
services.
We
again
leverage
cassandra
for
a
durable
platform,
as
well
as
using
other
kind
of
technologies
like
distributed
technologies
like
zookeeper,
for
coordination
in
terms
of
the
volume
that
we
take
we
take
in.
We
currently
get
around
25
requests,
requests
of
seconds
from
from
various
monitoring
services
or
people's
infrastructure,
and
each
one
of
those
turns
into
you
know
a
handful
of
cassandra
operations
followed
by
you
know
the
ace
actual
asynchronous
processing
that
goes
through.
A
So
each
one
of
those
actually
turns
into
a
fair
amount.
A
fair
amount
of
load
and
pagerduty
also
has
sort
of
an
internal
policy
that
we've
built
a
lot
of
architecture
around,
which
is
you
know
we
don't
lose
in
events.
We
don't
lose
a
message
if
we've
accepted
the
message,
we've
200
on
the
http
endpoint,
we
do
not,
we
never
don't
drop
it,
except
for
when
we
do
and
I'll
talk
about
that
a
little
bit,
we
don't.
We
don't
do
that
in
our
heart
of
hearts.
A
We
don't
we
don't
do
that,
except
for
the
little
corner
of
our
hearts.
That
sucks-
and
this
is
a
lot
of
our
a
lot
of
our
infrastructure
in
design-
is-
is
kind
of
around
this
around
this
principle,
so
kind
of
to
talk
a
bit
more
into
the
details
of
what
what
we've
built
in
regards
to
cassandra.
We
do
use
cassandra
1.2.
A
We
are
built
on
top
of
the
the
thrift
ap
api.
We
have
not
migrated
off
to
cql
we've
been
we've
had
cassandra
in
production
for
about
two
over
two
and
a
half
years,
so
we're
a
little
slow
it's
in
migrating
to
the
new
cql.
Also
over
the
years
we've
used,
you
know
hector
cassie
astin
acts
as
our
cli
as
our
various
clients,
we're
still
on
assigned
tokens
in
terms
of
the
how
to
assign
assigned
token
ranges
within
within
our
cluster.
A
A
The
point
the
the
idea
behind
that
is
basically,
as
I
said,
we're
using
cassandra
as
a
platform
on
a
critical
pipeline
and
so
in
this
critical
pipeline.
Once
it's
gone
from
start
to
finish,
it's
not
super
critical
in
this
pipeline
anymore,
and
so
we
actually
try
to
keep
our
data
set
and
our
therefore,
our
working
set
as
slim
as
possible
in
cassandra
and
sort
of
this
is,
and
then
this
is
kind
of
what
our
cluster
looks
like.
A
We
use
in
general
five
nodes.
So
as
though
we've
like
we
are
in
the
process
of
upscaling,
one
of
them
to
ten
nodes.
Again,
it's
also
it's
a
fairly
small
cluster,
but
we
use
those
five,
those
five
nodes
and
a
replication
factor
of
five
two
two
and
one
in
multiple
different
dc
dc
regions
and
and
actually
in
this
graph.
Basically
dca
is
aws
west
one
aw
dcb
is
aws.
West
2
and
dcc
is
linode
fremont,
and
so
we
have.
A
We
have
this
multiple
cassandra
set
up
on
multiple
regions.
We
do
use
quorum,
consistency,
level
operations
and,
like
I
said,
we
have
a
full
replication
factor
or
we
have
a
replication
factor
of
five
when
we
scale
them
up
we're
going
to
keep
the
same
replication
factor,
and
so
the
scaled
up
ones
look
like
four
four
and
two
nodes
in
a
cluster,
so
implications
of
that
they
are
so
like,
because
we're
doing
quorum,
consistency
level.
A
On
top
of
this,
like
a
two
two
and
one
cluster,
every
operation
does
a
cross.
When
you
know,
operation
read
or
write-
and
we
do
take
obviously
then
take
this
into
dc
latency
head
for
our
purposes
because
we're
talking
kind
of
like
a
pipeline,
that's
not
as
human
visible.
We
actually
think
that
we
actually
find
that
to
be
fine.
We
have
this.
We
have,
you
know
we're
not
latency
sensitive
because
of
that
we
are
latency
sensitive
in
that
the
pipeline
needs
to
maintain
a
reasonable
sla.
A
But
that's
on
the
order
of
you
know
a
couple
minutes,
not
you
know
milliseconds,
so
we're
actually
totally
we're
actually
able
to
maintain
that
latency
and
take.
We
are
more
throughput,
sensitive
and
more
con
concerned
when
it
comes
to
our
cassandra
setup,
because
we're
then
also
because
we're
using
cassandra
the
quorum
consistency
level.
A
We
have
consistent
reason
rights
and
that's
back
to
this
back
to
this
principle
of
I
drop
something,
let's
back
to
this
principle
of.
If
we
take
in
if
we
write
an
event
and
we
take
it
in-
it's
not
lost,
it
doesn't
get
lost
into
the
ether
of
the
internet
or
into
a
single
data
center
and
then
never
come
out
until
that
data
center
suddenly
reappears
if
we've
accepted
it,
it
needs
to
flow
through,
and
so
with.
A
You
know
in
production
to
make
sure
and
to
validate
that
that's
the
case
so
back
to
the
to
the
core
of
the
story
here
so
june,
4th
was
actually
the
fateful
day
on
june
4th
everything
kind
of
fell
to
absolute
core
pieces
and
kept
me
up
for
a
couple
nights
as
I
cried.
So
it
got
to
basically
to
a
point
where
a
center
cluster,
essentially
at
its
very
front,
end
at
the
very
core
front.
A
End
of
the
pipe
was
beginning
to
refuse
all
requests
and
no
new
events
were
coming
into
the
pipeline,
all
in
basically
effectively
all
in-flight
messages
in
the
pipeline
were
halted
and
basically
ground
to
a
complete
halt.
We
obviously
saw
pretty
some
like
degraded
performance
in
the
overall
pipeline
and
essentially
pagerduty
took
a
three-hour
outage
on
june,
4th
and
and
and
as
part
of
this
we
had
to
in
order
to
rectify
the
situation
and
I'll
go
into
this
more
deeply.
A
We
ended
up
having
to
basically
blow
away
all
the
data
in
our
cassandra
cluster
in
order
to
get
things
to
to
begin
to
flow
again,
if
you
want
to
know
all
the
gory
details
that
I
have
wept
about,
we
actually
have
this
like
a
very
public
blog
on
our
postmodern
blog.
That
we'll
talk
about
basically
the
extent
of
the
damage
that
this
did
to
pagerduty
it's
we,
we
tag
them
all
things
on
our
blog
as
postmortem,
so
it
should
be
fairly
easy
to
find
if
this
doesn't
get
posted
somewhere.
A
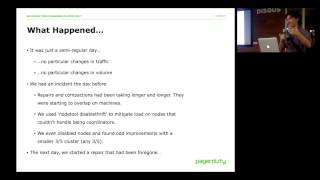
So,
yes
june,
4th
june
4th,
it
was
a
fairly
regular
day.
There
was
no
on
june
4.
There
was
no
particular
changes
in
our
like
in
terms
of
our
input
volume.
There
was
no
the
rate
of
traffic
didn't
change
significantly,
but
we
had
had
essentially
an
incident
on
june
3rd
the
day
before.
So,
what
happened
on
june
3rd
was
that
we
actually
saw
some
some
degraded,
some
some
degraded
just
a
minor,
a
minor
blip
in
our
in
our
cluster
someone's
laughing
at
me,
because
I
called
it
minor.
A
We
during
on
that
day,
on
june
3rd,
we
took
a
couple
of
remedial
steps
to
trying
to
try
to
mitigate
the
issue.
Some
of
the
some
of
the
nodes
had
particularly
high
particularly
high
loads,
so
on
those
ones
we
use
no
tool,
disable
thrift,
because
we
didn't
trust
them
to
work
as
coordinators
anymore,
and
that
also
that
saw
some
pretty
major
improvement.
A
We
actually
had
some
started
taking
down
some
nodes,
we
tr
and
we
also
for
a
head
foregone
like
we
were
supposed
to
do
a
repair
during
this
degraded
performance
and
we
actually
stopped
the
repair
before
it
started
and
to
put
it
off
to
another
time,
the
disabling,
the
node.
Things
really
did
work
and
we
saw
first
and
I've
never
been
able
to
explain
this
particularly
well,
but
for
some
re
for
some
reason.
During
this
time
we
took
our
cluster
down
to
three
nodes.
A
Instead
of
five
and
everything
and
like
load
just
dropped,
we
bring
one
up,
it
would
be,
it
would
skyrocket
again
and
then
we'd
break.
It
was,
and
it
was
any
three
out
of
five.
It
was
the
most
mysterious
thing.
Basically,
if
the
cluster
would
only
work
with
any
three
or
five
nodes,
I
have
no
strong
strong
theory
on
one
of
these.
I
thought
perhaps
it
was
maybe
hinted
hand.
A
You
know
every
we
brought
one
up
and
hinted:
handoffs
would
it
would
come
into
play,
can
come
into
play
and
kind
of
degrade
the
whole
cluster,
but
it
eventually
kind
of
repaired
itself,
and
even
though
the
hinted
handoff
should
have
still
been
a
factor.
So
I've
never
really
had
a
very
satisfactory
theory
on
that
one.
A
Anyway,
that's
a
bit
of
a
tangent,
so
the
next
day
since
we
had
base,
since
we
had
before
gone
a
repair,
we
were,
we
sat
down
to
sat
down
to
you
know
make
up
for
that
that
missed
repair,
and
then
this
happened-
and
I
don't
know
how
clear
this
is.
This
is
this
is
a
graph
of
one
minute
system
load
on
our
cassandra
cluster
and
if
you
can't
see
the
y-axis
very
well,
the
high-water
mark
where
it
hits
is
55
and
so
yeah.
A
A
Basically,
we
we
tried
a
number
of
different
things
to
to
mitigate
the
damage
that
we
were
seeing.
We
had,
we
had
certain
we
have,
we
stopped
the
less
critical
clients
or
less
critical
tenants
to
this
cassandra
cluster,
hoping
that
would
mitigate
load
and
it
had
no
real
meaningful
effect.
We
tried
to
disable
thrift
on
the
more
unhappy
nodes
to
know
real
to
no
real
fact.
We
tried
replicating
the
the
random
thing
where
we
took
down
nodes
and
we
couldn't
explain
and
that
had
no
effect,
so
we
basically
at
that
point.
A
Basically,
we
had
no
choice
but
to
actually
do
what
we
hate
and
do
and
lose
basically
lose
events.
We
blew
away
the
entire
all
of
our
cassandra
data.
We
deleted
the
commit
log,
those
caches,
the
data,
the
data
directories,
absolutely
everything,
and
then
we
restored
some
of
some
of
them.
We
have
a
very
small
small
subset
of
non-ephemeral
data.
We
restored
that
restored
the
schema
and
then
everything
purged
just
fine.
A
There
was
no
me
like
again:
there
was
no
meaningful
changes
in
the
data
set,
there's
no
or
in
the
traffic
patterns
or
the
traffic
volume
in
any
way.
But
again
we
blew
away
the
data
set
and
everything
worked
again
so
kind
of
talking
about
then
what
went
horribly
horribly
wrong.
So
one
thing
I
kind
of
hinted
at
at
that
we
were
doing
with
cassandra
at
the
time
is,
even
though
we
had
these,
you
know
services
in
a
critical
pipeline.
A
They
were
actually
at
the
time
all
being
served
by
a
single
cassandra
cluster.
This
was
this.
It
was
in
retrospect,
hindsight
2020
mistake.
There's
there's
an
I
suppose.
There's
there
is
an
argument
for
operational
ease
in
running
a
single
standard,
cluster
and
and
supporting
multi-tenancy.
I
don't,
but
I
I
don't
think
it's
worthwhile.
Basically,
even
during
this
this
horrendous
event,
we
were
trying
to
figure
out.
Where
is
this
load?
Where
is
this
load
potentially
coming
from?
What
that?
What
data
sets
is
it
is?
A
It
is
causing
this
what
traffic
patterns
was
causing
this
and
because
a
lot
of
our
a
lot
of
the
metrics
we
were
getting
were
all
very
much
at
the
at
the
cluster
level
and
not
at
the
key
space
level.
We
had
no
real
way
to
kind
of
to
at
very
quickly
and
at
a
high
level
narrowed
down
where,
where
this
was
coming
from,
the
other
issue
was
that
we
were
pre.
A
We
were
again
in
retrospect
kind
of
under
kind
of
under
provisions,
so
the
aws
nodes
that
we
were
using
at
the
time
the
ec2
nodes
were
m1
larges,
so
they
only,
they
only
had
two
cores
and
about
eight
gigabytes
of
memory.
So
when
looking
back
like
we
can,
I
def
you
can
definitely
see
in
our
metrics
that
the
cpu
was
was
was
hurting,
but
it
was.
I
think
it
was
definitely
also
the
memory
constraints
that
we
were
having.
A
That
was
really
really
harsh
and
I'll
show
I'll
show
a
little
bit
more
about
that
in
a
second.
The
next
thing
was
that
we
we
had
a
fair
bit.
We
had
like
monitoring
and
metrics,
but
we
the
hardest
the
hard
part
about
our
monitoring
and
metrics
was.
We
didn't
necessarily
have
meaningful
thresholds
and
high
water
marks.
Like
we
didn't
know
what
the
like,
what
is
like,
yes,
load
hits
skyrocketed,
that's
bad,
but
like
how
many
pending
compactions
is
bad.
How
many
like
how
many
blocked
flush
riders
is
bad?
A
So,
basically
what
I
mean
by
multi-tenancy-
and
I
I
meant
to
clarify
this-
is
that
for
our
we
have
again
this
this
multi-service
pipeline
that
has
different,
you
know,
scala
applications
of
it
and
each
one
was
talking
to
the
same
cassandra
cluster
and
their
their
data
sets
were
separated
by
by
key
space.
That's
what
I
mean
by
by
a
multi-tenancy
in
that
our
services,
our
applications
of
what
logically
separate
apps,
yes
within
our
in
within
our
infrastructure,
we're
talking
to
the
same
cassandra,
cluster,
okay,
yeah.
A
So
what
why
did
not?
We
not
see
this
sooner
clearly,
there
should
have
been
some
kind
of
warning
signs
and
to
some
agree.
Yes,
there
were,
but
I
like
to
tell
myself
a
few
things
about
what
the
mistakes
I
made
to
help
myself
sleep
better,
even
despite
the
fact
that
we
were
abusing
this
cassandra
cluster,
like
99
99.9,
some
a
lot
of
the
time
everything
was
fine.
Everything
was
great
great.
A
Our
read,
write
latencies
in
in
this
case
in
this
cluster,
we're
pretty
close
on
average,
we're
pretty
close
to
the
inter
dc
latencies
that
we
would
expect
you
know
if,
if
the
dc
latency
is
like
20
milliseconds,
our
reason
writes
about
20
milliseconds.
This
was
true.
This
was
true,
probably
99.9
percent
of
the
time,
despite
even
even
if,
like
load,
were
around
one
which
would
like
it
is
pretty
high.
We
would
actually
see
that
hey
it's
it's
still
operating
okay,
so
we
kind
of
there's
sort
of
in.
A
In
my
mind,
there
was
sort
of
this
lesson
that
cassandra
kind
of
had
this.
These
two
modes
of
operation,
everything's,
fine
or
everything-
has
gone
to
hell.
Furthermore,
we
kind
of
we
kind
of
thought
hey
if
everything
is
fine
most
of
the
time
and
it's
they're
wrong.
Sometimes
it
must
be
when
we
misconfigured
something.
We
thought
about
tuning
the
java
heat
memory.
We
thought
about.
You
know
throttling
compactions.
A
We
were
like
it's
not
us,
it's
it's
the
configurations
we
can
make
it
work,
we
can
make
it
work
right
right
and
then
finally
we
thought
we
aren't.
We
don't
have
a
lot
of
data.
Cassandra
is
supposed
to
be
able
to
handle
like
big
data.
So
therefore
we're
again
something
must
be
misconfigured.
We
we
should
be
able
to
make
this
work.
All
lies.
We
kind
of
told
ourselves
so
kind
of
back
to
like
that.
Like
constant
memory,
pressure
thing,
this
is
we
it's
like.
I
said
we
have
eight
gig.
A
We
had
eight
gigabytes
of
ram
on
the
boxes,
so
we
followed
the
defaults
of
the
jvm
heap
size,
which
was
a
quarter
of
it.
So
there's
about
two
gigabytes
of
memory
on
the
for
the
java
heap
on
cassandra.
You
can
see
there,
or
maybe
you
can
again.
The
y-axis
is
kind
of
small
and
I
apologize,
but
on
the
left,
it's
hanging
around
one,
it's
hanging
around
1.8
and
then
that
thing
in
the
middle
is
when
we
blew
everything
away
and
then
the
thing
on
the
right
is
that
after
it
really
blew
everything
away.
A
Basically,
what
we
were
seeing
was
like
gc
was
happening
in
the
in
the
jvm
on
cassandra
and
never
finding
more
space.
It
was
not
having
this
kind.
This
more
much
more
healthy,
like
up
down
of
garbage
collection,
happened.
Therefore,
there's
more
space.
Now
it
was
garbage,
collection
happened
and
it's
still
struggling
to
find
space,
that's
bad.
That
is
something
we
definitely
should
have
seen
and
kind
of.
Furthermore,
at
that
point
we
you
know
we
saw.
We
saw
some
other
things
in
our
logs.
A
The
logs
were
reporting,
you
know
we're
flush,
we're
flushing
this
column
family
to
relieve
memory
pressure,
and
that
was
there
and
to
be
seen
and
we
weren't.
We
did
not
act
on
that
and
harder
again
another
thing
harder
to
measure,
but
it
was
definitely
was
definitely
there
is
like
I
said
we
were
seeing
slower,
repairs
and
compaction
times
and
likely
that
was
actually
related
to
our
the
memory
pressure,
but
that
was
definitely
another
warning
sign.
We
should
have
acted
on
and
another
thing
that
was
that's.
A
Perhaps
we
that
I've
only
really
seen
in
retrospect
again
we
were
measuring
the
operations
latencies
and
in
terms
of
like
average
median
95th
percentile,
and
we
were
largely
looking
at
them
at
the
at
the
median
like
what
is
the
median
average.
Is
that
does
that
look
sane
right
now
in
our
semi
and
our
semi-healthy
in
our
what
we
consider
to
be
a
healthy
cassandra
cluster?
A
A
So
you
know,
because
we
are
on
multiple
different
providers,
so
we
can't
so
maybe
some
of
that
some
of
that
can
be
tracked
up
there,
because
they're
different
they're
different
nodes,
some
of
it
we've
also
seen
just
because
we
have
different
latencies,
but
links
between
dc's
that
actually
load
doesn't
actually
distribute
perfectly
in
our
cluster.
So
we
actually
see
some
asymmetric
load
in
our
cluster.
That
could
explain
a
difference
between
a
difference
between
our
p95s.
A
But
these
we,
if
you
look
back,
we
see
these
on
even
like
our
very
standard,
key,
very
simple
key
value
reads
and
writes
on
skinny
rows.
That
should
be
very
quick
and
very
quick
and
easy
and
stable
in
cassandra,
but
we
were
seeing
the
medians
at
the
median
and
the
p95
deviate
pretty
pretty
severely.
A
So
after
that
you
know
particular
day.
The
aftermath
was
particularly
rough.
We
we
blew
away
the
data
set
and
everything
was
fine,
but
obviously
there
was
a
in
our
minds
that
was
only
going
to
buy
us
a
little
bit
of
time,
so
we
had
to
take
some
pretty
clear
steps.
First,
off
we
bumped
up
every
single
node
immediately
to
m2,
x2
largest,
so
that
they
had
four
cores
and
32
gigabytes
of
ram.
Again,
I
think
that
I
think
the
gigabytes
around
there.
It
made
a
huge
difference.
A
A
Things
like
you
know,
pending
re-digest,
dependent,
compactions
flush
block
writers,
are,
is
one
that
I've
been
seeing
as
being
a
pretty
good
indicator
of
you
know,
load
and
need
just
needing
to
scale
and
also
drop
messages.
Your
drop
messages
are
just
bad
just
if
those
start
happening,
you
should
begin
to
worry
and
so
and
then
we
have
kind
of
a
set
of
lessons
lessons
to
learn.
As
I
said
before,
cassandra
feels
like
it
has.
Basically,
everything
is
fine
or
everything
is
very
much,
not
fine.
A
A
And
don't
try
to
squeeze
configure
too
many
configuration
issues.
It
should
be
easy
to
scale
as
the
next
lesson
like
it's
like
this
is
like
pretty
con.
This
is
a
common
operation
that
you'll
like
you'll,
be
doing
because
it's
a
cassandra
cluster
like
it's
one
of
the
reasons
you're
here
probably
here
now
that
I
am,
is
because
it
scales
well
so
like
the
the
the
operation
that
comes
that
you
need
to
do
in
order
to
scale.
It
is
something
you
should
definitely
practice
and
be
comfortable
with
in
case.
A
You
have
to
do
it
in
a
pinch,
and
the
next
thing
is
basically
because
I
mean
understand
that
cassandra,
the
performance
of
cassandra
to
tyrion
as
like
the
data,
the
data
set,
takes
shape.
It's
not
necessarily
the
operations
that
are
going
on
right
now.
It
has
to.
It
has
a
lot
to
do
with
the
you
know
the
the
data
set.
A
I
don't
think
that,
like
multi-tenancy,
I
don't
think
is-
is
worthwhile
whatever
operational
ease
that
you
can
get
out
of
multi-tenancy
and
running
a
single
cluster
with
multiple
clients
should
be
kind
of
mitigated.
If
you
have,
you
know
a
nice,
a
nice
robust
and
flexible
and
extensible
like
management
and
configuration
infrastructure
configuration,
so
we
internally
use
chef,
and
so
it
should
be
like
you
should
be
fairly
easy
to
use
those
kind
of
management
tools
to
bring
up
and
configure
and
start
running
new
clusters.
A
It
wasn't
for
us
at
the
time
I'll
admit,
but
it
we've
since
made
it
easier
cool.
Having
talked
a
little
fast,
I
think
that's,
that's
kind
of
all
from
me.
Thank
you
very
much
for
this
for
listening.
I
would
be
yelled
at
if
I
did
not
say
that
we
pagerduty
is
hiring
someone.
Someone
really
will
yell
at
me.
We're
hiring
like
people
all
over
we're
hiring.