►
From YouTube: Gateway GIS Analysis and Graphics Support
Description
No description was provided for this meeting.
If this is YOUR meeting, an easy way to fix this is to add a description to your video, wherever mtngs.io found it (probably YouTube).
A
A
Before
getting
into
the
content
for
today,
I
want
to
make
reference
to
some
related
content
that
we
developed
about
a
year
ago,
where
we
use
the
gis
work.
3D
modeling
that
was
being
developed
at
that
time
to
help
convey
how
a
form-based
code
could
be
used
to
translate
the
standards
from
the
gis
work
that
we
have
done.
A
You
can
find
that
video,
either
by
the
link
below
or
using
the
QR
code
on
the
side
here
and
I,
encourage
people
to
go
and
watch
that,
because
we
go
into
a
lot
more
detail
about
solar,
shading,
the
the
designs
and
how
they
would
translate
through
the
form-based
code.
So
that's
a
good
resource
for
you.
A
This
image
is
an
image
showing
the
current
zoning
you'll
see
this
orientation
with
Samoa
and
K
Street
identified
throughout
these
Graphics
or
other
street
names
identified
to
help
Orient
you
to
the
Views.
Since
these
are
a
little
odd
for
for
some
folks
to
be
looking
at
these
maps
and
a
little
disorienting
that
helps
you
learn
it
in
this
field.
If
you,
you
see
the
existing
zoning
there's
a
lot
of
industrial
zoning
and
purple
the
yellow
zones
and
brown
zones
are
residential
zoning
districts,
low
residential,
medium
and
residential
high
and
then
down
in
the
Eastern
corner.
A
There
you
see
some
commercial
zoning
along
Samoa
Boulevard
now.
The
reason
why
the
gis
started
with
the
existing
zoning
is
because
the
gis
was
primarily
an
Analytics
tool
to
help
us
understand
how
changes
in
zoning
that
are
being
proposed
to
the
Gateway
area
plan
would
affect
the
environment,
how
they
would
affect
utilities,
how
they
would
affect
circulation
and
these
kinds
of
environmental
review
questions.
A
We
compared
that
with
the
proposed
zoning,
which
you
see
here,
the
various
Gateway
districts
in
the
South
there
there's
the
Gateway
Barrel
District,
the
blue
color,
just
north
of
that
is
the
Gateway
Hub
green
is
the
Gateway
Corridor
and
the
pink
is
the
Gateway
neighborhood.
Each
of
these
different
zoning
districts
has
differences
from
existing
zoning
and
each
of
them
has
differences
from
the
others
in
the
proposed
districts
relative
to
building
Heights
and
various
other
standards,
and
so
we
wanted
to
be
able
to
compare
these
using
our
GIS
data.
A
I
wanted
to
take
a
moment
and
zoom
in
you've
noticed
the
white
boxes,
those
white
boxes,
as
we
zoom
in
you,
can
see
our
existing
structures.
The
gis
data
was
able
to
bring
in
data
that
are
existing
to
draw
these
three-dimensional
figures,
and
so
you
can
see
that
we
have
them
scattered
throughout
various
neighborhoods,
both
within
and
outside
of
the
Gateway
area.
A
A
Now
I've
turned
on
what
we
refer
to
as
the
jewel
box
or
the
glass
box
model.
What
these
reflect
or
represent
are
the
existing
zoning
so
again
you're
seeing
those
purples
yellows
and
orange
colors
existing
zoning
setbacks
and
maximum
building
Heights,
and
so
you
can
see
these
class
boxes
to
find
those
parameters
based
on
current
zoning,
and
then
you
can
see
the
white
boxes
inside
of
those
the
existing
build
out.
A
The
reason
why
I
bring
this
to
your
attention
is
because
those
glass
boxes
have
limited
utility
in
describing
how
the
built
environment
will
look
in
the
future.
Now
we
did
the
same
thing
with
the
proposed
zoning.
We
have
proposed
zoning
with
these
different
Gateway
districts
and
we
were
able
to
develop
glass
box
model
for
the
maximum
extent.
Zoning
based
on
setbacks
and
maximum
height,
obviously
with
the
Gateway
The
Proposal,
was
to
allow
for
much
taller
buildings
in
the
Gateway
Hub,
the
sort
of
orangey
pink
color
there
near
Samoa.
A
This
shows
you
an
eight-story
maximum
Building
height,
the
blue,
I'm.
Sorry,
that's
the
barrel,
District,
the
blue
Hub,
just
north
of
that
you'll
see
a
seven
story
in
the
green
Corridor
six
and
the
pink
neighborhoods
are
five.
Now
these
were
the
designs
based
on
the
original
craft
proposal.
The
Planning
Commission
has
since
made
a
recommendation
to
reduce
those
building
elevations
by
one
floor,
but
this
gives
you
a
sense
of
a
maximum
Joule
box
build
out
potential
based
purely
on
the
setbacks
and
the
maximum
Building
height.
A
A
So
this
has
a
lot
of
utility
in
helping
us
to
understand
the
the
site's
impact
on
the
environment,
in
terms
of
the
way
that
the
gis
models,
those
impacts
on
the
environment,
but
it
doesn't
give
us
a
whole
lot
of
information
about
the
built
environment.
You
can
see
that
the
built
environment
existing
is
much
less
it's
more
reduced
than
the
existing
Zone
in
glass
boxes,
and
similarly
anything
that
was
built
out
using
the
proposed
zoning
would
come
in
at
drastically
reduced
volumes
than
you
see
in
those
glass
boxes.
A
A
Zooming
in
on
the
car
wash
parcel,
for
example,
you'll
note
that
the
maximum
development
potential
is
much
less
than
the
glass
box
again
and
with
this
particular
design,
we
were
able
to
take
the
form-based
code,
the
Gateway
area
code,
design
parameters,
the
setbacks,
the
articulation
in
the
building
and
the
step
backs
on
the
upper
floors
and
build
a
model.
Now
this
was
not
developed
by
an
architect.
This
was
developed
using
the
gis
software
and
it
was
used
or
was
developed
using.
A
You
know
the
modeling
capabilities
of
the
gis,
so
these
were
not
hand-drawn,
this
same
site
and
the
same
model
was
described
in
that
August
of
22
video
that
we
released,
and
we
use
this
to
show
how
setbacks
and
setbacks
the
building,
elevations
and
other
standards
could
be
conveyed
through
this
level
of
modeling.
But
it's
clear
that
this
does
not
give
you
a
real
true
sense
of
what
a
building
might
actually
look
like.
But
this
is
the
level
that
the
the
gis
software
is
capable
of
doing
this
one
is
very
refined.
A
We
also
have
several
models
that
were
built
to
help
us
do
the
the
environmental
analysis
that
are
a
lot
cruder.
This
more
gross
scale,
analysis
using
just
step
backs
and
setbacks,
for
example,
can
provide
the
gis
software
with
an
estimate
of
the
uses
and
the
inputs
and
outputs
that
will
come
from
those
uses
and
the
volumes
of
those
uses
without
giving
that
extra
refinement
that
you
saw
in
the
last
image
with
some
of
the
step
backs.
A
So
we
have
gross
scale
model
that
we've
been
developing
and
we
have
a
further
refined
scale
model
that
we
developed
with
GIS
platform.
But
neither
one
of
those
really
gives
you
a
true
sense
of
what
the
development
will
look
like
in
the
future.
But
it
does
give
us
a
very
good
resolution
on
some
of
these
environmental
impact
analytics
that
we're
developing.
A
We
also
had
another
model
of
500
units
that
had
slightly
more
dispersal
getting
some
development
into
the
gateway
neighborhood
as
well,
but
let's
stick
with
this
model
for
now,
because
we
actually
use
these
with
our
Architects
to
do
some
some
test
sites.
So
we
can
draw
these,
but
we
don't
know
how
feasible
they
are.
We
don't
know
how
they
would
actually
look.
We
don't
really
know
how
they
would
perform
based
on
these
GIS
models,
but
we
we
do
know
that
they
would
physically
fit
on
the
site.
A
We
worked
with
Urban
field
Studios
to
look
at
these
sites
and
run
some
test
scenarios.
Now
they
didn't
develop
3D
models.
They
didn't
draw
these
buildings
out
in
three
dimensions:
they
they
looked
at
them
in
two
dimensions
and
tried
to
develop
feasible,
working
models
to
test
the
Gateway
code
and
to
make
sure
that
it
was
feasible,
and
then
they
had
some
recommendations
for
us.
So
take
a
look
at
the
car
wash
parcel
to
start.
A
This
is
what
they
came
up
with
now.
You'll
note
some
significant
differences
here
in
urban
field,
Studios
design,
Jolly
giant
Creek,
is
not
daylighted
on
the
Northwestern
portion
of
the
the
site
they
felt
like
it
would
be
cost
prohibitive,
along
with
some
other
recommendations,
but
what
they
found
for
us
was
a
site
that
supported
87
dwelling
units
with
a
density
of
16
61
dwelling
units
per
acre.
They
show
some
retail
and
some
some
studios
and
mix
of
different
bedroom
types
here
now.
A
A
They
said:
hey
look.
These
sites
are
great
they're
within
quarter
mile
of
Arcata
Plaza,
an
existing
commercial
hub.
They
had
some
concerns
that
adding
new
retail
to
this
site
at
the
current
population
of
Arcata
would
not
necessarily
be
feasible,
so
not
requiring
retail,
which
our
code
currently
doesn't
is
their
recommendation.
A
They
offered
that
the
large
setbacks
that
were
in
the
draft
code
at
the
time,
as
well
as
the
step
backs
and
the
idea
to
Daylight
the
creek,
would
impact
the
efficiency
of
the
build
and
would
make
it
so
that
it
was
cost
prohibitive,
and
so
those
were
some
of
the
recommendations
they
made
on
this
site
based
in
part
on
some
of
the
recommendations
that
came
out
of
this
work,
the
Planning
Commission
ultimately
did
make
their
recommendation
to
reduce
those
setbacks
to
allow
for
larger
building
potential.
Let's
look
at
the
AmeriGas
site
on
this
site.
A
They
developed
a
similar
mixed-use
building
and
came
to
the
same
conclusions
that
the
mixed
use
is
really
a
challenge
for
this
site.
Structured
parking
they
felt
like
was
going
to
be
expensive
now
because
of
the
limitations
on
parking
that
we
have
for
the
Gateway
area.
Is
currently
proposed,
they
wouldn't
necessarily
need
to
provide
a
structured
parking.
They
would
be
able
to
do
surface
parking
and,
or
you
know,
no
parking
for
the
most
part.
A
A
Looking
at
the
site
adjacent
to
the
or
across
the
street,
from
the
creamery
building,
this
is
a
really
dense
site
in
the
gross
model
that
was
produced
through
the
gis,
you
can
see
a
much
smaller
project
was
developed
by
The
Architects.
Again
they
were
trying
to
get
some
retail
in
there
and
came
to
the
conclusion
that
retail
isn't
probably
going
to
work,
at
least
in
the
near
term,
with
current
population
densities
and
then
also
to
take
into
consideration
relocation.
A
Now,
I
want
to
pause
here
and
point
out
that
they've
got
a
parking
structure
on
the
south
part
of
this
parcel
right
now,
there's
a
community
garden
that
is
maintained
and
managed
by
Redwood
Coast
Montessori,
which
is
nearby
the
site.
This
is
not
a
regulatory
proposal.
This
is
not
even
a
proposal
for
this
site.
The
whole
purpose
of
these
images
was
to
test
the
code
and
see.
Could
you
build
a
building
on
the
site?
Would
it
be
feasible
and
what
recommendations
do
the
Architects
have
so
I?
A
A
You
know
not
require
retail,
and
luckily
that's
already
in
our
plan
we
wouldn't
require
the
retail
I
would
encourage
you
to
go
and
listen
to
the
architect's
full
presentation,
which
is
on
the
planning
commissions,
July,
11
2023,
recording
it's
a
great
place
for
you
to
go
and
hear
directly
from
the
architect
about
these
test
sites.
But
you
can
see
that
we've
walked
through
from
the
design
looking
at
glass
boxes
and
moving
that
into
GIS
designed
buildings.
A
Yeah,
so
I
want
to
pause
for
a
second,
because
that
was
the
analysis
that
was
done
more
recently,
moving
us
from
those
glass
boxes
models
and
then
up
to
architect's
interpretation
in
August
of
last
year.
In
that
video
that
I'd
mentioned
earlier
in
this
video,
we
took
a
look
at
this
site
and
again
we
took
the
design
that
was
based
on
the
gis
work
using
those
setbacks,
site-specific
standards,
massing
standards
and
we
asked
Julian
Burr
to
you
know,
show
us
a
design.
A
What
could
this
look
like
and
so
Julian
came
up
with
this
design,
which
does
incorporate
daylighting?
The
creek
does
have
a
five-story
mix,
four-story
development,
and
you
know
we
don't
have
Financial
feasibility
on
this
particular
design.
But
you
know
this
is
a
way
that
we
can.
You
know,
convey
how
the
form-based
code
could
be
interpreted.
You
know
by
an
architect-
and
these
are
the
types
of
developments
that
we
might
see
coming
out
of
this
form-based
code.
A
But
you
can
see
here
it
creates
a
lot
of
private
space
for
living
space.
There's
some
of
these
buildings
could
be
mixed
use
and
there's
also
a
large
public
space
surrounding
the
the
daylighted
creek
I
want
to
pause
there
and
transition
into
the
graphics
that
are
yet
to
come.
So
this
is
a
graphic
that
we've
produced
that
we'd
like
to
incorporate
into
our
planning
process.
A
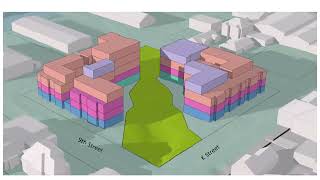
Here
are
some
examples
of
what
those
Graphics
might
look
like.
Now
you
have
everything
from
the
schematic
showing
the
block
layout
in
the
middle
to
the
design,
just
below
that
showing
some
front
yard
amenities
and
setbacks
all
the
way
to
something
that
has
a
little
bit
more
to
the
the
common
eye.
A
you
know
way
to
convey
what
these
future
builds
might
look
like.
Now,
none
of
these
Graphics
that
I'm,
showing
here
you
hear,
are
proposed
for
our
Gateway
plan.
These
are
not
out
of
the
plan
they're
not
based
on
the
plan.
A
That
I
showed
you
before
with
the
white
buildings
that
are
existing
buildings
and
then
in
these
examples
the
buildings
that
are
colored
are
either
future
proposed
buildings
or
potential
buildings
based
on
the
design
that
were
outlined
in
these
particular
codes,
and
so
we'll
have
something
similar
in
our
code,
where
you'll
be
able
to
see
the
the
massing
for
these
future
builds
based
on
again,
it's
going
to
be
a
gross
design.
You're
not
going
to
have.
A
You
know
all
of
the
architectural
detail
that
you
saw
in
Julian's
drawings,
but
you
will
have
a
sense
for
how
build
out
the
community
could
be
based
on
those
parameters
that
we
have
in
the
code.
I
hope
this
has
helped
Advance
the
conversation
about
what
we
anticipate
seeing
in
our
form-based
code
and
I
hope.