►
Description
Helm charts have been the most popular way of deployment in the Kubernetes ecosystem. Although the Helm CLI is powerful and robust, it becomes challenging when it comes to debugging your microservices deployed with Helm. This talk addresses the challenges faced by the Helm users when deploying, updating and debugging their microservices in a Kubernetes cluster.
A
You
all
in
the
afternoon
session
of
kcb
Chennai
2022
day
two
in
this
talk
we
will
be
talking
about.
Are
you
helping
it
the
right
way?
You
click
and
correction
about
myself?
This
is
prakash,
my
Solutions
architect
active
front
with
more
than
11
years
self
industry
experience
also
an
active
contributor
and
maintainer
of
the
open
source
devtron
project
on
GitHub.
You
can
connect
with
me
on
the
Fallen
social
media
links
on
Twitter,
GitHub
and
Linkedin
coming
to
the
agent
of
today's
talk.
A
Obviously
I'll
be
talking
about
what
is
hell
and
some
challenges
faced
by
end
users,
then
I'll
be
introducing
you
to
devtron
and
how
devtron
helps
you
to
overcome
those
challenges
faced
by
hand,
users
next
I'll
also
be
talking
about
some
other
electron
Integrations,
which
will
be
followed
by
q,
a
moving
on
to
the
next
slide.
What
is
film,
people
in
the
kubernetes
ecosystem
might
always
already
be
aware
of
this
term,
and
they
might
have
already
used
to
help,
but
people
who
are
new
to
the
latest
info
system.
A
Hell
is
the
most
popular
package
manager
for
kubernetes,
just
like
you
have
for
Python
and
npm,
and
then
we
have
the
home
view
for
a
map.
Similarly,
we
have
package
manager
for
kubernetes,
which
is
called
Helm,
and
this
is
the
most
widely
used
package
manager
across
so
kubernetes
ecosystem
Helm
chart
is
basically
a
collection
of
templates
which
rendered
some
values
and
it
generates
kubernetes
to
manifest
so
that
gets
applied
to
the
cluster.
You
can
package,
configure,
distribute
and
deploy
applications
using.
A
It
is
the
most
popular
distribution
of
channel
for
open
source
application
that
can
be
deployed
on
kubernetes
cluster
and
child
repositories
is
where
we
post
the
hand
chart.
So
there
are
different
Charter
School
victories,
which
are
maintained
by
different
maintainers
now,
so
you
can
just
add
those
victories
while
music
when
you're
using
the
helm
and
you
can
use
the
already
existing
charts
over
there
and
you
can
also
create
your
own
custom
charts
if
you
want
and
deploy
your
own
custom
applications
on
the
left.
A
We
have
very
simplistic
code
representation
of
how
exactly
you
can
work
that
works.
So
we
have
templates,
and
then
we
have
some
values.
So
the
values
are
the
helm.
Engine
is
a
completing
engine
which
renders
these
values
through
these
templates
and
generates.
So
the
kubernetes
manifests
which
get
applied
to
the
kubernetes
cluster.
A
Next,
we'll
be
talking
about
challenges
faced
by
Helm
users,
so
I'll
be
discussing
each
of
these
challenges,
one
by
one
in
the
following
slides
and
will
also
be
discussing
how
devron
helps
you
resolve
those
challenges.
Let's
introduce
you
to
their
front.
Electron
is
an
open
source
tool,
integration
platform
that
integrates
with
multiple
Cloud
native
tools.
To
give
you
a
unified
dashboard
for
a
seamless
experience
you
can
deploy,
observe
and
monitor
all
the
kubernetes
micro
Services
deployed
in
multiple
kubernetes
clusters
across
multiple
Cloud
providers
or
even
on-premise.
A
Let
me
give
you
a
quick
demo
of
how
you
can
easily
deploy
any
health
chart
using
a
defron
on
the
left
pane.
You
can
go
to
the
Chart
store,
you'll
find
where
it
starts
listed
in
this
chart
store.
You
can
also
add
your
own
chart
Repose,
and
it
will
list
all
your
charts
and
show
it
over
here.
So
let
me
just
pick
one
chart
I'll
deploy
a
bit
Nomine
Apache,
so
on
this
page
it
shows
all
the
information
about
the
jar.
A
If
there
is
any
existing
deployments
for
that
particular
chart,
it
also
shows
up
over
here.
You
can
select
chart
version,
I
want
to
deploy
on
the
chart,
values
and
then
click
on
deploy
I'll,
give
it
a
name,
demo4,
Apache
and
select
the
environment
where
I
want
to
deploy.
So
I
want
to
deploy
this
in
depth
on
demo.
Namespace
I
want
to
save
in
some
values.
I
don't
want
to
provision
a
load
balancer,
so
I
will
just
will
be
changing
the
service
type.
A
2,
plus,
writing
and
I
can
refer
the
review
from
the
left
if
I
want
to
whatever
for
this
demo,
I
don't
require
I'll,
just
close
this
down
and
click
on,
deploy
and
voida.
That's
how
you
deploy
a
Helm
chart
using
defron,
so
there
has
been
deployed,
as
you
can
see,
that
it's
creating
the
resources,
it
is
creating
deployment
object
and
then
it
is
creating
a
port.
So
let
me
check
the
events
of
the
board.
A
Coming
to
the
first
and
foremost,
challenge
that
is
faced
by
most
of
the
users,
which
are
migrating,
connectors
or
adopting
kubernetes
is
access
management
for
various
team
members
and
when
I
talk
about
the
way
this
team
members,
it
includes
infra,
devops
and
as
well
as
developers.
So
Gone
are
the
days
when
a
developers
used
to
just
test
out
their
code
in
local
environment
and
commit
it
to
the
GitHub
repository
they
want
to
do
more.
Now
they
want
to
follow
the
deployment
process.
A
They
want
to
see
what
is
happening
after
the
release
has
happened.
They
want
to
actively
monitor
the
application,
monitor
various
move
rates
of
the
application,
so
it
becomes
crucial
for
them
to
have
access
of
the
application
that
they
are
only
so
I'll
quickly.
Give
you
a
demo
of
how
you
can
manage
access
or
and
provide
access
to
all
the
team
members
using
their
current
UI.
A
So
I'll
just
show
you
how
you
can
create
a
group
and
how
you
can
manage
the
excesses,
so
I'm
I'm
going
to
create
a
group
for
which
will
give
you
give,
which
will
give
users
access
to
a
certain
namespace,
which
is
the
QA
name
space
and
the
and
the
users
will
have
the
only
access
to
this
particular
namespace
applications.
So
for
that
I'll
have
to
project
is
something
that
will
only
come
into
picture
if
you
are
deploying
the
applications
using
devtron.
A
If
you
are
not
deploying
the
application
using
defron,
it
always
lies
under
an
assigned
project
category,
so
I
can
select
the
environment
and
namespace
that
I
want
to
give
access.
So
environment
here
is
a
combination
of
cluster
and
the
namespace,
so
it
shows
the
cluster
name,
which
is
which
in
this
case
is
the
default
cluster
right
now
and
deftron
I.
Think
demo
is
the
environment
thing,
so
I
want
to
give
access
to
this
particular
environment.
A
I
can
select
multiple
name
spaces
as
well,
and
I
can
also
select
multiple
name
spaces
across
various
environments.
So,
if
I
want
to
give
access
to
the
user
for
two
clusters,
I
can
also
do
that
within
the
Cisco
right
now.
I
am
just
giving
access
to
one
in
namespace
and
then
I'll
have
option
to
select
a
application
deployed
application
so
if
I
want
to
give
access
to
entire
namespace,
I
can
also
do
that
if
I
want
to
give
access
to
only
certain
applications
which
are
deployed
in
that
particular
names.
A
First
I
can
also
do
that
in
this
case.
There's
no
application
deployed.
Yet
so
it's
not
showing
me
a
popularity
in
this
particular
case,
so
I'll
just
select
all
applications
in
this
particular
namespace
and
then
I'll
proceed
to
the
permission.
Level.
Keptron
currently
supports
three
permissions
level
for
the
helm,
charts,
which
are
view
only
View
and
edit
and
admin.
A
So
we
only
with
very
only
permissions
user
will
be
only
to
the
user
will
be
able
to
view
all
the
resources
at
the
Helm
chart
has
deployed
and
he
will
be
able
to
check
the
logs
of
the
application
check.
The
metrics
of
the
application,
the
user
with
View
and
edit
access
will
be
able
to
in
addition
to
what
new
user,
what
remove
access
users
can?
He
will
be
able
to
edit
the
resources
of
the
given
address
manifest
and
apply
it
to
the
back
to
the
cluster
as
well.
A
Users
with
admin
access
will
be
able
to
deploy
edit
and
view
all
these
resources
of
that
particular
within
the
scope
of
their
application
or
the
environment.
So
once
you
have
defined
the
excesses,
you
can
just
save
this
group
and
then
you
can
go
ahead
and
assign
it
to
any
user.
So
if
I'm,
if
I
want
to
assign
it
to
my
user,
so
I
can
just
select
it
from
this
drop
down.
A
So
right
now
we
have
only
this
group,
so
I
have
already
selected
that
and
once
I've
selected
it
I
can
just
hit
on
Save,
and
it
gives
me
permissions
all
those
permissions
so
which
are
which
you
gave,
and
this
particular
to
this
particular
group.
Similarly,
you
can
also
give
a
group
permissions
paired
with
the
individual
permissions
as
well.
So
if
I
have
to
give
one
permission
to
this
particular
user,
let's
say
a
different
CD
in
in
space
and
all
applications
I
should
be
able
to
admin.
A
A
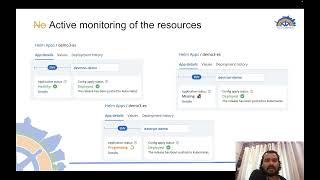
So
the
next
challenge
that
help
users
generally
face
is
that
there
is
no
active
monitoring
of
the
resources
when
I
say,
there's
no
active
monitoring,
which
means
that
after
the
release
has
happened,
if
some,
if
somebody
by
chance
has
deleted
any
of
the
resources
or
by
any
chance,
there
is
a
port
that
gets
into
crash
to
back
off.
So
tell
them
has
no
way
of
monitoring
that
I'll
quickly
switch
to
the
demo
and
show
you
how
the
phone
helps
you
actively
monitor
the
resources
even
after
the
deployment
happens.
A
Okay,
I'm
back
on
the
depth
on
UI
for
a
quick
demo,
so
just
select
one
of
the
applications,
so
this
is
one
of
the
M
chart
so
which
has
been
deployed.
So
this
is
using
Navi
elasticsearch
help
chart
to
deploy
our
elasticsearch
stack
into
a
kubernetes
cluster.
So
right
now,
if
you
can
see
the
application
status
of
this
chart
shows
as
LD
okay.
So,
let's
see
what
happens
when
I
delete
the
spot,
the
kibana
port,
okay.
A
So
as
soon
as
I
delete
this
pod,
there
is
a
new
pure
Port
that
gets
created
because,
of
course
it
is
controlled
by
the
deployment
controller.
So
but
the
status
of
the
application
changes
to
progressing
right
and
when
I
click
on
the
details,
it
shows
me
what
resources
exactly
are
in
progressing
the
state.
So
if
I
can
see
here,
it's
the
deployment
which
controls
the
replica
set
and
that
controls
the
ball,
which
the
three
are
in
progressing
state
right
now.
Okay,
so
let's
wait
for
this
to
get
into
the
healthy
side.
A
A
It
is
not
controlled
by
any
controller,
so
it
will
not
get
replaced
with
a
new
one.
So
as
soon
as
I
delete
the
Ingress
object,
it
shows
it
starts
showing
as
missing
and
the
entire
application
will
start
as
well
so
shows
missing
and
when
I
click
on
the
details,
it
shows
me
exactly
what
resource
is
missing,
which
is
the
Ingress
okay.
So
this
is
exactly
how
electron
actively
monitors
all
the
resources
of
your
home
deployment,
the
next
Challenge
Fails
by
Henry.
A
This
is
that
there
is
no
proper
grouping
of
resources
which
are
deployed
by
any
hearing
chart.
The
helm
chart
can
can
create
multiple
resources
range
between
10
to
50
or
even
hundreds
of
resources
for
some
big
Helm
charts.
So
when
it
comes
to
debugging
something
some
issues
that
you
have
with
any
of
the
deployments,
so
it
becomes
so
very
difficult
to
sort
of
deliver
things
so
because
of
no
proper
grouping
or
for
resources.
A
So
I'll
quickly
give
you
a
demo
of
how
the
front
consumed
here
all
right,
I'm
back
on
the
different
UI.
So
this
chart,
which
has
been
deployed
using
film
I,
can
see
that
it
has
created.
38
all
odd
resources
so
and
I
can
see
that
you
see
all
those
resources
grouped
under
this.
These
categories
over
here
so
under
workloads,
I,
have
for
various
boards
which
are
created
using
deployments.
I
have
state
full
sets
as
well,
then
I
can
see.
There
are
endpoints
English
service.
A
So
this
is
how
devtron
shows
you
all
the
resources
that
this
particular
chart
has
created
categorized
in
this
particular
format,
and
it's
very
easy
when
it
comes
to
debugging,
because
you
can.
There
are
any
events,
you
can
check
the
events,
so
you
can
see
the
events.
I
can
even
see
the
logs
or
or
any
of
the
container
of
this
part
I
can
do
a
quick
grip,
so
I
can
even
exit
inside
the
container
using
the
same
UI.
So
I
am
inside
the
container
in
the
kibana
part.
I
can
do
my
debugging
activities
over
here.
A
So
that's
all
you
can
do
log
analyzer
helps
you
see,
logs
of
various
resources
of
your
chart
deployment.
That's
also
an
added
benefit
to
a
different
that
you
can
see
in
analyze,
logs
of
various
resources
right
from
the
UI.
So
let's
suppose
that
we
have
a
demon
set
that
has
50
pods
running,
so
you
don't
have
to
go
for
two
inch
pod
and
check
the
logs.
You
can
check
the
logs
of
all
the
ports
using
log
analyzer.
A
Moving
on
to
the
next
problem.
Please
fight
our
health
users
is
when
they
are
trying
to
deploy
a
Helm
chart
which
has
a
lot
of
information
in
the
values.
Why
and
a
lot
of
parameters
that
can
be
configured
so
generally?
What
help
users
do
is
they
have
the
values
file
open
in
their
web
editor,
and
then
they
are
referring
to
various
parameters
on
the
readme
of
that
particular
charts
repository
and
from
there.
A
They
are
referring
this
parameter
and
then
they
are
at
making
changes
inside
editor
and
then
they
go
ahead
and
deploy
it.
But
devtron
gives
you
a
better
way
to
do
that.
Let's
see
how
you
can
do
that
in
different.
Okay,
I
am
back
on
the
different
UI
again,
so
let's
go
to
the
values.
So
if
I
have
to
configure
some
values
so
in
the
second
chart,
I'll
just
click
the
readme
on
the
left
side,
and
it
opens
side
by
side.
Read
me
for
me
so
I.
A
If
I
have
to
change
some
parameters
over
here
on
the
right,
pane,
I'll
refer
to
the
parameters
and
I'll
see
go
to
the
description.
What
it
does
and
I'll
make
the
changes
accordingly
in
the
right
lane
and
go
ahead
and
deploy
this
application
with
the
changes.
So
that's
very,
very
handy
when
it
comes
to
editing
long
value
files,
so
like
Engineers
controller
or
maybe
elasticsearch
itself
has
a
long
values
file.
A
Next
to
a
problem,
we
have
there's
no
unique
profile
interface
for
managing
applications
across
all
your
clusters,
so
you
might
have
multiple
clusters,
some
non-pro
and
some
may
be
prod,
but
there's
no
unified
interface,
where
you
can
from
where
you
can
control
all
the
deployments
or
monitor
all
the
resources
from
so
different
gives
you
a
way
to
do
that
so
I'll
go
to
the
global
configurations
and
under
clusters.
I
can
see
that
I
have
two
clusters
listed
over
here.
A
You
can
add
multiple
kubernetes
clusters,
so
it
doesn't
matter
what
version
they
are
or
on
what
cloud
they
are.
It
can
be
on
gcp,
Azure
or
even
on
on
premise.
Cluster
can
be
added
to
this
different
instance,
and,
once
you
add
the
Clusters
to
your
devtron,
you
should
be
able
to
see
all
the
help
applications
which
are
deployed
in
now
those
particular
clusters
in
all
the
namespaces
they
can.
A
You
can
select
the
Clusters
from
the
drop
down
here
and
it
displays
all
the
helm
applications
which
are
present
in
those
two
clusters
that
I
have
selected,
and
this
is
all
with
the
rbat
policies
in
place.
So
if
the
user
has
access
to
only
one
cluster,
he
will
be
able
to
see
applications
which
are
deployed
in
that
particular
cluster
or
in
a
particular
name
space.
A
If
he
has
access
to
that
particular
space
in
the
out-of-box
support
for
hibernation
of
workloads,
so
yeah,
but
tell
me
you
can
either
have
it
installed
on
your
kubernetes
cluster
or
you
can
just
unstort,
which
will
remove
all
the
kubernetes
objects
that
it
has
created,
including
all
the
workloads.
But
you
may
be
in
a
situation
that
you
are
doing
a
long
term
POC
and
for
which
you
require
some
Helm
charts
to
be
deployed.
A
They
may
be
resource
intensive
as
well
so
and
then
you
might
want
to
pause
those
pocs
for
a
while
to
switch
on
some
more
priority
tasks.
So,
in
those
cases,
what
normally
you
will
do
is
you'll
actually
remove
those
resources
and
free
up
your
kubernetes
cluster,
but
deftron
gives
you
a
better
way
to
attach
that
problem
with
deftron.
You
have
an
option
to
scale
down
your
workloads
if
they
are
not
required,
so
as
soon
as
I
click
on
scale
workloads.
A
It
shows
these
workloads
that
this
particular
Helm
chart
has
created,
so
I
can
selectively
select
all
the
resources
that
I
want
to
scale
down.
So
I
see
that
these
are
the
most
crystals
and
dental
workload.
I
want
to
scale
down
so
I'll
just
select
it
I'll
leave
kibana,
not
that
resource
intensive
and
I'll
scale,
all
the
workloads
to
zero.
A
A
If
I
see,
there's
only
one
chord
now,
which
is
the
kibana
board,
and
all
the
other
boards
have
been
scaled
down.
If
I
want
to
scale
it
up,
anytime,
I
can
go
to
the
scale
down
scale
down
workload,
so
I
can
select
the
objects
that
I
want
to
scale
workloads
that
I
want
to
scale
up.
I
can
click
on
restore
workloads
and
it
will
bring
up
those
workloads
again.
A
Okay,
Helm
doesn't
gives
you
any
intuitive
way
to
compare
the
values
file
that
you
have
for
previously
deployed.
So
you
can
of
course,
do
this
with
some
happy
ways.
You
can
get
the
values
from
and
get
values
and
then
and
use
them.
They
have
to
compare
those
values
against
the
changes
done,
but
devtron
gives
you
a
more
intuitive
way
of
doing
that.
It
highlights
all
the
changes
that
were
done
and
you
can
select
the
date
and
time
of
the
deployment
that
happened
in
the
past
and
you
can
compare
them.
A
The
changes
against
the
currently
deployed
changes
in
a
side-by-side
comparison.
Okay,
so
let's
talk
about
some
more
different
features
and
integration.
So,
apart
from
the
helm
that
we
just
saw
so
I
would
show
you
a
quick
demo,
because
we
have
less
time
their
front
application.
So
if
you
can
see
it's,
the
UI
is
very
much
pretty
much.
A
The
same
as
it
was
there
in
a
case
of
the
helm
applications,
it's
just
that
you
see
these
40
metrics
over
here,
which
shows
you
CPU
usage
memory
usage,
throughput
of
the
application,
the
latency
of
the
application.
You
can
also
select
to
show
these
nutrients
on
board
basis
as
well,
since
this
has
two
ports.
So
now
it
shows
you
The
Matrix
on
board
basis.
A
It
also
shows
if
there
are
any
critical,
World
liabilities
and
the
image
which
is
deployed.
So
it
shows
two
moderate
vulnerabilities
and
five
low
vulnerabilities,
which
this
image
has
nothing
critical
as
such,
and
then
this
different
integration
also
comes
with
SSO
login,
so
you
can
directly
create
users
and
let
them
log
in
through
their
organization,
so
provided
by
Gmail
or
Microsoft,
or
you
can
even
configure
GitHub.
So
here
some
information
that
I
would
like
to
share
about
the
different
project.
A
You
can
pop
out
this
repository
and
also
contribute
back
to
the
additional
project.
Deftron
is
like
licensed
under
Apache
2.0,
which
is
the
most
liberal
license
in
the
open
source.
So
you
can
go
on
this
link
and
join
our
Discord
server.
You
can
even
check
out
the
documentation
and
you
can
see
how
you
can
install
your
own
different
cluster,
either
on
a
local
kubernetes
cluster
or
on
a
production
grade
kubernetes
cluster.
A
There
are
many
organizations
which
use
different
for
deployments
in
the
production
environment,
so
more
than
thousands
of
microservices
are
being
deployed
using
devtron
on
daily
basis.
These
are
some
prominent
organizations
which
are
using
different
as
an
Enterprise
customers
and
there
there
are
tons
of
other
open
source
users
which
are
using
devtron
for
non-prod
or
production
use
cases.
Okay.
So
the
session
is
open
for
any
question
and
answers.