►
From YouTube: Kubernetes performance analysis
Description
No description was provided for this meeting.
If this is YOUR meeting, an easy way to fix this is to add a description to your video, wherever mtngs.io found it (probably YouTube).
A
A
A
A
A
A
A
A
We
divided
the
test
in
two
parts.
First
is
workload:
some
typical
workloads
are
listed
here,
such
as
web
server,
midi
file
database,
we
choose
interacts
and
redis
and
the
workload
the
bottleneck
of
a
database
is
usually
io,
so
we
didn't
test
any
database
a
lot
of
tools
available
here
we
use
systems
to
test
cpu
and
memory.
A
A
A
A
A
First
of
all,
we
test
the
cpu
and
memory
by
6
bench.
6
bench
on
the
left
is
a
cpu
performance,
single
core
and
multicore
system
to
calculate
the
prime
number
using
given
threads.
The
result
is
the
event
per
second,
we
test
two
situation
of
one
thread
and
all
64
threads
on
the
right
is
memory.
Copyright,
the
memory
block
size
is
8
kilobits
and
the
total
size
is
64
gigabytes.
A
A
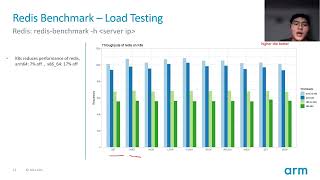
Then
the
line
is
falling,
which
means
that
instance
spend
too
much
cpu
time
to
do
price
to
two
process
switch
or
interrupt
or
other
traffic
scene
from
the
graph.
It's
easy
to
see
that
first
kubernetes
will
decrease
throughput.
Second,
the
arms
show
higher
performance
with
a
faster
cpu
loss
in
high
concurrency
scenarios.
The
x86
incident
perform.
A
A
A
A
B
Hello,
everybody.
This
is
dave
chen
from
I'm
an
image.
Today,
I'm
going
to
introduce
a
couple
of
tools
used
for
scalability
testing
in
kubernetes,
so
the
first
one
is
the
class
loader
and
the
other
one
is
kobe
mark.
What's
the
class
loader
class
loader
is
the
official
kubernetes,
scalability
and
performance
testing
framework?
B
B
It
simulates
a
node
by
creating
a
part,
well
coordinate
and
copy
proxy
services
are
run
inside
of
the
port.
In
this
way,
you
can
simulate
a
cluster
with
thousands
of
nodes
by
creating
thousand
ports.
Instead,
the
primary
use
case
of
the
copy
mark
is
scalability
testing,
as
the
simulated
cluster
can
be
much
bigger
than
the
real
one.
The
purpose
is
to
expose
problems
of
the
controller
plane
component
for
api
server
on
big
cluster
in
our
experiment.
B
Kubernetes
has
documented
the
ports
and
the
protocols
used
by
the
kubernetes
component.
You
should
be
aware
that
class
node
will
access
to
those
parts
to
collect
the
matches
matrix
or
profanity
data,
so
you
need
to
open
this
part.
Accordingly,
you
might
need
to
manually
enable
the
profiling
for
the
components
like
or
control
manager,
as
it
is
possible
that
provider
is
not
enabled
by
default.
B
B
B
B
B
B
Parts
will
be
scheduled
to
each
each
node.
The
results
that
decreased
is
only
department
and
then
do
the
profiling
against
the
cpu
memory.
For
each
of
the
kubernetes
components,
scheduling
metrics
can
actually
collect
the
metrics
for
different
schedule.
Plugin,
we
can
see
that
the
bind
is
possible
bottleneck
on
both
platform.
B
B
B
B
B
B
B
We
have,
we
only
have
30
000
parts
going
to
be
scheduled
and
the
copy
scheduler
has
a
plugin
which
is
named
as
topology
spread,
which
we
are
trying
to
spread
the
port
evenly
in
the
cluster
and
the
onenote
is
able
to
draw
with
110
parts
by
default.
So
the
logic
of
the
preemption
in
scheduler
should
not
happen
in
the
test
at
all.
B
Based
on
this
assumption,
something
change
in
this
code
base
might
bring
down
the
influence
of
the
topology
and
spread
plugin,
and
eventually
we
found
this
is
a
regression
issue.
The
reason
is
that,
in
this
specific
case,
if
there
are
a
lot
of
ports
with
no
requests
of
the
cpu
or
memory,
the
change
in
source
makes
the
specific
plugin,
which
is
named
as
a
banner's
resource
allocation,
has
higher
impact
on
the
finance
score.