►
From YouTube: Data Swirling to the Rescue for True Observability
Description
No description was provided for this meeting.
If this is YOUR meeting, an easy way to fix this is to add a description to your video, wherever mtngs.io found it (probably YouTube).
A
A
Finally,
we
will
demonstrate
an
example
of
data
swirling
in
action,
although
this
is
pre-recorded,
our
team
is
available
in
the
chat
right
now.
Please
submit
your
questions
in
the
chat
window
and
we
will
address
these
throughout
the
webinar
first.
Let
me
briefly
introduce
cecilio.
So
sibio
is
a
predictive
troubleshooting
tool
for
kubernetes
applications
and
environments.
A
We
have
domain
experts
both
in
ai
and
kubernetes,
with
several
decades
of
experience
in
their
respective
fields.
We
are
a
globally
remote
company
with
our
headquarters
in
san
francisco
and
our
r
d
team
in
tel
aviv.
So
sibio
is
not
just
another
monitoring
tool.
Cesivio
provides
you
with
answers
and
insights,
and
not
just
raw
data.
A
A
At
a
high
level,
cesivio
uses
data
scrolling
to
first
collect
data
from
the
entire
stack.
It
then
compresses
and
translates
everything
to
unified
cesivial
language.
It
then
goes
on
to
correlate
the
data
to
form
a
clear
picture
of
what
is
happening
inside
your
cluster.
It
then
automatically
detects
issues
and
it
does
all
this
in
real
time.
Data
swirling
also
allows
us
to
provide
fully
automated
application
resource
profiling,
allowing
you
to
properly
allocate
resources
for
cloud
native
applications.
A
This
fully
optimizes
performance
and
cost
savings
for
your
entire
kubernetes
environment,
troubleshooting
and
optimizing
kubernetes
applications
with
today's
observability
tools
usually
looks
something
like
this
first
collect
and
store
large
amounts
of
metrics
logs
and
traces
second
find
an
expert
third.
Have
the
expert
sift
through
all
the
information
to
analyze
for
root,
cause
analysis
of
an
issue
or
determine
optimizations
for
your
applications.
A
Kubernetes
and
its
underlying
layers
produce
a
mass
amount
of
raw
data
and
logs
sifting
through
the
pure
volume
of
information,
even
with
the
help
of
today's
observability
tools
is
still
like
finding
a
needle
in
a
haystack.
Also,
raw
data
is
not
enough,
because
we
want
to
know
things
like
what
is
actually
causing
those
cpu
spikes
and
are
they
even
normal?
A
Kubernetes
failures
are
usually
chains
of
events.
One
failure
leads
to
another
into
another
into
another,
all
in
the
layers
beneath
the
kubernetes
control
plane
on
top
of
sifting
through
mass
amounts
of
data.
You
have
to
also
correlate
the
right
data
to
even
find
a
potential
root
cause
of
an
issue
trying
to
piece
together
a
puzzle
on
top
of
sifting
through
all
that
data
increases
the
complexity
of
troubleshooting
kubernetes
issues.
A
A
A
A
Both
were
designed
to
capture
either
metrics
or
logs
and
do
a
decent
job
of
it,
but
unfortunately
they
have
limitations
in
trade-offs,
which
makes
real-time
analysis
on
large
amounts
of
data
very
difficult
when
using
prometheus
out
of
the
box,
you're
getting
computed
averages,
which
leads
to
inaccurate
and
non-usable
data.
Prometheus
was
designed
for
reliability
and,
as
a
trade-off,
loses
some
accuracy
of
the
data.
A
A
A
One
way
to
break
this
legacy
approach
is
with
a
new
novel
methodology.
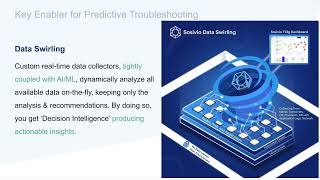
Data
swirling
data
swirling
is
our
novel
approach
in
which
we
use
custom
data
collectors,
along
with
lean
artificial
intelligence
and
machine
learning
to
collect
and
analyze
data
on
the
fly
by
having
data
that
is
analyzed
in
real
time.
We
can
provide
actionable
insights
and
be
predictive
about
events
in
your
kubernetes
cluster
data.
Swirling
starts
with
collecting
good
quality
data.
A
A
A
Data
swirling
also
fuels
cesivio's
application,
profiling
capabilities,
ensuring
that
applications
are
being
profiled
with
very
accurate.
Real-Time
data
data
swirling
is
the
enabler
for
predictive
troubleshooting
capabilities
by
having
the
ability
to
see
and
understand
what
is
happening
inside
your
cluster
in
real
time,
cecilia
is
able
to
detect
signals
on
chains
of
events
as
they
are
happening.
A
A
A
Each
strand
or
singular
event
of
a
kubernetes
sequence
is
filled
out
and
cecilia's
prediction
engine
detects
what
is
going
to
happen
in
the
failure
sequence
by
knowing
what
failure
is
going
to
occur.
We
know
what
will
happen
the
root
cause
of
the
issue
and
how
to
fix
it
again.
This
all
starts
with
data
collection.
A
A
B
B
B
I
go
to
the
home
page
to
try
to
find
the
cart
and
am
even
more
disappointed
to
see
that
the
cart
has
emptied
if
you
notice
on
the
right
side
of
the
screen
on
the
selcivio
dashboard.
Just
as
the
cart
crashed,
so
sivio
detected
a
failure,
it
looks
like
an
application
was
abnormally
terminated
when
we
expand
to
learn
more,
we
can
see
that
the
cart
pod
was
om,
killed,
leading
to
the
crash
of
the
cart
and
losing
all
of
the
data
in
that
pod
without
cecilia.
B
This
would
be
incredibly
difficult
to
find
most
observability
tools
wouldn't
pick
up
on
the
momentary
spike
in
memory
which
led
to
the
crash
with
socio.
You
immediately
are
notified
of
these
issues
even
before
a
customer.
Complaints
with
one
click
socio
resolves
the
issue
and
ensures
that
other
customers
won't
suffer
the
same
bad
experience
going
back
to
the
soccivio
site.
We
can
see
that
the
cart
is
now
working
properly.