►
Description
No description was provided for this meeting.
If this is YOUR meeting, an easy way to fix this is to add a description to your video, wherever mtngs.io found it (probably YouTube).
A
A
So
every
week
we
bring
a
new
presenter
to
Showcase
how
to
work
with
Cloud
native
Technologies,
we'll
build
things
we'll
break
things
and
we'll
answer
your
questions.
So
this
week
we
have
Victor
gamoth
here
with
us
to
deliver
a
presentation:
titled
streamline
service,
mesh
observability
with
Kuma
and
open
telemetry.
B
A
Yeah
and
I'm,
not
even
done
oh
yeah
I
have
some
more
to
say.
I
have
to
do
this
disclaimer,
which
is
just
remind
everyone.
This
is
an
official
live
stream
of
the
cncf
and,
as
such,
it's
subject
to
the
cncf
code
of
conduct.
So
please
don't
add
anything
to
the
chat
that
would
be
in
violation
of
that
code
of
conduct,
which
basically
means
please
be
respectful
of
each
other,
be
respectful
of
Victor,
be
respectful
to
me
and
we'll
do
the
same
for
you.
So
friends
who
are
joining
us
live.
A
A
B
A
B
And
the
second
thing
is
that
I'm
a
long
time
listener
first
time
caller,
basically
because
we
did
few
of
those
in
the
past,
but
it
was
not
the
live
thing.
So
we
we
kind
of
like
hand
over
the
recording
and
the
cncf
was
kind
of
like
a
planar
playing
the
the
video.
But
it's
great
to
have
a
live
conversation.
I
was
wondering
if
we
can
test
the
chat
in
the
folks
is
watching
us
live
like
write
down
where
we're
coming
from
like
yeah.
A
B
B
A
Hot
outside
yeah
unbearable,
we
have
gaurav,
saying
hello
in
the
chat
which
I
love,
I
Marvel,
all
the
time
about
I'm
in
my
40s,
so
I
remember
when
there
was
no
internet
at
all,
so
I
Marvel
all
the
time
that
we
can
be
having
like
a
real-time
conversation
from
people
across
the
world,
I
think
it's
just
the
coolest
thing:
I'll
never
get
tired
of
it.
Yeah.
A
B
We
can
point
out
earlier
and
we're
going
to
talk
about
service
match.
Observability
we're
gonna
I'm
gonna
talk
a
little
bit
about
different
cncf
related
projects,
so
I'm
gonna
talk
a
little
bit
about
Kuma,
which
is
the
cncf
incubating
project
I,
think
it's
not
incubating
it's
a
steel,
sandbox
and
also
obviously
open
cellometry
is
also
cncf
project.
Many
other
projects,
you
know,
include
integration.
B
This
is
the
talk
where
I
would
like
to
spend
a
little
bit
time
of
like
slides
and
talking
so
don't
hesitate,
interrupt
and
ask
questions
for
me
as
a
I
work
as
a
developer
Advocate
at
conk
and
for
me
talking
to
developers
and
make
sure
that
I'm
unblocking
any
like
things
that
stand
on
their
ways
to
build.
Awesome
apps
in
a
cloud-net
way
is
the
kind
of
like
a
my
my
my
goals
and
that's
going
to
be
my
achievement.
B
So
Richmond
Virginia,
very
nice,
amitesh,
welcome
Kumar,
says
hi
from
LinkedIn
great,
so
feel
free
to
to
drop
your
questions
and
Whitney.
If
you
also
see
some
interesting
things,
you
don't
hesitate
to
interrupt,
or
maybe
you
know
if
you
want
to
ask
some
question
yourself,
I
like
to
have
these
conversations
as
much
much
better
to
do
this,
like
alone.
A
B
That's
a
very,
very
good
question:
we're
going
to
talk
about
this,
so
stick
around
for
I
love
the
audience
that
go
like
a
straight
shooter,
so
they
go
directly
into
the
business
like
what
anyways
so
essentially
the
observability
we're
going
to
talk
about
observability
and
the
the
most
most
important
question:
how
the
people
trying
to
figure
out
hey
like
why
it
was
just
slow.
Why
X
is
slow.
B
I
put
the
kuma,
because
people
will
ask
questions
about
Kuma
or
if
I'm
talking
about
some
corn
or
you
can
talk
about
some
other
Technologies
people
tend
to
love
two
things
why
things
are
slow
and
why
it's
so
expensive.
So
so
that's.
Why
kind
of
like
when
you
bring
in
conversation
and
give
examples
from
from
those
like
categories,
people
kind
of
like
react,
the
best
right.
B
So
when
you
say
something,
oh,
let
me
give
you
example
with
the
credit
card
or
financial
Financial
stuff
people
kind
of
pay
attention
or
why
things
are
slow
and
we're
going
to
be
trying
to
not
to
be
Charlotte
day's
character
for
all.
It
will
always
sign
in
in
Philadelphia
when
he
tried
to
investigate
the
the
particular
person
and
deliver
the
mail.
We
try
to
investigate
some
of
the
problems
that
might
happen
in
our
like
microservices
environment,
and
things
like
that.
B
B
So
we
build
tools
that
allows
you
as
a
developer,
build
your
API
apis,
deploy
your
apis
govern
your
apis
and
all
those
kind
of
things
and
Kuma
is
was
one
of
the
projects
that
we
started
at
juank
and
we
a
couple
years
back
with
donated
this
to
cncf,
and
we
continue
to
to
develop
to
develop
this
service
mesh
in
in
open
in
open
Forum.
Also,
we
use
this
internally
to
build
our
own
SAS
offering
for
for
service
mesh.
B
You
can
follow
the
kuma
mesh
in
Twitter,
very
active
Twitter,
and
we
have
a
very
active
slack
Community
as
well.
So
brief,
a
brief
agenda
for
today's.
For
this,
today's
presentation
and
the
first
part
I,
would
answer
what's
Kuma
and
probably
how
it's
different
from
istio.
It's
the
one
of
the
probably
favorite
questions
to
answer:
what's
the
open,
Telemetry,
what's
the
benefits,
and
hopefully,
as
Whitney
mentioned
at
the
very
beginning,
we
break
some
things.
B
B
Essentially,
service
mesh
includes
a
control
plane,
which
is
a
service
that
will
be
responsible
for
storing
configuration
of
your
like
microservice
traffics,
and
things
like
that
and
also
stored
configuration
about
the
policies
that
you
want
to
enforce.
Inside
your
service
mesh
and
one
of
the
roles
of
control
plane
is
to
to
manage
and
monitor
data
planes,
so
data
planes.
B
It
is
a
in
this
current
iteration
of
the
service
mesh
history,
I
would
say
it's
a
second
generation
of
service
mesh
we
have
control
plane
is
the
separate
process
that
runs
next
to
your
microservice
and
it
basically
proxies
all
the
traffic
and
communication
happens
through
this
procs.
It
can
be
kind
of
like
a
reverse
proxy
for
for
your
services.
B
Now
data
plane
is
separate
process
life
cycle
of
your
application
of
lifecycle,
field
data,
plane,
they're,
not
they
not
connected,
so
you
can
upgrade
your
applications
without
updating
data
planes
and
control.
Plane
will
be
responsible
for
for
making
sure
that
the
data
plane
is
up
and
running
and
has
all
required
information
to
pass
the
traffic
from
one
service
to
another.
B
So
back
to
question
about:
what's
how
it's
different
from
istio,
so
istio
is
another
service
mesh
or
recently,
like
almost
almost
a
year
ago,
right
istio
joined
cncf
as
a
another
service
mesh
project
which
brings
number
of
service
mesh
projects
inside
cncf2,
I,
guess,
eight
or
or
or
seven,
or
something
like
that,
and
the
istio
popularized
the
the
concept,
but
obviously
istio
was
not
the
first
one
that
implemented
this.
So
Kuma
includes
the
very
similar
components
that
Easter
includes
Akuma
relies
on
this
in
other
cncf
project
called
Envoy
proxy.
B
So
the
envoy,
it
is
a
Genie,
tiny,
super
fast
proxy
server
that
runs
next
to
your
application.
This
is
going
to
be
data
plane.
It
still
uses
the
same
thing
if
we
gonna
be
I
personally,
not
a
huge
fan
of
doing
this
kind
of
like
okay.
Let's
do
the
checkbox
comparison.
Things
like
that
there
is
a
if
you
Google.
B
You
can
find
there's
very
interesting,
like
a
Google
spreadsheet,
where
the
different
service
mesh
is
compared,
but
three
things
that
when
we
designed
Kuma
and
when
we
build
cool
in
the
very
beginning,
we
wanted
to
put
put
a
front.
Is
developer
developer
productivity?
We
don't
want
it
to
overwhelm
a
developer
with
like
numbers
of
all
possible
CRTs
that
you
need
to
configure
in
order
to
to
run
this
deploy
deployment
of
control.
Plane
is
literally
one
deployment,
and
when
we
run
this
in
kubernetes,
we
can
enable
sidecar
injection
label
into
namespace
and
control.
B
Plane
will
be
responsible,
for
you
know
inject
inside
car
to
any
application,
so
developer
productivity
is
is
the
key
here.
Second
thing
was:
when
we
planted
this.
We
really
wanted
to
think
how
the
people
running
their
workloads
and
in
many
cases
and
big
organizations
they
not
running
those
one
single
workload
across
I,
don't
know
like
one
AWS
region
or
one,
the
Google
Cloud
region,
they're
running
this
across
multiple
regions,
or
even
even
maybe
across
the
cloud.
B
What
does
it
mean
in
terms
of
Kuma,
and
this
will
brings
us
to
to
kind
of
like
a
created,
unified
platform
for
your
application
to
run
regardless,
where
the
physical
deploy?
And
the
third
step
is
that,
even
though
we're
talking
about
the
kubernetes
we
all
about
all
this,
like
kubernetes
life
and
deploying
the
our
pods
like
every
every
minute
of
the
day,
many
Engineers
sres
they
deploy
applications,
not
necessarily.
B
They
deploy
applications
and
VMS.
They
deploy
the
application
to
some
other
systems
of
deployment.
So
one
of
the
goals
was
to
create
Kuma
as
universal.
We
call
it
Universal
mesh,
meaning
that
it's
not
it
doesn't
have
a
dependency
like
a
very
strict
dependency
on
kubernetes.
You
can
deploy
same
number
of
data
planes
in
kubernetes
some
number
of
data
planes
in
in
VMS
and
after
that
they
will
create
this
unified
environment
across
heterogeneous
Network.
Hopefully
there
was
answer.
A
I
kind
of
have
a
question
I'm,
going
to
restate
what
I
so
so
three
differences
that
set
it
apart
from
sdo
one
is
that
it
has
a
it's
more
simple
to
use
like
a
better
developer.
Experience
specifically,
you
said
the
other
is
expands.
You
can
span
geographical
regions
with
it
pretty
well,
and
the
third
is
that
it's
not
kubernetes
specific,
and
so
the
question
I
have
is.
Is
that
what
it
sets
it
apart
from
istio
specifically,
or
does
that
also
set
it
apart
from
other
service
meshes
in
the
space
yeah.
A
B
A
B
Going
with
the
istio
because
they
were
introduced
on
the
early
stage
and
they
kind
of
like
learn
how
to
you
know,
love
and
hate.
Sometimes
people
love
this.
Sometimes
people
find
it
challenging
in
situation
when
they
need
to.
You
know
scale
this
outside
kubernetes,
because
istio
is
is
very
well
connected
to
to
kubernetes
or
you'd
want
to
do
things
around
things
around,
like
I
said
with
the
the
multi
multi-zone
multi-cluster
deployment
and
all
these
kind
of
things,
but
most
important
thing,
don't
listen
to
me.
Don't
listen!
B
Some
other
vendors.
You
have
to
decide
what
you're
comfortable
when
you're
implementing
service
mesh
in
your
environment.
What
kind
of
problem
is
solves
for
you.
You
know
there
would
be
plenty
of
presentations.
People
will
get
you
excited
about
this,
and
my
goal
is
not
to
tell
you
hey.
This
is
the
best
one.
My
goal
is
to
show
you
what
is
available
and
help
you
to
decide
if
it
is
something
that
you
want
to
use
in
your
organization,
or
maybe
you
want
to
go
with
this
with
other
things
that
is
I,
don't
know.
B
B
I'm
here
just
to
show
the
options,
that's
why
I
said
I'm,
not
a
huge
fan
of
doing
this
kind
of
like
oh
okay,
let's
get
compare
the
feature.
This
has
this
feature,
and
this
has
this
feature.
This
has
because
there
is
a
plenty
of
those
materials
in
I.
I
will
try
to
show
what
is
possible,
and
you
know
our
audience
will
will
decide.
I.
A
B
It
can
be
deployed
and
used
to
VCS
I
believe
we
have
a
documentation
there.
If
you
couldn't
find
this
drop
me
a
DM
and
Twitter,
my
Twitter
is
conveniently
placed
at
the
bottom
of
my
presentation
so
in
in
in
any
case,
if
you
want
to
kind
of
like
hey
victory,
can
you
send
me
this
link?
I?
Will
I
will
do
that?
For
you
all
right,
we
see
Sanji
from
join
us
from
Frankfurt,
which
is.
A
B
Yes-
and
this
is
just
basically
overall
architecture
of
any
kind
of
like
a
service
mesh
as
I
said,
Kuma
is
a
cncf
incubating
project
I'm,
sorry
sandbox,
like
we,
we
really
want
to
to
do
incubating
closer
to
kubecon.
So
we're
working
right
now
in
order
to
kind
of
like
make
this
official,
but
we
do
have
a
some
some,
some
very,
not
ginormous,
but
I
guess
we
have
a
very
fast
growing
community
of
the
users
and
we
also
provide
commercial
support.
B
So
we
know
like
people
who
you
know,
build
this
stuff
for
as
a
commercial
thing
and
the
in
this
presentation,
I'm
gonna
talk
only
about
Kuma,
so
you
can't
match
that
we
built
on
top
of
it
has
some
different
Shader,
but
I'm
not
gonna,
attach
this
today.
So
everything
is
going
to
be
like
as
this
and
you
can
take
this
and
run
with
it
and
yes
and
Envoy
Envoy.
So
since
we're
talking
about
observability,
it's
it's
great
the
opportunity
to
talk
a
little
bit
about
Envoy.
B
An
early
stage
that
services
that
this
only
would
be
fronted
as
a
proxy.
There
needs
to
be
dynamically
configurable,
so
we
don't
have
to
send
the
person
to
go
and
configure
our
proxy
server.
This
needs
to
be
API
to
to
to
configure
this
and
observable
all
the
way,
so
they
want
to.
They
want
to
see,
first
of
all,
every
time
when
you're
introducing
some
additional
Hub
in
your
network,
you
want
to
make
sure
that
you're
not
introducing
unnecessary
latency
here
right.
B
So
they
want
to
make
sure
that
the
things
that
we're
introducing
with
this
proxy
will
not
introduce
additional
problems,
so
they
need
to
have
observability
along
the
way,
all
the
things
that
Envoy
provides,
and
these
two
things
help
people
to
build
some
of
the
other
things
on
top
of
the
envoy.
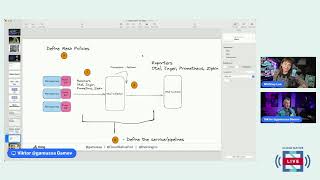
So
so
what
what
the?
What
the
control
plane
is
actually
does.
It
takes
the
definition
of
whatever
Network
policy
and
translate
this
into
configuration
that
will
be
shipped
into
Envoy,
including
the
things
we've
we're.
B
I
will
talk
about
this
when
we
will
introduce
those
why
you
want
to
introduce
failures
and
and
yeah,
and
another
thing
is
to
to
to
observe
services
and
collect
the
metrics
from
the
from
the
older
nodes
which
brings
us
to
to
open
Telemetry
open
Telemetry.
It
is
a
standard.
First
of
all,
it's
a
standard
that
come
up
over
years
of
different
industry
leaders
talking
about
different
pillars
of
observability.
We
know
this
is
metrics
traces
and
logs.
Those
are
considered
the
pillars
of
observability,
so
metrics
will
give
you
information.
B
What
is
happening
right
now.
Logs
will
give
you
information.
What
has
happened
and
traces
basically
give
you
kind
of
like
this
trace
this.
What
happened
across
the
system,
because
we're
going
to
be
interacting
between
multiple
microservices
and
we
want
to
know
that
what
happened
in
the
system
acts
when
failure
happened
on
the
system.
B
Why
so
that's
kind
of
the
open
Telemetry
as
an
open
source
project
includes
specifications
including
set
of
tools
to
collect
data
set
of
libraries
that
you
can
embed
in
your
applications
in
instrument
your
applications
and
send
Telemetry
data
into
whatever
system.
That's
able
to
consume
it.
So
that's
the
that's.
That's
the
that's
the
premise.
There's
a
different
groups,
I
would
say
some
some
group
of
developers.
They
prefer
to
have
a
control
over
the
things,
so
they
prefer
to
embed
this
open,
Telemetry
libraries
in
their
application.
B
So
in
this
case
they
instrument
their
application
by
enabling
these
libraries
another
group
of
people.
They
want
to
keep
their
microservices
teeny
tiny
and
they
don't
want
to
include
additional
tools
or
additional
libraries
in
their
microservices
and
also
manage
those
things
and
make
sure
that
the
libraries
have
a
capabilities
across
different.
B
And
things
like
that,
so
those
people
want
to
have
a
infrastructure
that
will
be
able
to
collect
all
the
data.
So
essentially
we're
going
to
talk
for
the
rest
of
this
presentation.
We're
going
to
talk
about
the
second
part
of
this,
so
I'm
not
gonna,
go
ahead
and
instrument.
My
my
applications
in
order
to
support
open,
Telemetry
I'll
show
you
how
we
can
enable
declaratively
when
the
application
runs
inside
service.
A
B
B
So
this
thing
that
I
have
here
in
the
center
of
my
screen,
so
open,
Telemetry
collector.
This
is
the
small
intermediate
tool
that
we're
going
to
be
using.
You
can
definitely
use
some
of
those
open,
Telemetry
backends
without
it,
but
this
opens
Elementary
collector
does
a
few
interesting
things
that
you
definitely
want
to
check
it
out.
B
So,
first
of
all,
it
has
the
ability
to
batch
things,
so
you
don't
want
to
with
a
number
of
metrics
and
traces
and
logs
that
your
system
has
overwhelm
your
back
end,
so
open
Telemetry
collector
can
perform
some
batching,
so
we
can
optimize
how
the
metrics
would
be
delivered
without
sacrificing
the
you
know,
the
the
delays
for
receiving
the
metrics,
for
example,
also,
the
we
can
have
not
every
system-
might
have
native
support
for
open
television.
So
that's
why
there's
another
component
called
receiver
that
can
collect
this
data.
B
This
Telemetry
data
from
different
systems,
including
native
open
Telemetry
format,
or
maybe
Jagger
format
or
Zipkin
format
or
in
format
of
Prometheus
and
open
cell
music.
Collector,
will
check
this
into
something
that
will
I
can't
understand,
so
maybe
even
do
some
of
the
processing
and
transformation
along
the
way.
So
we
have
a.
We
have
a
receiver
that
gets
the
data
from
the
system
of
our
system.
B
In
order
to
in
order
to
collect
this
data
inside
service
mesh,
we
will
need
to
define
a
policy
that
will
be
collecting
some
of
the
information
that
going
between
different
different
components
and
send
this
into
open,
Telemetry
collector.
So
is
the
time
where
I
am
switching
from
my
presentations
and
going
into
my.
B
Where
should
we
start?
We
should
start
with
the
quick
observation
of
this
application
so
right
now,
this
application
is
deployed
into
microbrands
cluster
that
runs
somewhere
in
gcp,
and
this
is
my
like
the
public
IP
address.
You
can
go
and
hit
this
IP
address
from
from
from
anywhere
in
the
world,
and
in
this
case,
if
you
go
to
this
IP
address,
slash
work,
it's
a
simulator
of
my
life.
So
when
I
go
to
work,
I
do
I.
Do
meetings
I
go
to
meetings.
So
that's
why?
B
B
It
has
a
deployment
that
includes
this,
this
application
and
it
has
a
service.
So
this
this
within
within
currents
cluster,
it
will
be
available
through
meeting
Dot
mesh
for
devs
namespace
work.
Application
includes
a
few
things
here,
so
it's
also
deployment,
but
also
it
needs
to
receive
the
meeting
URL
from
from
somewhere,
because
one
of
the
components,
one
of
the
important
step
when
you're
running
this
in
microservice
world,
is
service
Discovery.
B
So
somehow
the
services
needs
to
be
discovered
in
the
configuration
needs
to
be
provided
to
to
two
applications
to
receive
this
URL.
So,
in
this
particular
case
I'm
using
this
kubernetes
default,
even
though
there
is
the
ways
how
we
can
customize
it
and
specifically
for
when
we
need
to
deploy
this
in
the
multi-zone
multi-mesh
environment,
we
really
don't
want
to
rely
on
like
a
nem
spaces
or
some
some
other
places
where
it
can
identify
our
service
in
a
not
very
consistent
way.
B
So,
for
example,
the
service
mesh
also
provides
DNS
service
and
DNS
service
with
DOT
mesh.
You
can
customize
it
and
inside
everywhere,
inside
this
mesh,
this
meeting
application
will
be
accessible
through
this
mesh
DNS
name
or
through
the
port
directly
I'm
not
gonna,
spend
much
of
the
time,
because
it's
like
slightly
beyond
the
the
actual
topic
for
for
today,
conversation,
even
though
it's
also
related
to
Traffic
policies
inside
service
mesh,
so
and
also
Kuma
itself
includes
a
Gateway
component
that
allows
me
to
expose
the
service
to
a
site
world.
B
So
the
way
how
it
looks
like
is
actually
exposes
my
work
service.
Through
this
this
prefix
and
inside
the
kuma,
we
use
Envoy
as
a
Gateway,
so
we
provisioned
another
data
plane
that
would
be
special
type
of
this
data
plane
that
will
behave
as
a
Gateway
for
for
our
application.
So
that's
why
I
said
every
time
if
you
want
to
hit
this
URL
right
now
from
the
well
from
from
your
computer
like
what
what
could
go
wrong,
so
you
can
do
something
like
I.
B
Let's
take
a
look
at
how
this
service
mesh
thing
is
looks
like
so.
Kuma
also
comes
with
the
with
very
very
nice
UI,
so
it
comes
with
this
UI
control.
Plane
exposes
this
UI,
so
I
can
get
in
to
see
what
is
going
on
in
my
in
my
mesh
there's
a
bulge.
If
you
have
a
multiple
different
meshes
deployed
here,
you
will
see
those
here
but
we're
interested
in
default.
For
now,
and
here
we
can
investigate
some
of
the
data
plane
proxies
that
deployed
next
to
our
next
to
our
applications.
B
So
I
can
see
there's
a
few
services.
One
service
is
for
my
work
application,
one
service
for
my
music
application,
and
this
is
the
special
type
of
service
that
was
created
by
Kuma.
That
will
be
Gateway
form
for
our
application
and
also
inside
my
cluster
I'm
running
prometheus's
grafana,
like
just
to
see
what
is
going
on
there.
They
also
joined
the
mesh
and
the
mesh.
A
B
Screen
so
some
of
the
very
people
who
watch
this
with
very
much
attention,
I'm
just
lost
the
word,
how
I
can
say
this
the
person
who
can
see
this
with
attention
anyway?
So
if
you
would
look
careful
to
this
position,
you
can
notice.
This
is
the
yaml.
Here
is
not
exactly
like
yaml
here.
So
that's
the
that's.
B
The
part
of
this
Universal
mode
kind
of
this
is
the
yaml
how
this
mesh
can
be
configured
if
you're
running
this
website
kubernetes,
but
inside
kubernetes
it
looks
how
kubernetes
how
kubernetes
people
expecting
this
thing
to
see
to
to
to
see.
In
this
particular
case
we
have
API
version,
I
have
a
kind,
so
it's
going
to
be
crg
inside
if
I
go
just
do
controlled
yet
mesh
and
there's
a
bunch
of
different
crgs
is
already
deployed.
B
There's
a
mesh
fault
injections,
Gateway
instances
mesh
and
sites
proximation
a
lot
of
a
lot
of
cool
things
that
can
be
can
be
configured
here
and
inside
this.
This
policy.
What
we
want
you
to
have
is
we
want
you
to
have
all
the
traffic
will
be
collected
through
the
back
end,
so
we
need
to
Route
all
these
traces
information
somewhere
inside
micromise
cluster
I
already
have
a
couple
things
that's
running
here.
B
Specifically,
if
I'm
running
here
there's
my
open,
Telemetry
collector
that
will
be
available
within
my
kubernetes
cluster
through
this,
my
open
telemetrycollector.default
SVC
cluster
local.
So
all
the
metrics
will
go
there
and
I
can
put
some
additional
some
additional
information
for
kuma2
to
collect
so
I
want
to
include
environment.
Header
I
want
to
include
the
version
information
so.
A
B
I
will
be
deploying
these
applications
and
redeploying
the
application.
I
will
be
able
to
trace
down
and
see
what
is
going
on
here
now
with
the
with
this
Trace.
Where
is
it
I'm?
Sorry,
yep,
so
with
the
open,
Telemetry
collector
I
need
to
also
configure
this
collector
somehow
so
the
way
how
it
works
in
Helm
chart
that
is
open,
Telemetry
collector,
provides
me.
You
can
actually
get
the
there's
a
lot
of
things
configured.
You
can
configure
multiple
different
environments,
different
Integrations
and
all
this
kind
of
things.
B
So
this
is
the
the
The
Collector
is
very
sophisticated
and
has
a
lot
of
things.
The
Collector
this
the
things
in
the
center
that
I'm
talking
right
now,
it's
an
open
television
collector
inside
this
open,
Telemetry
collector
I
strip
down
this
to
something
that
can
be
easily
digested
for
for
my
use,
we
go
with
with
pipelines
that
will
Define
how
the
data
will
flow,
so
pipelines
include
traces.
It
includes
logs.
We
receive
this
from
otlp,
which
is
open,
Telemetry
receiver.
B
We
do
some
processing
in
this
particular
case
we're
going
to
be
batch
this
with
the
default
configuration
and
we
export
those
traces
same
thing
for
the
logs
so
inside
here
inside
this
yaml
I'm,
going
in
seeing
this
receiver
that
configures
this
open,
Telemetry
collector.
So
this
open,
Telemetry
collector,
will
be
available
through
this
port.
B
This
is
processor,
nothing
fancy,
but
the
magic
actually
happens
here.
So
the
exporter,
that's
the
back
end
that
will
be,
you
know,
collect
all
the
data
back-end
can
be
here.
Something
like
Jagger
can
be
back.
End
can
be
something
like
a
data
dog,
something
like
honeycomb
I,
just
use
honeycomb,
because
I
found
the
their
integration
is
like
easiest
to
do.
For
me,
I
just
need
to
put
the
endpoint
and
API
key.
Don't
worry.
This
API
key
will
disappear
right
after
the
stream.
B
Just
the
reason
I'm
showing
this
just
to
to
see
like
everything
is,
is
very
explicit.
Now
and
after
that,
once
this
data
will
be
produced
by
my
services,
I
will
call
one
service.
This
data
will
will
Gateway
will
call
work,
service,
work,
service,
we'll
call
our
meeting
service
and
all
the
trace
information
will
be
propagated
to
open
Telemetry
collector
in
open
Telemetry
collector
will
push
it
into
the
honeycomb.
So,
let's
see
how
this
will
work
so
for
that
I
will
be
using
very
sophisticated,
The
Benchmark
tool
to
generate
some
traffic.
B
It's
called
send
a
request
on
interval,
so
the
insomnia
in
this
case
will
be
sending
this
request
every
second
so
and
we
will
start
getting
some
of
the
interesting
data
here.
Obviously
open
Telemetry
collector
has
the
default
log
collector
it's
kind
of
like
a
backend
that
doesn't
go
anywhere
and
all
the
headers.
All
this
information,
that's
coming
from
the
systems,
will
be
spit
out
here
in
the
log,
so
you
can
also
see
if
this
actually
working,
but
we
visual
people
would
like
to
see
if
it
actually
works
with
the
with
the
system.
B
So
for
the
last
10
minutes,
let's
see
I'm
start
getting
some
of
the
some
of
the
traffic.
Some
of
the
data
comes
in
and
I
can
see.
The
trace
is
coming
in
here
can
show
me
different
things.
Excuse
me
so
I
would
love
to
see
actual
spans
in
this
particular
case.
There's
one
that
happens
one
second
ago.
Let's
explore
it,
what
kind
of
information
we
will
be
able
to
see
here
so
now
we
see
the
data
comes
into
into
router.
That
has
our
Gateway.
After
that,
our
request
goes
into
into
service.
B
B
This
can
be
how
this
information
can
be
useful.
Well,
some
of
the
information
can
be
useful
for
situations
like
investigating
some
problems.
How
we
can
get
into
problems
in
the
world
of
service
mesh
service
mesh
can
help
you
solve
the
problems,
but
also
it
can
introduce
some
of
the
problems,
and
this
is
actually
very,
very
cool
thing
that
service
mesh
can
do.
There's
a
concept
called
a
fault
injection
that
comes
from
I
guess
it
comes
from
this
chaos.
Engineering
methodology
right,
you
kind.
A
B
A
injecting
failures
on
purpose
inside
your
system,
so
you
see
how
your
system
will
behave
when
we,
when
we,
when
I
talk
to
my
E
Series,
that
who
support
the
connect
Cloud,
they
have
this
concept
of
game
day.
So
what
does
it
mean?
The
one
of
these
one
of
the
practices
that
they
like
to
do
is
to
have
a
scenario
of
a
failure
and
inject
declaratively.
This
failure
into
the
system
and
as
a
as
an
architect
of
the
system
or
like
a
SRE
of
the
system.
B
They
have
some
idea
what
could
happen
because
people
know
about
systems
or
some
people
might
not
know
what
could
happen
because
they
just
joined
the
team.
They
don't
have
a
full
context.
What
happens
so
there's
a
scenario:
how
the
system
will
behave,
including
maybe
a
system
will
go
to
failure.
It
will
start
send
alerts
and
all
this
kind
of
things,
all
this
fun
stuff
that
you're
expecting
at
night
when
you
sleep
in
and
something
goes
wrong
with
your
life
system
in
order
to
sleep
a
little
bit
better
people
like
to
be
prepared.
B
B
B
Also
I
really
want
to
see.
If
my
Telemetry
system
will
be
able
to
report
those
problems,
at
least
at
least,
we
will
be
able
to
absorb
because
I'm
not
going
into
kind
of
in
alerting
mechanism,
because
it
would
be
also
different
from
this
system
or
whatever
you
use,
but
at
least
you
have
a
data,
so
you
will
be
able
to
do
this,
so
I'm
go
ahead
and
and
just
do
apply,
mesh
fault
injection,
so
fault
injection
is
created.
So
now
immediately
we
start
seeing
like
one
meeting
two
meetings.
We
start
seeing.
B
B
B
Over
here,
yeah
yeah,
so
first
of
all
we
reported
some
of
the
traces
and
some
of
the
traces
we
can
go
and
just
query.
We
can
just
show
what
are
my
errors
and
it
can
show
some
of
the
supposed
to
be
showing
me
where's
it.
There
should
be
something
like
all
data
sets
and
text
and
what
are
my
errors?
We
will
be
able
to
see
our
500s
two
hours
prior
one,
so
we
do
have
a
few
errors.
B
B
In
my
configuration
here,
I
also
collecting
not
only
traces
but
also
like
access
logs
and
inside
my
mesh
I
have
a
policy
configured
that
also
pushes
data
into
open,
Telemetry
collector
from
the
policy
that
called
mesh
access
log.
So
that's
another
thing
that
you
can
use
in
your
tool
belt.
Now,
let's
go
back
into,
let's
see
if
I
will
be
able
to
see
some
of
the
recent
traces
that
will
include
the
error.
B
So
let's
take
a
look
now
immediately.
What
we
can
see
here
so,
first
of
all,
it's
not
it's
not
precise
science
like
when
I
said
it's
gonna
be
50,
it's
actually
sampling
and
also
there's
a
sliding
window.
So
we
as
people
like
to
observe
things
in
a
deterministic
world,
but
computers
in
the
real
life
is
not
happening
in
the
deterministic
world.
So
in
our
sliding
window
that
we're
trying
to
observe
in
this
particular
case
it
was
just
like
one.
B
One
of
these
request
failed,
but
if
I
open
another
span,
we
can
find
in
our
if
we
want
to
be
like
a
very
picky
about
kind
of
like
what
are
we
talking
about,
but
essentially
what
I'm
trying
to
show
you
here
that
the
in
the
real
life?
If
you
have
a
real,
live
500
response,
you
probably
will
have
a
different
different
lens.
You
will
be
able
to
get
the
trace
where
the
thing
happened
and
after
that
you
can
use
the
tools
like
Loki
that
captures
all
the
logs
and
the
correlate.
B
B
B
And
if
I
go
yeah,
so,
for
example,
here
I
will
be
able
to
navigate
into
particular
like
place
in
the
lock,
supposedly,
why
Victor,
you're,
not
navigating
to
the
right
place
so
inside
the
log
I
will
be
able
to
see
what
has
happened
here.
What
kind
of
error
happened
like
there's
a
Java
net
UGL,
whatever
error
happens
so
from
the
trace?
There's
a
good
correlation
between
logs.
So
you
know
like
where
exactly
air
happened
so
like
in
this
particular
case.
A
A
B
B
We
can
see
the
situation
with
cascading
failures
and
the
usual
usually
the
way
how
you
can
do
the
the
way
how
you
can
detect
the
cascading
failures
you
see,
the
latency
is
growing
because
one
system
trying
to
reach
another
system
and
there
would
be
either
retries
or
something
like
that.
So
by
default,
when
you
run
this
inside
the
kuma
mesh
Kuma
actually
applies.
Some
of
the
remember
when
I
was
talking
about
the
developer
experience.
We
also
wanted
to
apply
some
of
the
sane
sane
policies.
B
For
example,
there's
a
circuit
breaker
policy
that
automatically
for
every
service
inside
the
mesh
will
introduce
Max
number
retries.
So,
even
because
we're
writing
this
in
kubernetes
we're
running
this
in
a
in
a
in
a
in
a
it's.
It's
not
the
educated
environment,
because
probably
my
cluster
is
uses
like
a
cheapest
possible
tier
on
Google
Cloud,
so
it
uses
shared
infrastructure.
So
some
of
the
failures
can
happen
just
because
you
know
I'm
running
this
in
somewhere
else
computer.
B
B
There
is
also
a
retry
policy
that
is,
we
configured
based
on
some
like
empirical
and
based
on
recommendations
for
community.
So
it's
kind
of
like
a
good
enough,
but
as
a
as
a
serious
operator,
you
will
be
able
to
go
and
check
these
things
without
changing
the
code
of
application.
That's
whole
kind
of
like
a
whole
purpose
of
this.
A
So
I
have
a
couple
of
questions.
One
is
if
there's
time
also
do
you
have
enough
presentation?
Okay,
one
is
about.
You
showed
briefly
that
you
can
use
the
service
mesh
to
expose
your
service
to
outside
of
the
cluster.
Does
that
mean
you
would
use
this?
You
could
possibly
use
this
as
your
Ingress
implementation.
Like
you
might
not,
you
might
not
have
a
separate
Ingress.
You
could
just
use
Kuma
all
the
way.
Yes.
B
So
the
the
thing
what
we
like
to
say
here
at
Kong,
so
the
Kong
known
as
a
as
a
one
of
the
most
popular
one
of
the
most
popular
API
gateways
and
people
usually
expect
every
time
when
they
talk
about
all
the
things
like
I
will
bring
the
call.
So,
yes,
it
will
work,
definitely
with
a
Quant
as
an
external
API
Gateway.
Potentially
it
also
will
work
with
any
Ingress
controller,
so
the
way
how
it
works
it
will
service
mesh
will
also
inject
the
data
plane
proxy
into
this,
like
Ingress
controller.
B
So
potentially
it
will
also
be
able
to
work
with
any
Ingress
controller.
Many
users
and
customers
they're,
asking
like
oh
okay,
I,
don't
want
to
over
complicate
my
infrastructure.
So
in
this
case
I
just
want
to
have
like
a
bare
minimum
on
this.
I
don't
want
to
like
have
a
full
blown
API
Management
on
my
system
and.
A
B
Like
okay,
we
have
already
an
Envoy,
and
what
about?
We
will
just
like
use
Envoy
as
our
Ingress.
So
this
is
exactly
what
the
mesh
Gateway
does
and
if
you
think
about
this
last
year,
I
think
last
year
was
the
cubecon,
when
the
Envoy
team
announced
that
they
gonna
be
building
a
Gateway
based
on
onwards
and
based
on
the
Gateway
API,
which
is
another
very
exciting
piece
of
specification
that
come
in.
B
Hopefully,
this
this
winter
will
come
into
kind
of
like
GA,
or
at
least
like
land
as
a
as
a
as
a
good
to
test
type
of
thing
inside
the
kubernetes.
So
we
as
a
community,
we
work
closely
with
the
cncf
and
Cube
kubernetes
special
interest
group,
like
a
few
Engineers
from
from
conc,
actually
helped
to
to
to
Define
Gateway,
API
and
Gamma,
which
is
gamma,
is
a
gateway
for
for
for
meshes
so
specifications
for
for
this.
So
it's
all,
it's
all
shaping
up.
B
B
A
B
A
B
A
B
A
B
Said,
okay,
so
I
will
include
the
some
some
you
know
some
stuff.
There
is
a
should
be
something
like
a
service
name.
There
should
be
something
like
some
additional
information
like
environment
or
something
like
that
user
agent
data
was
extracted
from
the
headers,
so
you
will
be
able
to
see
same
information
regardless.
It's
the
the
format
of
the
payload.
B
B
Where
is
if
you're,
using
this
as
a
library,
so
you
use
spring
boot
with
micrometer,
so
hopefully
there's
an
easy
way
to
migrate.
One
format
to
another
Sometimes
some
of
the
fields
are
not
available.
Sometimes
there
are
other
fields
like
available
in
one
format:
they're
not
available
in
another
format,
so
it
will
require
some
of
the
you
know:
application
code
change
in
another
things
to
consider
when
you're
using
libraries
different
languages
might
have
its
support
for
different.
B
B
B
B
A
B
A
B
So
a
lot
of
a
lot
of
things
like
three
years
ago,
I
said
I'm,
not
gonna.
Do
any
tick!
Tocks
now
I'm
doing
like
short
videos
explaining
like
a
smaller
bits
about
API
management,
so
yeah
if
you're
interested
in
API
management,
kubernetes,
Cloud
native
Technologies
service,
mesh,
I,
I,
post
a
lot
of
content
on
the
Kong
YouTube
channel,
Channel
and
I'm.
Happy
to
you
know,
answer
any
questions.
Regardless
of
of
the
topic.
I
I
know
a
few
a
few
things.
A
B
A
A
B
We
did
it,
we
didn't
live
up
to
our
promises.
No,
there
were
a
few
things
that
they
were
broken,
but
I
didn't
show
this.
It's
kind
of
you
know
remember
this
meme
from
the
office
when
they
you
know
when
the
in
the,
when
the
presentation
went
well
and
the
the
customer
didn't
notice
and
the
white
truth
is
kind
of
like
a
smirky.
Looking.