►
From YouTube: DevoWorm #43: Spherical embryo measures, flat embryo maps, 2D, 3D processes, cross-species hourglass
Description
Revisiting the spherical embryo mapping (surface phenomena, from 2-D to 3-D projection). Paper on flat embryo maps (3-D to 2-D projections). Speed-Strain curves from 3-D modeling. Reaction-diffusion in 2-D vs. 3-D. Paper on the hourglass model for understanding gastrulation dynamics in mouse and rabbit. Attendees: Richard Gordon, Susan Crawford-Young, Bradly Alicea, and Morgan Hough
A
A
B
C
B
B
C
C
So
I
got
a
message
from
Hari
Krishna
and
you
know
that
a
lot
of
the
people
were
working
with
this
summer
went
on
to
study
and
things
like
that,
but
he
wanted
to
start
to
get
back
into
the
project
he
was
working
on,
so
the
digital
microsphere,
the
the
application
that
he
built
and
I
know
Quran
also
built
an
application.
So
there
are
two
applications
and
we
have
them
here
in
the
there's
a
on
the
GitHub
repository.
C
A
C
C
A
B
C
So
they
yeah
this
is
their.
These
are
their
projects
that
were
well.
You
know
they
have
a
simple
sort
of
instructional
page
on
this,
so
this
kind
of
talks
about
how
to
use
the
software
I
think
that
there's
a
some
of
the
data
that
you
provided,
they're
using
it
in
a
sort
of
a
sample.
So
there's
like
a
sample
that
and
you
can
open
it
up
and
actually
see
it
in
action,
but.
C
C
And
then
it's
this
gsoc
2022
directory,
which
is
actually
I,
think
it's
a
repository
which
is
down
about
five
and
then
you
go
in
and
it's
it's
right
there.
So
that's
that's
where
they're
at
and
then
there's
the
digital
microspheres
directory
and
then
they're
in
here
so
modeling
acts.
A
lot
of
embryos,
of
course,
is
a
quran's
project.
Where
he's
basically
taken
the
data
that
you
provided.
C
You
know
tile
the
sphere
and
you
could
play
with
it
in
that
software
and
then
Hurricane's
project
is
the
same
thing.
Really
it's
just
a
different
set
of
algorithms,
which
is
this
digital
microsphere
see
so
that
one.
This
is
the
readme
for
that,
and
his
of
course,
is
a
little
bit
different
he's
he
kind
of
walks
through
the
creation
of
the
Model
A
little
bit
more
than
Quran
did
but
basically
he's
taking
this
mesh.
C
C
If
you
look
at
the,
if
you
open
up
the
software
and
you
and
you
start
to
work
on
it
or
start
to
work
work
through
it,
you
basically
have
the
sphere
in
a
3D
space
reload
the
model-
and
this
is
just
the
sample
data
set
these
providing,
and
so
so
I
mean
you
know
it.
It's
functional.
It
works
to
some
extent,
but
it's
you
know.
They
can't
really
do
much
very,
very
much
right
now.
C
This
was
supposed
to
be
like
a
proof
of
concept
and
what
he
wants
to
do
is
he
wants
to
work
on
like
how
do
you?
What
do
you
use
this
for?
How
can
I
make
this
better
and
you
know
maybe
introduce
some
measures
so
in
the
meetings
we've
talked
about,
you
know
creating
some
metrics
that
we
can
use
to
measure
things
across
the
surface,
like
you
know,
taking
the
distance
from
one
point
to
another,
finding
the
centroid
of
a
cell
and
measuring.
C
Maybe
the
geometric
Properties
or
some
of
the
distances
and
then,
of
course,
there's
also
cell
lineage,
but
you
know
that's
something
that
might
require
a
little
bit
more
work,
and
so
that
he's
interested
in
doing
that.
So
this
is
where
you're
putting
data
in
the
sphere
and
you're
loading
it
up
and
I.
Imagine
there's
a
lot
of
calibration
work.
That
needs
to
be
done
too.
A
B
C
C
C
C
C
B
C
C
C
B
B
C
C
B
C
And
we
talked
about
the
features,
but
I
know
he
didn't
have
time
to
to
finish
them,
but
to
have
like
an
analytical
toolbox,
where
you
know
you
can
do
different
things
to
the
embryo,
you
can
measure
different
areas
of
the
embryo.
You
can
I,
don't
know
if
you
can
animate
it
I
think
that
would
be
a
little
bit
too
much
where
you
animate,
like
cell
division.
We
didn't
need
to
have
like
more
extensive
data
to
put
on
to
this
thing,
but
yeah
I
mean
you
know.
A
A
A
B
B
Okay,
contraction
away-
maybe
you
can
take
the
we
guessed
the
one
that
goes
then
leaves
the
neural
plate
behind
yeah.
That's
an
easy
one
that
that's
an
easy
one.
It's
there's
a
lot
of
shape,
change
with
it
because
it
changes.
It's
actually
changes.
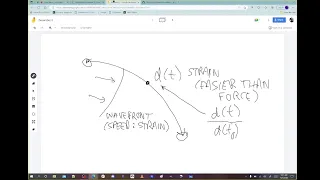
Concavity.
The
wave
change
is
kind
of
from
from
convex
to
concave,
and
if
you
measure
strain
by
the
distance
between
two
cells,
you
can
make
a
strain
map
and
then
you
can
ask
if
the
trajectory
the
local
trajectory
of
the
wave
follows
the
strain
map
at
all.
B
Strain
map
is
not
a
trajectories.
It's
the
it's
a
map.
You
take
a
pair
of
cells,
yeah
the
two
cells
over
time,
so
the
strain
is
the
ratio
of
the
distance
apart
between
them
at
different
times,
so,
okay.
In
the
meantime,
there
might
be
a
way
of
going
across
the
emerald,
perhaps
between
the
two
cells.
If
you
choose
the
two
cells
that
way.
B
C
C
C
C
A
B
A
B
Yeah
parenthesis
temperature.
What
kind
of
time
sorry
parting,
the
left,
paren
small
teeth!
That's
it
yeah!
Okay!
So
now
D
of
T
is
the
strain
between
those
two
cells.
Oh,
okay.
Okay,
that's
the
definition
of
strain
and
strain
is
much
easier
to
measure
than
Force,
because
you
can
just
Vision.
You
can
just
visualize
it
it's!
The
The
Strain
is
actually
D
of
T,
divided
by
D
of
t
zero,
yeah
right,
yeah
yeah.
So
it's
D
of
T,
divided
by
D
of
T
Sub
Zero,.
B
That's
it!
That's
you,
that's
the
definition
of
strength,
okay,
okay,
so
you
can
make
this.
So
if
you
take
take
different
pairs
of
cells,
you
can
make
a
strain
map
over
the
whole
surface.
Now
you
might
locate
it
at
the
center
between
the
two
cells
in
the
middle
of
that
Arc,
okay,
and
that
would
be.
That
would
be
that's
where
you
put
the
value
of
D
of
T
over
D
of
t
zero.
C
C
A
A
C
B
C
B
B
B
B
C
C
C
I,
don't
know
if
I
have
this.
Oh
I
probably
didn't
bring
it
with
me,
but
I
was
watching
a
video
and
someone
was
presenting
on
some
of
the
work
they
were
doing
in
embryos
and
they
came
up
with
this
method
and
it
wasn't
a
spherical
map.
It
was
like
a
a
curved
map
that
they
had
built
and
I
can't
remember
when
I
have
the
reference
and
I
didn't
bring
it
to
the
meeting
I
wish
I
had
because
it
was
pretty
interesting.
C
C
A
C
Is
kind
of
reminiscent
of
the
the
spherical
mapping,
but
it
wasn't
a
sphere.
It
didn't
have
that
property.
It
was
just
kind
of
like
microscopy
images
taken
you
know
and
and
then
they
stitched
it
together,
like
that
I
wish
I
had
yeah.
There
was
a
paper
where
someone
did
this
it's
about
10
years,
maybe
about
five
years
ago.
I
think
wait.
C
Well,
they
do
have
like
3D,
video
or
360
degree.
Video
now
well,
they've
had
that
for
a
while,
but
like
yeah,
you
can
take
see
panoramic
scenes
and
you
Stitch
the
images
together
so
you're
actually
standing
in
the
center
of
the
like
the
reference
frame
and
you've
just
taken
pictures
of
everything
around
you.
C
C
C
B
C
B
The
general
notion
is
that
they
occur
with
that
they're
either
Turing
patterns,
the
the
Turing
pattern,
so
I
have
a
diffusion
reaction,
great
difference,
but
nobody's
ever
attended,
I,
don't
think
anyone's
ever
tested.
That
I
criticized
some
work
like
that
on
I
think
there
was
some
kind
of
angel
angel,
Marine
angelfish,
where
the
patterns
changed
as
the
fish
matured.
C
B
C
B
C
A
B
B
C
C
B
C
B
C
C
C
So
let
me
see
I
do
get
what
I
do
have
here
in
terms
of
things.
They
have
a
couple
of
different
papers
that
oh
actually
I,
think
this
was
the
one
I
was
thinking
of.
I
didn't
have
a
a
folder
for
it,
but
this
is
the
paper.
I
was
actually
talking
about.
So
this
is
scientific
reports.
This
is
from
2015.,
so
it
wasn't
that
long
ago
it's
actually
been
seven
years.
Time
flies,
but
this
is
a
an
ensemble
average
cell
density
based
Digital
model
of
zephyrfish.
Okay.
C
C
It
could
be
yeah,
they
could
be
averaging
over
like
multiple
scenes
or
sets
of
images
and
I'm,
not
sure
yeah.
So
this
is
this
is
from
white
sheet
microscopy,
which
we've
talked
about.
It
just
gives
you
really
high
resolution
microscopy
images,
they're
sort
of
this
bright
field,
as
opposed
to
like
a
fluorescent
image
or
some
some
other
type
of
image
yeah.
C
So
this
is
the
abstract.
A
new
area
in
developmental
biology
has
been
ushered.
In
my
recent
advances
in
imaging
here
we
have
developed
a
light
sheet,
fluorescence
microscopy-based
framework,
so
actually
this
is
fluorescence
microscopy
from
a
light
sheet,
Source
with
single
cell
resolution
or
identification
and
characterization
of
subtle
phenotypic
skate,
phenotypic
changes
of
millimeter
sized
organisms.
So
you
know
this
is
like
inside
or
the
morphology
of
the
zebrafish.
C
B
C
C
C
Yeah,
yes,
like
the
a
lot
of
the
C
elegans
data,
sets
that
we've
worked
with.
You
know,
come
from
about
300
different
worms
like
they'll,
take
images
of
them
and
then
average
them
across
the
different
worms
and
because
zebrafish
exhibit
a
bit
more
variation
than
C
elegans.
You
have
to
have
like
or
sophisticated
techniques
for
averaging
across
different
specimens,
so
but
they
they
claim
that
to
get
this
sample
to
get
a
handle
on
the
sample,
the
sample
variation.
B
C
C
B
B
C
B
C
B
C
So
yeah,
then
the
Digital
model
may
serve
as
a
canvas
in
which
the
behavior
of
cellular
subpopulations
can
be
studied.
So
they'd
give
one
example
where
they
investigate
cellular
rearrangements
during
germ
layer
formation
at
the
onset
of
gastrulation
and
then
having
this
because
they're
using
the
fluorescence
images.
They
can
actually
look
at
gene
expression
and
they
look
at
one
hot
one-eyed,
Pinhead
mutants,
so
they
look
for
the
expression,
one-eyed,
Pinhead
and
they
they
have
mutants
of
that
type
of
mutation.
So
usually
those
phenotypes
are
usually
they're
fully
penetrate.
C
So
within
the
Digital
model
of
the
wild
tape,
embryo
reveals
its
abnormal
development
at
the
onset
of
gastrulation
many
hours
before
changes
are
obvious
to
the
eye,
so
they're
actually
able
to
look
at,
like
the
expression
of
this
Gene
and
some
of
the
other
features
of
the
cells,
to
look
at
some
of
the
changes
that
occur
before
you
can
actually
see
changes
in
the
phenotype
with
the
naked
eye.
So
this
is
a
an
interesting
pip.
C
The
reason
I
brought
it
up
is
because
they
actually
build
this
model,
this
Digital
model
and
then
this
type
of
visualization.
So
this
is
a
zebrafish
embryo,
of
course.
Zebrafish
embryos
are
unique
in
that
very
early
early
in
development.
They
have
this
pole
at
the
top,
where
you
see
the
cells
and
then
they
migrate
downwards,
and
this
this
end
is
vegetal.
There
isn't
really
much
going
on
down
here
a
little
later
in
development,
it
fills
out
and
it
starts
to
elongate
and
that's
what
these
images
are
down
here.
C
So
this
is
this
is
the
Yoke
down
here,
and
this
is
the
top
sort
of
developing
from
top
to
bottom
and
then
so
that
to
reveal
normal
zebra
fish
morphogenesis
during
the
first
16
hours,
we've
imaged
an
ensemble
of
embryos
with
fluorescently,
the
labeled
nuclei,
which
are
the
cells
it
label.
You
know
in
in
the
nucleus,
you
see
these
spots,
which
represent
the
cells
and
then,
if
you
have
different
things
that
you
label
within
those
nuclei,
you
can
actually
identify
what.
C
Well,
it
looks
like
the
it's
it's
kind
of
they
have
these
nuclei,
They
Don't
Really
image,
the
boundary
like
they
don't
put
a
marker
in
the
membrane
or
in
the
at
the
at
the
edge
of
the
membrane.
I
mean
I
know
some
people
have
done
this
in
studies,
but
yeah
they
don't
they're,
not
really,
marking
those
boundaries.
C
C
C
There
we
go.
This
is
the
animal
pole,
vegetable,
so
they
have
the
orientation
of
what's
going
on
here,
ventral
dorsal.
Then
they
have
this
three-dimensional
model
and
they
map
this
sort
of
to
a
spherical
model.
Like
this
top
view
side
view,
so
they
actually
show
these
things.
They
show
the
embryo
position
and
the
coordinate
system
that
they're
using.
Then
they
stretch
it
out.
Actually
it's
interesting:
they
don't
build
a
spherical
model.
They
take.
C
C
C
C
So
you
can
actually
visualize
it
like
this,
so
you
can
look
at
comparisons
between
the
AP
versus
the
VP
here,
animal
versus
vegetable
pull,
so
you
have
things
being
expressed
here
that
aren't
expressed
here.
You
have
things
that
are
patterns
that
are
emerging
in
the
vegetable,
but
not
in
the
animal
pole,
and
then
this
is
the
equatorial
region
here,
which
is
along
this
edge
here
on
the
sphere.
So.
C
Think
these
are
the
markers
that
they're
using
so
e,
is
actually
2D.
Maps
of
integrated
cell
nuclei
identity,
actually
they're
using
a
I
think
they're,
actually
using
a
different
they're,
not
using
a
motivator
projection
here,
they're
using
gulp
heaters
projection,
so
I
don't
know
they're
they're.
You
know
using
different
types
of
projections
for
this,
but
this
this
is
supposed
to
be
cell
density
here
this
map,
and
then
D
is
so.
C
C
B
C
Building
these
little
these
Maps
based
on
different
Transformations
different
projections.
This
actually
shows
then,
over
time
you
go
from
6
to
16
hours.
So
you
can
see
these
different
changes
from
animal
to
vegetable
oil.
So
you
know
that's
in
zebrafish
embryogenesis,
that's
an
important
distinction
between
those
two
poles
where
you
get
like
everything
going
on
the
animal
pole
and
then
things
happening
in
The
ventricle
poll
over
time.
You
can
see
this
on.
C
That
many,
but
it's
more
than
say
like
C
elegans,
but
yeah.
You
don't
have
that
many
cells
that
early
in
zebrafish
develop
okay,
and
so
this
is
their
Ensemble
of
an
average
Digital
model.
I
think
the
take
home
here
is
that
they're
building
these
flat
Maps
they're
using
a
projection
they're
taking
like
basically
Imaging
I,
think
they're
in
a
genius
sphere,
they're,
not
making
a
sphere
or
treating
the
the
surface
as
like
a
thing
that
you
can
explore:
spherically
they're,
actually
building
these
flat
Maps
up
and
show
these
distinctions,
yeah.
B
C
C
Yeah
they
should
be,
it
should
be
possible
to
do
it.
I
mean
I,
think
there's
a
data
set
from
the
Keller
Lab
at
Genelia
and
they've
done
a
lot
of
work
with
zebrafish,
embryo
modeling
or
they've.
Actually,
you
know
have
the
3D
data
set
where
you
have
a
three-dimensional
coordinate
for
each
cell
at
different
times,
and
so
I
mean
that
that
can
be
done.
C
It's
just
a
matter
of
you
know.
You
know
I,
think
you
have
to
do
some
work
on
like
making
it
into
a
spherical
model.
It's
not
as
simple
as
this,
because
it's
just
the
nucleus
or
the
centroid
of
the
cell,
so
they
just
put
a
marker
in
the
nucleus
or
the
centroid,
and
they
and
you
just
pick
that
up
with.
C
Yeah
yeah
and
then
there's
some
issue
with
like
if
you're
trying
to
track
individual
cells
like
in
zebrafish,
you
can't
really
track,
or
at
least
the
way
the
data
sets
are
constructed.
You
can't
really
track
individual
cells.
You
can
track
like
the
cells
that
exist
at
a
certain
time,
so
it
would
be
a
little
difficult
to.
B
Okay,
yeah
one
thing:
let
me
point
out:
I
played
around
with
an
idea
a
long
time
ago,
trying
to
represent
three
dimensions:
I
think
it
was
on
a
storage,
tube
terminal.
Okay,
if
you
can
remember
those
schedules,
you
could
drop
once
and
then
erase
the
whole
thing.
Oh
okay,
so
what
I
did
is
I,
took
a
closed
pattern
representing
density
in
three
dimensions
and
made
two
different
views
of
it,
separated
by
about
six
degrees
and
then
get
it
as
a
stereo
pair.
C
B
B
C
So
so
what
they
call
Ana
glyphs,
which
you
can
make,
there's
a
software.
You
can
make
them
where
you
take
two
images
and
you
overlay
them.
You
have
to
have
like
a
transparency
overlay
them.
By
about
that
many
degrees.
You
can
play
with
the
degrees
of
separation,
and
it
gives
actually
it's
interesting
because
it
gives
you
different
perspectives
on
it,
like
you
can
get
a
little
bit
more
depth
or
a
little
bit
less
depth.
B
C
Now
I'd
like
to
talk
about
something
called
The
Hourglass
model,
that's
something
we've
talked
about
in
past
meetings
and
it's
actually
not
relevant
to
zebrafish
or
to
see
elegans,
but
we're
going
to
be
talking
about
different
types
of
vertebrate
embryos,
and
so
this
is
a
paper
that
came
out
a
comparative
study
of
The
Hourglass
model
of
development
in
these
different
organisms.
So
to
Briefly
summarize
what
The
Hourglass
model
is.
Okay,
you
know,
if
you
can
imagine
the
developmental
trajectory
going
in
this
direction,
so
we'll
call
it
developmental
time
down.
C
C
C
Things
even
out
across
different
types
of
embryos,
so
you
actually
have
the
famous
pictures
of
embryos
where
you
see
them
and
you
can't
tell
whether
they're
a
horse
or
a
human
or
a
chicken.
So
this
is
the
reason
they
call
it.
Phylotypic
is
because
it's
typical
across
phyla,
so
at
that
point
the
embryo
is
very
similar
across
different
phyla
and
then,
after
that
point,
you
go
back
to
having
observing
a
lot
of
variation
and
indeed
observing
the
different
forms
that
take
the
shape
of
the
different
phyla
of
vertebrate
embryos.
C
C
About-
and
this
is
a
very
common
model
in
Evo
Devo,
if
you're
familiar
with
EVO
Devo-
this
is
something
that
is
sort
of
the
underpinning
of
evil.
Devo
is
that
you
have
this
phylotypic
stage
where
there's
the
similarity
across
taxa
or
across
phylum,
and
then
there's
a
Divergence
and
developmental
change
will
occur
here
in
this
phylotypic
stage
to
change
the
trajectory
of
these
different
embryos.
But,
of
course,
there's
a
lot
of
variation
happening
before
the
phylotypic
stage,
but
that's
not
in
in
the
form
itself.
C
So
this
is
actually
where
you
get
within
the
same
phylum,
which
in
this
case
is
is
vertebrates.
Yet
the
molecular
mechanism
is
underlying
this
phenomena
and
mammals
remains
poorly
described,
so
everything
I
was
showing
you
there
talks
about
sort
of
these
changes.
Molecular
changes
at
the
below
the
sort
of
the
constriction
of
The
Hourglass
morphological
changes
above
it
and
then,
in
that
middle
section
you
get
a
convergence
here.
We
compare
rabbit
and
mouse
time
resolve
differentiation
trajectories
to
revisit
this
model
at
single
cell
resolution.
C
So
a
lot
of
the
this
model
has
been
largely
considered
to
be
a
theoretical
model.
You
can
observe
it
in
different
data
sets.
But
what
we're
doing
they're
trying
to
do
here
is
trying
to
build,
bring
it
down
to
single
cell
resolution
and
understand
how
these
changes
occur.
At
the
Single
Cell
level,
we
modeled
gastrulation
Dynamics
using
hundreds
of
embryos
sampled
between
gestation
days
6.0
to
8.5.
C
C
We
find
convergence
towards
similar
cell
State
compositions
at
e
7.5
underlying
by
underlied
by
quantitatively
conserved
expression
of
76
transcription
factors,
despite
Divergence
and
surrounding
trophoblast
and
Hyper
hypoblast
signaling.
So
this
is
signaling
Within
These
tissues
that
are
not
organs.
They're,
not
you
know.
Different
regions
of
the
body,
there's
still
kind
of
regions
of
the
embryo,
so
trophoblast
and
hypoblast
are
different
regions
and
you
get
signaling
within
those
areas
that
are
starting
to
diverge
as
you're
starting
to
get
differentiation
of
those
tissue
layers
into
other
types
of
structures.
C
However,
we
observe
noticeable
changes
in
specification
timing
of
some
lineages
and
Divergence
of
primordial
germ
cell
programs,
which
which,
in
the
rabbit,
do
not
activate
mesoderm
genes.
So
this
is
of
the
Single
Cell
level,
so
you're
starting
to
get
different
programs
in
different
cells.
Yes,
those
cells
are
part
of
differentiated
tissues.
Those
cells
differentiate
in
terms
of
their
fate.
You
get
these
programs
as
they
put
it,
that
change
their
function
and
diverge
from
one
another.
C
Look
in
the
rabbit
do
not
activate
mesoderm
genes,
so
this
is
like
something
that,
in
the
rabbit,
you
see
a
difference
from
what
you
see
in
the
mouse
comparative
analysis
of
temporal
differentiation.
Models
provides
a
new
basis
for
studying
the
evolution
of
gastrulation
Dynamics
across
mammals,
so
they
talk
about
early
mammalian
development.
Following
this
generally
conserved
sequence
of
events,
you
get
this
evolutionary
hourglass
effect.
Process
of
gastrulation
involves
the
formation
of
the
embryonic
germ
layers
from
Polar
potent
epublast
and
laying
out
the
basic
embryonic
axes.
There's
this
process.
C
That
happens,
that's
very,
very
much
conserved
across
different
embryos.
You
get
this
this
basic
induction
of
shape
and
you
get
this
basic
induction
of
different
differentiation
of
different
types
of
cells
into
different
germ
layers
and
then
ended
beginnings
of
starting
to
sort
into
different
tissues.
C
This
critical
stage
of
development
has
been
mainly
characterized
in
the
mouse
model
in
which
the
developing
blastocyst
takes
on
the
form
of
a
cup
shape
or
egg
cylinder,
and
so
this
is
our
our
process
here.
Guest
relation
we're
getting
this
change
in
shape.
It's
it's
becoming
sort
of
you
know.
Instead
of
having
a
sphere
you
have
or
an
oblong
sphere,
you
start
to
have
a
distinct
shape,
that's
sort
of
the
formation
for
the
rest
of
the
morphology.
C
The
mouse
gastro
is,
however,
highly
distinctive,
invertebrates,
as
most
mammals
being
in
gastrulation
as
a
planar
embryonic
disc,
so
the
process
of
gastrulation
amounts
is
quite
different
than
the
rest
of
of
vertebrates.
For
whatever
reason,
and
so
it's
you
know,
we
built
this
theoretical
model
on
a
Model
organism
that
is
atypical.
C
So
that's
another
Point
here
such
gross
structural
disparities,
expected
to
have
dramatic
effects
on
gastrulation
by
shaping
cellular
mechanics
and
spatiotemporal
interactions,
and
so
these
things
can
vary
early
on
before
we
go
through
this
hourglass
after
The
Hourglass,
there
is
Divergence,
but
it's
more
about
species,
specific
differences.
Of
course.
In
this
case,
we
have
a
very
similar,
very
fundamental
species-specific
difference.
So
that's
an
interesting
point.
This
is
why
they're
doing
this
comparative
study.
C
Moreover,
wide
variation
has
been
observed
between
species
in
relation
to
implantation
strategies,
which
is
where
the
embryo
implants
itself
into
the
wall.
The
uterus
is,
you
know
in
in
the
cases
here
that
they're
looking
at
they're
talking
about
live
birth
organisms,
so
this
in
the
development
and
orientation
of
the
extra
embryonic
tissues.
So
this
is
something
that
we're
also
interested
in
in
terms
of
the
variation
not
exhibits.
This
is
early
on
in
development
before
gastrulation,
with
respect
to
implantation,
and
this
is
where
this
variation
at
the
bottom
of
the
hourglass.
C
The
rabbit
stands
out
among
possible
alternative
mammalian
models
by
presenting
many
of
the
advantages
of
the
mouse,
namely
the
short,
relatively
short
gestation
and
larger
liters.
That
can
be
accurately
timed,
so
you
want
to
pick
an
organism,
that's
very
similar
to
the
mouse,
but
it's
different
from
the
mouse,
and
so
the
rabbit
is
this
candidate.
C
The
rabbit
also
is
more
closely
resembling
of
human
development,
in
particular
with
respect
to
the
specification
of
primordial
germ
cells,
and
so
this
is
again
sort
of
justifying
this
comparison,
and
so
they
use
single
cell
transcriptomics.
For
this,
where
they're
able
to
map
a
lot
of
these
single
cell
changes
between
different
types
of
cells
and
look
across
these
different
species
and
see
what
kinds
of
transcription
changes
transcriptional
changes
occur
and
are
different
between
this
results
in
comprehensive.
C
It's
a
result
in
a
comprehensive
Atlas
that
greatly
enriches
and
refines
previously,
a
previous
Imaging
based
data
by
characterizing,
precise
transcription
programs
at
high
cellular
resolution.
So
with
a
single
cell
transcriptomics,
they
can
be
mapped
to
single
cells.
So
you
can
actually
take
an
atlas.
An
anatomical
Atlas,
look
at
the
cell
and
then
have
the
transcriptomic
profile
that
you
can
lay
over
those
cells,
and
you
can
actually
look
now
in
between
species,
but
between
cells
and
see
what
kind
of
variation
is
being
generated
there.
C
So
then
they
they
merge.
These
inferred
cell
states
that
are
gotten
from
a
transcriptomics
data
into
a
manifold
model,
which
is
something
that
they
introduce
in
the
paper.
It
facilitates
the
inference
of
cellular
differentiation
Dynamics
using
computational
tools
that
search
for
parsimonious
differentiation
trajectories.
So
these
are
these
different
trajectories
that
I
was
talking
about
early
on.
These
are
largely
transcriptomic,
and
but
we
want
to
be
able
to
characterize
these
in
single
cells
and
then
across
species,
so
see
if
we
have
any
juicy
parts
to
this
paper
that
are
particularly
interesting.
C
So
a
manifold
alignment
uncovers
highly
conserved
gas
relation
States
in
rabbit
and
mouse.
So
they've
created
this
manifold
construct,
then
they're
able
to
examine
the
differences
between
rabbit
and
mouse,
and
they
find
that
there's
this
highly
conserved
set
of
gastric
relation
States
between
the
two
organisms,
so
given
fully
time,
resolved
Mana
flow
and
flow
models
for
rabbit
and
mouse
gastrulation.
C
We
wish
to
define
a
framework
for
the
principal
comparison,
so
basically
so
figure
supplemental
for
A
and
B,
which
I'm
not
sure
we
have
the
supplemental
materials
in
here,
but
basically
you're
taking
these
manifolds
and
you're,
comparing
them
and
that's
that
serves
as
a
comparison
for
development
or
gastrulation
in
the
two
organisms
and
they
found
that
there's.
Actually,
this
a
similarity
between
all
meta
cells
and
the
two
manifolds
identifying
79,
reciprocally
best
orthologous
meta
cell
pairs.
So
these
meta
cells
are
the
cell.
C
The
anatomical
cells
with
the
transcriptional
data,
and
then
notably,
the
identification
of
such
States,
is
a
high,
is
a
highly
True
non-trivial
Result,
showing
that
the
two
manifolds
are
indeed
alignable
over
a
very
rich
collection
of
transcriptional
States.
So
again,
you
can
make
this
these
these
similarities
across.
So
a
lot
of
times,
transcriptional,
States
or
transcriptional
sites,
I
guess
the
activity
of
different
transcripts
will
vary
and
it's
very
hard
to
interpret.
You
know
how
similar
or
different
they
are.
C
So
they
basically
have
this
network
flow
model,
attracts
rabbit,
gastroplation,
Dynamics
in
absolute
time
to
infer
differentiation
model
from
the
single
cell
and
the
single
embryo
rabbit
data
set.
We
use
an
improved
version
of
our
Network
flows,
algorithm,
which
was
initially
demonstrated
in
the
mouse.
This
is
a
citation
14,
which
is,
you
know,
have
a
link
to
the
citation,
but
so
this
is
in
the
method
section
which
we
don't
I,
don't
know.
If
we
have
access
to
in
this
mean
paper,
you.
C
Later,
if
you're
interested
the
algorithm
result,
differentiation
flows
for
meta
cells,
distributed
over
the
12
time,
bins,
balancing
similarities
between
expression,
States
and
estimation
of
cell
proliferation
rates.
So
this
is
something
that
we
get
in
this
differentiation
flow.
The
latter
was
performed
by
Computing
co-expression
of
S
phase
and
m-phase-related
genes,
and
quantifying
a
distinctive
non-proliferating
cell
subpopulation,
so
they're
able
to
actually
build
this
from
this
network
flow
model.
C
You
can
use
that
to
calibrate
growth
rates
and
different
aspects
of
this
flow,
which
is
the
flow
of
I,
guess,
cell
migration
and
and
cell
division
they're.
You
know
they're
treating
it
as
a
flow,
a
network
flow
and
so
yeah.
This
just
kind
of
goes
over
how
they
applied
this
technique
to
the
different
embryos
and
some
of
the
variation
in
the
embryos
that
you
have
to
deal
with
in
this
modeling
exercise
redefining
rabbit
embryonic
stages
by
integrating
morphology
and
transcriptional
Analysis.
C
This
is
where
we're
kind
of
building
this
model,
so
this
network
flow
model
really
derives
from
so
to
describe
rabbit
gastrulation
on
an
absolute
temporal
axis.
We
perform
morphology-based
ranking
of
the
embryos
and
ranking
by
K
and
N
similarities
of
single
cell
profiles,
so
this
is
where
you're
getting
both
morphology-based
ranking
of
embryos
and
a
ranking
of
the
Single
Cell
transcriptional
profiles
and
you're
trying
to
fit
them
together
into
these
measures.
So
this
is
again
like
this
is
just
kind
of
referencing
the
methods
a
lot.
C
C
Actually
would
be
interesting,
but
this
when
you
align
the
rabbit
and
mouse
gastric
relation
time
axes.
It
highlights
this
our
last
like
bottleneck,
and
so
this
is
this
bottleneck
that
I
showed
in
this
image
here.
This
is
considered
to
be
the
phylotypic
stage
and
again,
this
bottleneck
is
where
everything
kind
of
converges
for
a
while
in
development
and
and
aligns,
and
then
you
get
this
more
extensive
phenotypic
variation
instead
of
molecular
variation
down
the
bottom
of
this.
C
So
following
alignment
of
the
rapid
and
Moss
gas
relation
manifolds,
we
next
saw
the
principled
strategy
for
comparing
the
true
differentiation
processes
as
represented
by
our
models.
So
we
want
to
understand
this
larger
process
rather
than
some
of
the
differences.
You
know
trivial
differences
between
the
organisms
or
between
different
cells.
C
We
therefore
tested
whether
the
independently
determined
rabbit
and
mouse
gastrulation
clocks
could
be
aligned
over
a
common
time
axis,
so
they
have
we're.
Looking
at
these
time,
courses
we're
looking
at
things
going
on
in
the
growth
different
growth
rates
and
they're,
not
you
know,
rabbit
and
mouse
gastrulation,
don't
exactly
operate
according
to
the
same
sort
of
tempo
as
it
were.
So
you
have
to
align
them
over
a
common
time.
Access
to
the
limiting
potential
cell
type
annotation
bias.
We
get.
C
We
generate
a
unified
representation
of
rabbit
miles
cell
State
distributions
and
in
this
manner,
computed
cross-species
embryos,
cell
State
frequency
similarities
over
time,
so
they're
actually
taking
the
two
assets
and
this
guest
relation
process,
they're
kind
of
merging
it
into
a
single
time
frame.
So
you
know
Mouse
and
rabbit.
You
can
make
a
direct
comparison
between
what's
going
on
at
different
time
points
and
all
organisms
have
this
difference
in
the
sort
of
the
way
that
development
unfolds.
Sometimes
it's
faster,
sometimes
it's
slower.
Sometimes
this
is
due
to
the
rate
of
cell
division.
C
C
So
this
the
resulting
similarity
Matrix
that
they
build
from
these
cell
State
frequency
similarities,
reveals
a
stereotypical
structure
which
pre-gast
relation
States
are
aligned,
but
not
synchronized,
so
they're
aligned
they're,
not
necessarily
synchronized,
because
it
would
be
rather
hard
to
do
rather
they're
aligned.
So
if
they're
doing
an
alignment
procedure
here,
this
leads
towards
a
bottleneck
at
approximately
7.5
or
what
they
call
E
7.5,
which
is
basically
days
after
fertilization
in
both
species,
followed
by
a
more
synchronized
gas
relation
process
with
potential
gradual
loss
of
coherence.
C
So
you
have
this
initial
gastrulation
process
which
actually
there's
a
bottleneck
here
you
know
pre-gast
relation
states
that
are
aligned,
but
not
synchronized.
You
have
this
bottleneck
at
7.5
days
and
Then,
followed
by
a
more
synchronized
gastrulation
process.
So
this
is
this
phylotypics
stage
with
potential
gradual
loss
of
coherence.
So
that's
when
you
move
up
into
the
top
of
this
hourglass
and
towards
adulthood
or
some
juvenile
State,
that's
not
in
the
in
utero
right.
C
This
analysis
shows
that
overall,
we
can
use
the
absolute
time
axis
of
the
two
species
for
comparing
the
gastrulation
processes.
It
also
clearly
demonstrates
Divergence
and
compensation
in
some
key
stages,
particularly
highlighting
the
early
and
more
gradual
emergence
of
PS
populations
in
the
mouse.
These
are
cell
population.
Well,
remarkably,
although
the
rabbit
PS
emerges
later,
I
think
converges
to
embryonic
frequencies
that
closely
match
those
observed
in
Mouse
okay.
So
this
is.
C
C
One
here
this
is
very
complex
now
this
shows
the
cell
type
fraction
here
over
the
different
days.
So
this
is
a
cell
type
in
the
embryo.
These
are
the
Soma.
Is
the
map
of
the
somites,
and
this
kind
of
tells
you
what's
going
on
here,
so
you
have
down
below
you:
have
the
AP
symmetry
break
posterior
gastro
extension
constricted
PS,
Define
node,
robust
endodermin,
ectoderm
notochordal
plate
prominent
head
folds
cuddle
up
at
last,
cellular
diversification
so
might
stages
embryo
elongation,
cardiac
Crescent
neural
tube.
C
So
you
can
see
that
this
is
the
time
here
from
day
six
to
day
0.6.
You
have
these
different
events
going
on
here
you
have
cell
mites
the
number
of
somites,
and
then
you
have
this
cell
type
fraction,
meaning
that
you
have
you
start
with
this
gray
or
just
Brown
foreign,
which
is
up
a
blast.
So
all
the
cells
are
up
to
blast
at
day
six
and
they
become
more
diverse
over
time.
It's
actually
burning
7.7
days
onward
that
you
get
a
lot
more
variation
all
of
a
sudden.
C
So
this
is
where
you're
kind
of
this
is
maybe
like
the
the
phylotypic
stage
in
here,
and
then
we
pop
out
of
that
and
we
end
up
diversifying.
So
this
is
an
interesting
sort
of
map
where
it
shows
this
variation
over
time.
This
is
their
flow
map,
their
flow
Network,
where
they
show
the
different
cells
and
the
cell
types.
So
this
is
a
network
of
those
and
then
you
can
see
the
microscopy
image
of
the
embryo
where
they
show
how
the
embryo
is
changing,
shape
and
differentiating
over
the
same
time
period.
C
That's
figure,
one
figure
two
actually
shows
it
looks
like
expression
Matrix,
where
you
have
these
expression
levels
over
that
same
time,
period,
six
days
to
eight
point
six
days
and
then
mapping
it
to
this
heat
map,
which
was
a
relative
expression
of
different
actual
genes
genes
that
are
important
in
development.
So
you
can
have
you
have
this
map
of
Gene
level,
gene
expression
level
over
time
and
it
maps
that
this
expression
Matrix?
C
So
that's
a
wrote
from
sort
of
the
level
to
the
relative
expression.
This
figure
three
just
shows
like
different
cell
types.
Again,
it
shows
an
expression.
Matrix
but
then
it
shows
sort
of
like
what
cells
are
being
expressed
at
what
time
and
development
so
PGC
is,
has
a
low
correlation
with
I
think
there.
C
This
is
actually
within
the
cell
types,
what
their
correlation
is,
and
you
can
see
that
the
higher
correlation
is
for
some
of
these
neural
in
some
of
these
neural
cells
or
cells
in
these
structures,
here
or
or
actually
it's
the
genes
that
are
associated
I.
Think
with
some
of
these
functions
that
are
more
highly
correlated.
C
So
PGC
is
a
little
low
correlation
relatively
speaking,
and
then
some
of
these
other
more
specialized
cells
for
the
neural
tube
and
the
foregrain
and
the
cut
on
the
octoderm
rustal
neurectoderm,
those
things
are
were
highly
correlated.
So
it's
an
interesting
plot.
The
thing
about
gene
expression
profiles
is
that
they're
very
hard
to
interpret,
even
in
context,
it's
really
hard
to
say
like
what
this
means.
C
C
And
then
I
don't
know
if
this
is
the
rest
of
this
isn't
necessarily
that
interesting.
It
just
shows
a
lot
of
this
perfect
concept
for
some
of
the
gene
expression
profiles
across
this
developmental
time
window.
So
from
six
days,
8.25
days,
you
get
these
different
trends
and
they're
different
from
rabbit
and
mouse,
but
this
is
it'd
be
expected.
Some
of
these
cross
species
comparisons
again
are
pretty
hard
to
make.
You
have
to
make
a
lot
of
assumptions
about.
C
You
know
how
to
normalize
the
data,
and
then
you
can
actually
look
across,
but
but
the
benefit
is
you
get
a
window
into
some
of
this
variation?
So
you
know
you
can
do
it
really
interesting
Studies
by
looking
across
different
species
and
getting
a
sense
of
you
know
what
kinds
of
things
they
have
in
common.
What
kinds
of
things
are
different
and
then
you
can
say
things
you
can
appeal
to
a
theoretical
model
like
The
Hourglass
model,
to
interpret
your
result.