►
From YouTube: DevoWorm (2020, Meeting 42): Input Data, Physics of Cell Temporality, Computational Bio Education
Description
An update to the DevoWormML lecture on Input Data, "Periodicity in the Embryo" manuscript, paper on the Physics of Cell Aggregates, and Computational Biology Education. Attendees: Susan Crawford-Young, Krishna Katyal, Mayukh Deb, Mainak Deb, Jesse Parent, Debojyoti Chakraborty, and Bradly Alicea.
A
A
B
A
A
A
B
A
A
A
A
This
one's
on
input
data,
and
so
we
had
last
week,
was
the
nurbs
conference,
so
people
who
are
interested
in
machine
learning
and
other
things
like
that.
That
was
a
major
conference
in
that
field.
So
we
had
a
discussion.
I
had
a
discussion
with
jesse
parent
on
saturday
about
recapping
what
was
going
on
at
that
conference.
So
it
was
a
pretty
long
discussion.
If
you're
interested,
I
can
send
you
a
link
to
those
materials,
but
the
input
data.
I
think
it'll
be
interesting.
Both
the
machine
learning
people
and
people.
A
You
know
doing
empirical
science
as
well
like
collecting
data,
because
it
does
give
like
a
broader
view
of
data
analysis
and
and
things
like
that,
the
periodicity
of
the
embryo
paper,
that's
something
that
I
am
working
on,
trying
to
get
out
by
the
end
of
the
year.
I'm
gonna
look
we're
gonna,
look
at
that
briefly,
and
then
they
have
some
papers
that
we'll
talk
about.
A
Okay,
so
this
is
the
input
data
lecture
here,
and
so
this
was
something
that
again
was
presented
first
in
2019
and
now
we're
updating
it.
So
this
is
input
data
or
the
idea
of
what
comes
what
go.
What
comes
out?
What
goes
in
so
you
know
you've
heard
of
the
expression
garbage
in
garbage
out
and
that's
you
know
if
your
data
is
bad,
your
model
output
will
be
bad
as
well.
That
applies
to
statistics
as
well
as
machine
learning.
A
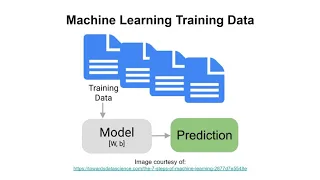
This
is
a
picture
of
a
system
where
you
have
data
flowing
between
variables,
and
then
I've
stated
this
is
a
bayesian
proposition.
If
you
didn't
catch
that
reference,
so
this
is,
I
updated
the
devo
zoo
part.
The
first
part
I
would
mention
would
be
that
we
have
a
reference
for
input
data
for
our
models.
It's
called
devozu,
and
this
is
something
that
usually
has
worked
on
last
year
to
update
and
I've
worked
on
it
with
them,
and
we've
made
the
input
data
that
we
have
in
our
group
more
accessible
to
collaborators.
A
F
F
F
A
Over
I
had
it,
it
was
about
the
second
slide,
so
that's,
okay.
So
to
recap
this
is
input
data.
This
is
the
idea
of
you
know
you
have
to
put
in
good
data
to
get
a
good
result
out
of
your
model.
This
holds
true
for
statistics
as
well
as
machine
learning
or
any
other
deep
learning,
any
other
kind
of
model
you
want
to
build,
and
so
we
have.
A
This
is
an
update
that
something
we
had
a
course
in
2019
called
diva
warm
ml
and
I'm
updating
these
lectures.
So
this
is
where
this
is
coming
from,
so
we
have
this
resource
called
devozu
again.
This
is
where
you
have
a
bunch
of
data,
sets
that
we've
curated
from
different
sources,
a
lot
of
cell
tracking
data,
a
lot
of
like
lineage
tree
data
and
differentiation
tree
data
and
gene
expression
data.
A
But
there
are
a
lot
of
instances
of
open
biological
data.
There
are
a
lot
of
sources
imagej,
for
example,
as
a
series
of
public
data
sets
that
you
can
download.
These
are
data
sets
that
have
been
captured
through
microscopy
techniques,
various
microscopy
techniques.
So
they
have.
You
know
bright
field
microscopy.
A
You
know,
antibody
stains,
fluorescent
images,
so
you
can
get
all
sorts
of
images
to
do
a
lot
of
processing
and
post
processing
on
them.
So
you
know
they
have
data,
sets
that
are
raw
data
sets
of
numbers.
They
have
data
sets
with
images,
and
I
think
in
these
meetings
that
you've
seen
a
variety
of
that
kind
of
data.
And
of
course
you
know
it's,
you
know
you
might
use
raw
image
data
for
one
thing:
raw
numeric
data
for
another
thing
and
combine
them-
I'm
not
going
to
get
too
much
into
that
process.
A
But
I'm
going
to
talk
a
little
bit
about
how
you
know
some
of
the
caveats
to
watch
out,
for
there
are
also
data
sets
like
the
avian
vocalization
data
set
here
that
I'm
highlighting
this
is
someone's
work
that
they
put
up
on
on
kegel.
So
it's
a
kegel
data
set
and
it's
just
avian
vocalizations
from
california
and
nevada.
A
A
So
if
you
have
a
bunch
of
microscopy
images,
for
example,
is
it
quantifiable?
Can
I
turn
these
images
into
numbers
and
can
I
do
it
reliably
and
the
other
criterion
is?
Is
it
enough
data?
So
is
it
enough
data
to
run
my
model
and
so
in
machine
learning?
That's
a
very
big
constraint
because
you
need
a
lot
of
data
to
train
your
model,
but
even
in
statistical
analysis
you
have
you
have
to
have
a
large
enough
end
to
make
inferences
about
things,
and
so
you
have
to
always
keep
those
in
mind.
A
G
A
Doesn't
mean
that,
because
you
have
a
huge
data,
set
that
it's
really
informative
data,
that's
not
really
there's
no
correspondence
between
the
two
things.
Necessarily
it's
just
that
you
want
to
make
sure
that
you
have
enough
data
that
you
that
you'll
need
for
your
particular
problem,
but
that's
always
an
important
issue.
Another
issue
is
velocity.
A
How
much
change
over
time
in
terms
of
movement
or
process?
Does
this
capture
so,
for
example,
if
you're
looking
at
like
a
person
running
a
marathon,
you
don't
want
to
just
have
a
little
bit
of
data
of
them
coming
off
of
the
blocks,
or
I
guess
you
know,
if
they're
running
sprints,
they
come
off
of
the
blocks,
but
when
they're
just
starting
out
and
then
that's
all
the
data,
you
have
that's
not
enough
data
to
capture
that
entire
process.
A
We
see
this
a
lot
with
embryos
where
you
have
a
little
bit
of
data
at
the
beginning.
You
might
analyze
it,
but
it's
harder
to
say
things
about.
What's
going
on
later
in
the
process
from
those
data,
so
you
always
have
to
keep
that
in
mind
that
if
you
want
to
capture
an
entire
process,
you
need
to
have
representative
data
set
and
there's
a
lot
of
velocity
really
refers
to
the
amount
of
change
that
goes
on
during
that
process.
So
there's
a
lot
of
change
that
goes
on
during
that
process,
you're
going
to
miss
it.
A
A
E
A
F
A
F
A
Right,
yeah
we're
going
to
talk
a
little
bit
about
like
the
like
what
we
call
pseudo
data
later
on
it'll,
be
kind
of
interesting
to
see
morph
and
noise
yeah
there's
my
york,
I
love
my
hook,
so,
let's
see
so
again,
we
have
variety.
So
if
your
data
set
isn't
representative
of
all
the
variety
in
the
world
or
enough
of
it,
that's
makes
it
representative
of
the
world,
then
that
can
be
a
problem
and
then
veracity
is
your
data
reliable
before
and
after
transformation.
A
A
So
how
do
we
know
if
our
open
data
set
is
usable,
and
so
these
are
the
criterion
that
they
present?
The
literature
you
know
has
to
be
available.
It
has
to
be
what
they
call
usable,
which
means
it
has
to
be
documented
as
to
have
metadata
has
to
be
credible,
has
to
be
reliable.
So
you
know
you
have
to
know
that
it's
that
it's
it
represents
what's
going
on
in
the
world.
A
It
has
to
be
relevant,
so
it
has
to
be
like
relevant
to
the
problem
and
then
presentation,
quality
has
to
be
readable
and
the
structure
has
to
be
there.
So
that's
one
of
the
reasons
why
we
do
a
lot
of
annotation.
We
do
a
lot
of
processing
of
secondary
data
is
to
make
it
you
know,
presentable
and
readable
to
people.
There
are
a
lot
of
times
if
you
go
to
a
repository.
A
They'll
have
standards
for
submitting
your
your
data.
If
you
create
data
and
you
submit
it
to
a
repository,
there
are
a
number
of
standards
you
have
to
follow.
Sometimes
it
might
be
like
a
file
structure
that
you
have
to
use
other
times.
It
might
be
just
like
different
pieces
of
metadata
that
need
to
be
there.
A
A
A
Now
you
look
at
the
car's
data
set
and
you
look
at
celebrity
faces
and
you
see
some
of
the
four
v's
there.
You
see
that
you
have.
You
know
you
have
variety.
Of
course
you
have,
I
mean
you
might
have
velocity
in
the
cars
data
set
where
you
may
have
cars
over
many
years,
the
different
designs
of
cars.
So
if
I
show
you
a
car
from
1980-
and
I
show
you
a
car
from
2020,
those
two
cars
might
look
stylistically
different,
but
you
know:
can
you
both
say
that
they're
both
cars?
A
Well,
we
usually
say
they're
both
cars?
Hopefully
you
know
if
you've
trained
your
model
to
on
both
types
of
cars,
that
they
can
also
recognize
that
those
are
both
types
of
cars.
So
those
are
the
kinds
of
challenges
you
have
in
some
of
these
input.
Data
sets.
The
data
sets
should
have
a
lot
of
variation.
A
They
should
have.
You
know
some
time
variation
as
well,
and
then
they
should
also
be
representative
of
the
phenomena
you're
trying
to
measure
so
that
those
are
some
of
the
things
that
you
want
to
consider
when
picking
an
input
data
set-
and
we
had
another
thing
in
the
chat
I
believe-
okay
yeah
so
is
minox-
is
something
interesting
to
show
regarding
pseudo
data,
so
yeah
when
we
get
to
the
pseudo
data
part,
might
not
you
might
you
might
want
to
I'll?
Let
you
present
that
so
that's
this!
A
This
is,
you
know
this
has
to
do
with
data
sets
for
training
and
machine
learning
model
and,
of
course,
if
you're
doing
a
statistical
analysis,
it's
a
similar
issue.
If
you
want
to
analyze
something
you
know
you
want
to
have
those
four
v's,
you
want
to
take
those
into
account
when
you
make
the
analysis
and
of
course,
if
you
do
like
a
standard,
statistical
well,
machine
learning
is
a
statistical
analysis.
A
A
A
But
you
know
we
don't
really
it's
a
very
hard
problem,
because
it's
very
computationally
intensive
and
there's
a
lot
of
variation
here.
You
have
a
lot
of
parts
of
the
protein
and
they
fold
at
different
rates,
and
you
have
different
things
going
on.
So
it's
it's
a
very
hard
problem
and
they've
been
having
contests
for
years
on
this.
A
They
usually
they've
usually
done
this
by
using
super
computers
using
physical
models,
very
large
physical
models
with
force
fields
and
things
like
that,
where
they've
been
able
to
model,
maybe
you
know
a
small
portion
of
like
a
protein's
life
where
it's
been.
You
know
they
can
model
folding.
But
it's
not.
A
But
we
have
to
understand
that
this
progress
comes
from
years
of
open
data,
open
data
input
and
open
data
investment,
and
so
this
is
someone
alad
edwards
who
says
awesome,
but
remember
this
wasn't
by
chance.
Structural
biologists
did
a
couple
things:
the
first
of
all.
They
set
up
a
data
hub
50
years
ago,
called
pdb,
which
contains
a
lot
of
the
pro
they
do
like
x-ray
crystallography
on
the
proteins.
A
So
they
get
a
sort
of
an
image
of
the
proteins
in
their
structure,
and
then
you
know
they
have
the
data
uploaded
to
this
repository,
where
you
have
digitized
versions
of
that
data,
and
so
then
they've
also
too
created
a
culture
of
data
sharing.
So
everyone
who
images
a
protein
will
upload
it
to
this
database
and
so
it's
available
for
the
community.
So
this
is
how
they've
been
able
to
get
protein
data.
A
That's
you
know,
diverse
and
really
kind
of
understand
what
proteins
are
doing,
and
then
they
focused
on
data
quality,
so
the
pdb
hub
they
enforce
static
standards,
quality
standards
for
input
data
and
then
for
they
ran
competitions
to
benchmark
prediction
methods,
which
are
these
competitions.
You
saw
earlier,
which
means
that
you
know
it's:
it's
forcing
people
to
innovate
and
forcing
people
to
be
sort
of
adhered
to
community
standards
and
then
five
contributed
over
10
000
new
structures
to
this
exact
end.
So
this
wasn't.
G
A
A
Yeah
alpha
full
two
is
really
big
right
now
so
yeah,
I
think
that's
a
good
exit,
but
it's
also
a
good
example,
too,
of
input
data
and
how
it's
really
enabling
a
lot
of
these
kind
of
advances.
So
these
are
pre-trained
models.
I
made
this
slide
last
year,
so
I
know
we've
done
a
lot
of
work
on
pre-trained
models
in
the
group
since
then.
A
A
So
we
have
this
deep
learning
model,
zoo
of
image,
net
resnet,
inception
and
dgg,
and
here's
some
of
the
references
and
then
talk
about
pre-trained
models.
They
also
allow
for
clearly
defined
features
and
classes
to
be
built
from
a
data
of
a
specific
types
of
you
know,
scenes
or
faces,
or
cars
or
tomatoes
there
there's
an
article
highlighting
10,
pre-trained
models
of
data
sets.
A
This
is
from
a
data
analytics
blog
and
then
overall
pre-trained
models
also
allow
for
faster
training,
often
with
superior
performance,
but
this
may
not
always
be
the
case,
so
we
should,
and
then
this
in
this
article
they
tell
you
to
approach
pre-training
models
with
caution,
and
so
it's
not
all
you
know
wonderful
stuff
in
pre-trained
model
land.
You
know
there
are
some
caveats
that
you
have
to
consider
and
a
lot
of
those
have
to
do
with
input,
data
and
training,
so
free
trained
models,
use
input.
A
A
A
A
You
also
have
to
take
into
consideration
balancing
your
training
set
or
input
your
input
data
set
into
different
classes,
so
that
each
class
is
represented
by
a
similar
number
of
samples
you
might
down
sample
to
get
you
know,
resolution
you
know
to
match
the
resolution
of
other
sets
or
you
might
up
sample
so
say.
If
you
have
one
class
where
you
only
have
a
couple
instances
but
other
classes
where
you
have
a
lot
of
instances,
you
can
do
these
sort
of
strategies
to
to
normalize.
A
For
that-
and
so
you
know
this
is
one
thing
you
have
to
keep
in
mind
when
you
have
input
data-
that
it's
not
always
neat
and
even
in
terms
of
the
classes
that
you're
building,
especially
when
you
put
data,
sets
together
from
different
places,
you
might
have
some
set.
You
know
some
classes
that
are
overrepresented
some
that
are
underrepresented,
so
these
are
strategies
to
normalize.
All
of
that,
so
now
we're
getting
into
synthetic
and
pseudo
data,
and
so
this
is
something
that
might
not
get
mentioned.
A
He
had
an
example
of
so
the
synthetic
or
pseudo
data
is
a
model
of
data
that
generates
something
not
found
in
the
original
measurement
or
something
that's
not
directly
measurable
and
so
an
example
would
be
interpolation
between
samples,
dynamical,
modeling
of
a
hypothetical
regulatory
process.
So
I
can
systems
biology
will
often
use.
A
You
know
often
have
like
some
model
that
we
use
for
regulation,
but
we
only
have
some
of
the
genes
measured
and
so
to
measure
some
other
things
we
might
create,
like
some
stochastic
process
so
we'll
generate
some
data
representing
the
stochastic
process
will
simulate
the
data
and
then
you
know
maybe
use
some
of
the
things
we
know
about
the
intermediate
processes
to
modify
that
stochastic
simulation
of
the
data.
So
you
can
do
things
like
resample
to
re-sample
real
data
through
jackknifing
and
bootstrapping.
A
You
can
also
use
small
sample
inference
which
is
distribution
modeling,
so
you
can
take
like
something.
You
only
have
a
couple
of
samples
on
and
you
can
build
a
distribution,
so
you
can
say
well.
I
only
have
a
couple
samples
of
this
thing,
but
I
assume
that
it's
coming
from
a
gaussian
distribution,
so
I'll
build
a
gaussian
distribution
around
the
parameters
that
I
measure
from
my
sam
few
samples
and
then
sample
from
that
distribution
and
generate
new
points,
and
I
can
assume
that
this
is
the
way
that
the
rest
of
the
data
is
distributed.
A
So
it's
a
good
heuristic
for
my
data
that
I
want
to
understand.
And
finally,
you
have
things
called
data
dependent
prior,
so
you
can
use
bayesian
inference
to
generate
priors
for
say,
like
a
bayesian
model.
So
this
is
where
you
observe
again,
you
observe
data,
you
build
a
prior
and
then
you
try
to
predict.
A
You
know
something
from
that
prior,
so
I'm
not
going
to
get
into
bayesian
inference,
but
that's
another
way
to
go.
So
how
do
you
make
a
pseudo
data
set?
So
the
first
step
is
to
create
archetypical
labels
or,
like
figure
out
what
you
want
to
create
in
terms
of
a
variable,
and
so
you
want.
What
do
you
want
to
measure?
And
so
you
want
to
create
these
and
be
clear
about
what
you're
trying
to
measure.
A
Then
you
use
a
distribution
or
a
statistical
distribution
to
create
a
series
of
plausible
values
based
on
estimates,
so
you
might
have
like
a
mean
and
a
standard
deviation,
and
from
that
you
can
send.
You
know
you
can
build
like
a
some
sort
of
distribution.
You
can
build
a
gaussian
distribution.
You
can
build
a.
A
Exponential
distribution
of
some
type
but
you're
going
to
get
a
larger
number
of
values.
Those
values
will
represent
that
process,
but
it
won't
be
the
real
measurements
so
you're
going
to
make
that
clear,
and
then
you
want
to
sample
the
ways
to
test
type
sample
these
values,
a
way
that
ways
that
test
hypotheses
and
allow
for
variation
be
represented.
A
A
You
know
amenable
to
what
you're
actually
trying
to
measure,
but
you
also
want
to
be
able
to
you
know,
test
hypotheses
with
it
or
to
plug
it
into
a
machine
learning
model,
and
you
know
there
are
ways
like
we
mentioned
before.
You
know
you
can
have
under
fitting
and
overfitting.
If
you
don't
do
this
process
correctly,
so
it's
basically
three
steps
and
you
know,
like
here's
an
example
of
pseudo-labeling
for
something
you
know
where
someone's
doing
semi-supervised
learning,
which
is
where
you
have.
E
A
D
D
To
clean
models,
so
let's
say
you
wanted
to
train
again
to
generate
some
more
editing.
You
know
so
like
if
you
train
this
again.
So
if
you
try
again,
you
get
outputs
like
this.
You
know
like
these
are
not
really
they're,
not
really.
The
digits
like
these
are
some.
They
have
features
like
this,
but
they
are
not
really
really
just
like,
like
some
of
them
are
trees
or
whatever.
D
D
D
D
D
Digits
and
this
chair
and
this
discriminator
is
trying
to
sharpen
its
skills
by
training
on
the
fake
and
the
real
samples
and
trying
to
discriminate
between
the
real
and
the
examples.
So
what
the
discriminator
does
is
that
suppose
the
generator
has
generated
this
six
right,
so
this
discriminator.
This
will
take
the
input
of
the
six
and
then.
D
D
D
C
D
D
F
Actually
so
that's
yeah,
but
I
think
for
like
creating
some
leveling
data
for
fake
leveling
data.
If
we
can
find
some
other
easy
ways
to
do
it.
I
think
that's
a
better
way
to
try
with
that
easy
one.
First
and
after
that
we
can
go
to
the
cancer
something
like
this,
but
because
there
is
kind
of
a
lot
of
like.
D
D
A
Yeah
post
it
in
the
chat
as
well
just
the
link
so
yeah.
I
think
that's
a
good
thing
for
people
to
look
over
and
you
know
try
so
yeah.
I
like
that.
I
didn't
even
think
about
that
those
sorts
of
things
but
yeah.
You
know
there
are
a
lot
of
ways
to
create
pseudo
data,
and
this
is
of
course
one
if
you're
doing
this.
For
you
know
it's
just
what
I'm
showing
you
is
sort
of
a
very
general
thing,
more,
maybe
oriented
towards
statistical
analysis
but
yeah.
A
There
are
a
lot
of
ways
to
generate
pseudo
data
and,
of
course,
you
know
we're
trying
to
the
whole
reason
we're
doing
this
is
we're
trying
to
get
maybe
more
input
data
than
we
otherwise
would
have
so
we're
trying
to
like
trying
to
simulate
the
input
data
a
little
bit
more,
maybe
augment
it
or
do
other
things.
So
thank
you,
my
knock
for
that.
That's
very
helpful,
and
so
so
the
next
thing
I
want
to
talk
about
was
you
know
now
we're
getting
into
sort
of
some
of
these
things
about.
A
So
you
know
if
you
have
small
and
incomplete
data
sets,
and
sometimes
it's
not
so
much
that
your
data
set
is
incomplete,
but
it's
a
has
difficulty
interpreting
rare
events
so
like,
for
example,
if
there's
a
rare
event
in
the
world,
something
doesn't
happen
very
often.
If
you
train
your
data
set
on
a
lot
of
normalized
data.
A
A
If
you
don't
train
it
on
that
ver
than
the
variant
and
it's
a
rare
variant
in
in
the
population,
but
it
exists,
then
it
won't
be
able
to
interpret
that
three.
So
that's
one
thing
to
to
consider
another
thing
is
the
ability,
the
machine
algorithm's
ability
to
learn
from
decisions
is
based
on
choice,
contingent
feedback.
A
A
So,
in
other
words,
if
something
isn't
really
salient
or
something
isn't
recent,
then
it
can
be
ignored,
even
if
it's
a
better
choice,
and
so
you
know
all
these
things
we
have
to
consider,
they
call
it
natural
stupidity,
because
I
think
there's
been
an
assumption
that
machine
learning,
algorithms
are
sort
of
a
triumph
on
human
decision
making
and
some
of
the
errors
that
we,
you
know
from
memory
and
decision
making.
But
that's
not
exactly
the
case,
and
so
this
paper
is
kind
of
an
interesting
take
on
that.
A
A
Usually,
we
will
train
our
models
and
on
distributions
that
are
iid
which
are
independently
distributed
events
that
you
know
they're
idealized,
so
they
exist
in
that
and
maybe
in
a
gaussian
and
but
the
you
know,
but
of
course
the
gaussians
also
have
tails,
and
so
those
tails
aren't
very
well
sampled,
and
so,
if
you
have
something
that
exists
in
a
tail
you're
going
to,
you
know
misinterpret
it.
So
what
they've
done
is
they've
trained
models
purposefully
on
these
out
of
distribution
events
and
trained
it
to
generalize
to
those
events
as
well.
A
A
Another
thing
is
burstiness,
so
we
think
of
periodic
events
and
we
think
of
things,
but
but
things
in
the
world
aren't
distributed
periodically.
In
other
words,
you
know
we
think
of
things
as
happening
sort
of
you
know,
maybe
every
five
units
or
ten
units
of
time,
and
so
in
the
natural
world.
You
have
a
lot
of
different
types
of
distributions.
A
Some
of
them
were
poisson
distributed,
some
of
them
were
bursty
and
you
can
see
the
differences
in
how
they
occur,
and
so,
if
you
train
your
model
on
sort
of
periodic
set
of
events,
you're
going
to
miss
a
lot
of
this
natural
variation
in
how
things
happen
and
so
not
to
get
into
the
distributions
here.
But
these
are
events
that
are
clustered
in
time,
but
there's
no
meaning
to
the
clustering.
It's
just
that.
That's
the
way
the
process
operates,
and
so
that's
something
you
think
about
as
well.
A
A
A
So
it's
you're
not
trying
to
generalize
at
the
machine
you're
just
trying
to
create,
like
you
know,
maybe
extract
features
or
find
an
interesting
pattern,
and
then
the
human
operator
would
verify
that
and
say
it's
something.
That's
interesting
or
not,
and
this
is
something
that
allows
for
easier
selection
when
users
are
selecting
on
these
things
presented
by
algorithms
that
are
mining
data.
A
So
you
know
going
back
to
biology.
Consider
the
following:
spherical
systems.
Now
we
think
of
data,
we've
talked
about
the
mna
status
and
we've
talked
about
the
faces
data
set,
but
think
about
something
like
this.
So
there's
a
lot
of
input
data
here,
potentially
there's.
You
know
this
shape
data,
but
we
also
have
dynamical
data.
We
have
data
on
cell
divisions,
we
have
data
on
deformations
of
individual
cells,
we
have
movement
data,
we
have
a
lot
of
things
going
on
and
these
are
two
different
embryos,
and
these
are
just.
This
is
just
embryogenesis.
A
So
there's
a
lot
of
you
know
physical
interactions,
there's
a
lot
of
data
that
we
can
extract
from
this
and
uses
input
data
to
our
models,
and
so
there
are
a
couple
questions
for
application
specifically
to
developmental
biology
and
of
the
first
one
is:
what
does
a
grid
training
set?
Look
like
what
property
should
it
have
so
should
it
be,
you
know,
based
on
microscopy,
should
it
be
based
on
genetic.
You
know.
A
Data
should
be
based
on
electrophysiological
data,
our
pre-trained
models
adequate
and
we
kind
of
know
a
little
bit
about
that
from
our
work
last
summer.
They're
adequate,
but
you
know
we.
We
still
want
to
do
more
work
on
this.
Do
we
need
biologically
specific
models
or
multi-scale
models
and
then,
finally,
what
are
the
semantic
aspects
of
biological
data?
A
Are
they
just
labels
or
are
they
annotations
of
function
or
are
they
shapes
like
the
shapes?
I
showed
you
there
where
you
have
spheres-
or
you
know
blobs,
you
know,
are
movements
semantic
like
when
cells
migrate
or
functions
if
cells
have
a
different
function,
even
if
it's
just
kind
of
watching
it,
like
you
know,
contract
or
watching
it
move.
Is
that
a
semantic
thing?
And
so
those
are
all
interesting
questions,
and
then
I
would
finish
with
this.
This
is
what
we
have
now.
This
is
a
state
of
the
art
in
the
project.
Divo
learn.
A
This
is
where
we
have
a
pre-trained
model:
divalern
0.2.
This
is
optimized
to
segment
and
analyze
high-resolution
microscopy
images.
This
is
some
information
on
diva
learn,
but
we
also
have
a
platform
viva
learn,
which
is
this.
You
know
initiative
to
sort
of
bring
together
all
of
the
machine,
learning
tools
that
we
have
in
the
group
and
allow
people
to
learn
around
that
library
of
things.
So
we
have
secondary
data,
we
have
these
analytical
tools
and
then
we
have
an
educational
collection.
A
So
that's
all
I
have
on
that
and
I
I
will
probably
be
updating
it
again.
I
want
to
put
some
of
your
input
in
and
I'm
going
to
provide
authorship,
but
you
know
I
I
we
have
a
separate
stub
for
this
on
github,
so
you
know
I'll
be
I'll,
be
communicating
with
you
about
this
in
the
future.
I
think
this
is
a
good
topic
for
people
to
learn
about,
and
I
don't
really
see
it
too
often
in
other
areas
of
like
you
know.
A
So
I
wanted
to
present
on
a
couple
other
things
today
and
if
you
have
to
leave
at
the
top
of
the
hour,
that's
okay,
I'm
just
gonna,
keep
going
until
we
get
some
of
these
other
items
off
the
board.
Thank
you
for
your
attention
on
that.
That'll
be
useful
for
another
round
of
revisions
on
that.
The
first
thing
I
want
to
mention
is
this
periodicity
in
the
embryo
paper,
and
so
this
is
a
paper
we've
mentioned.
For
you
know
a
number
of
months
we've
been
talking
about
working
on
this.
A
A
Now
it's
basically
this
idea
that
in
embryos
you
have
this
sort
of
these
temporal
features,
I'm
calling
them,
and
it's
basically
this
one
of
the
ideas
I
showed
in
the
slides
of
how
things
are
distributed
in
time,
and
so
there's
this
idea
of
looking
at
cell
divisions
and
how
often
they
occur
in
the
process
of
building
an
embryo
when
it
turns
out
that
they're
very
bursty
and
they
have
a
lot
of
interesting
properties,
and
so
this
paper
is
going
to
go
through
some
of
those
properties.
We
use
two
different
animal
models.
A
We
use
the
c
elegans,
which
is
our
what
our
group
is
named
after
the
roundworm,
and
then
we
have
danny
orrerio,
which
is
a
zebra
fish,
which
is
a
model
organism.
It's
a
fish
obviously,
and
it
has
a
different
type
of
embryogenesis,
but
we
can
make
comparisons
between
the
two
and
then
we
use
simulated
data,
which
is
a
very
simple
method,
but
it's
informative
with
respect
to
some
of
these
distribution-based
approaches,
and
so
the
introduction
goes
over
why
this
might
be
important
how
it
ties
into
the
literature.
A
Then
I
talked
a
little
bit
about
some
of
the
theoretical
underpinnings
of
it.
I
have
some
methods
I
have
to
flesh
out,
and
then
we
have
some
figures.
We
have
some
data
from
c
elegans,
where
you
have
these
birth
times
distributed
in.
You
know
bins.
So,
like
every
five
minutes
of
development,
we
have
a
number
of
these
division
events,
and
so
that
represents
a
bin
in
this
diet
in
this
graph,
and
so
you
can
see
that
these
are
things
that
happen
in
the
embryo.
These
are
things
that
happen:
post,
embryonically.
A
And
then
you
we
have
this
interval
analysis
where
we
take
the
intervals
between
these
and
plot
them
out
and
try
to
figure
out
what
the
distribution
of
those
intervals
look
like.
And
then
we
go
back
to
zebrafish
and
we
look
at
similar
things
going
on
in
zebrafish
at
this
time
period,
which
are
two
developmental
periods.
A
So
we
kind
of
focus
in
on
that.
Then
we
do
another
analysis
of
the
intervals
and
then
kind
of
get
into
the
synthetic
embryo
where
we're
generating
a
bunch
of
division
times,
based
on
different
distributions
that
we
assume
that
that
these
divisions
conform
to
this
is
a
uniform
distribution
of
cell
divisions
versus
some
of
the
other
types
of
cell
divisions
using
other
types
of
distributions.
G
A
Is
basically
and
then
I'm
gonna,
this
is
basically
the
result.
I'm
gonna
write
up
about
that.
Then
the
discussion,
which
is
just
kind
of
interpreting
the
data
on
the
references,
so
it's
pretty
short
right
now.
It
needs
more
work.
I'm
going
to
be
working
on
it.
If
you're
interested
in
collaborating
on
this,
I
can
send
you
a
link
to
this
doc
and
you
can
read
it
over
give
your
comments.
I'll,
probably
send
it
out
for
comments
and
slack
before
I
submit
it.
A
So
that's
and
then-
and
you
know,
if
you
have
an
opportunity
for
authorship,
if
you
can
make
comments
or
maybe
make
some
additions
or
changes,
then
that's
something
that
you
can
also.
You
know
that's
an
opportunity
for
authorship,
I'm
pretty
open
with
respect
to
authorship
on
these
sorts
of
things.
So
that's
that's
that
paper.
Hopefully
we
can
get
that
done
by
the
end
of
the
year
and
then
we
have
some
papers.
A
A
C
A
Okay,
yeah
yeah
yeah.
Let
me
go
through
the
papers,
real,
quick
and
then
we'll
do
that.
So
one
of
the
things
I
found
this
last
night
I
was
reading
this.
This
is
a
blog
post
by
someone
called
james
summers
and
he
says
I
should
have
loved
biology
and
it's
an
interesting
take
he's
a
computer
scientist,
but
he's
not
really
that
well-versed
in
biology
and
he's
trying
to
understand.
A
He
wants
to
really
understand
more
about
biology.
So
there's
a
lot
of
really
exciting
stuff
going
on
so
he's
talking
here
about
the
state
of
sort
of
getting
sort
of
into
biology
from
a
very
you
know,
baseline
position.
I
guess
you
know
we
probably
took
high
school
biology,
but
there's
just
when
you
try
to
read
an
academic
paper,
it's
almost
impossible
to
really
kind
of
get
through
a
lot
of
the
jargon.
A
So
he
says
that
he's
starting
a
magazine
assignment
to
answer
some
questions
about
sars,
co,
v2,
which
is,
of
course
coronavirus
and
the
immune
system-
and
he
reads
an
academic
paper
where
they
have
a
paragraph
like
this.
So
you
know
they
have
a
lot
of
different
abbreviations
in
here.
They
have
some
a
lot
of
jargon,
terms,
total
reads:
mapping
more
than
300
times
coverage
across
the
30
kb
genome.
What
does
that
mean
to
someone
who
doesn't
really
know
a
lot
about
biology
or
genomics,
and
so
just
kind
of
you
know.
A
A
A
So
this
is
something
that
then
he
talks
about
how
you
know
you
have
a
lot
of
good
resources
out
there.
People
are
doing
things
like
animations
cartoons,
showing
a
lot
of
the
processes,
and
you
know
going
beyond
these
abstract
acronyms
to
these
really,
you
know
things
that
really
help
you
understand
what's
going
on
in
the
biology,
and
so
he
kind
of
advocates
for
this
idea
of
you
know
how
do
we
make
this
easier
for
people
to
understand?
Coming
in?
A
I
thought
this
article
was
very
relevant
to
this
group,
because
that's
what
we
kind
of
try
to
do
in
this
group.
One
of
the
missions
of
the
group
is
to
make
this
stuff
easier
to
understand,
we're
creating
educational
tools
and
analytical
tools,
and
you
know
sometimes
it's
it's
easy
to
to
lose
sight
of
the
fact
that
there's
a
lot
there's
a
lot
of
it's
a
lot
of
hard
stuff,
and
this,
I
guess,
holds
for
the
computational
stuff
as
well.
You
don't
really
understand
not
just
machine
learning.
A
A
Bit
better
foundation
in
their
bio,
biological
thinking
so
yeah.
So
this
is
a
pretty
good
article
if
you're
interested
in
education
and
and
maybe
like
presenting
your
work
more
clearly
yeah.
So
there's
that
and
then
dick
sent
me
he's
not
here
this
week,
but
he
sent
me
this
paper
and
arrested
coalescence
in
multicellular
aggregates,
so
multicellular
aggregates
are
known
to
exhibit
liquid-like
properties.
A
A
The
fusion
process
of
two
cell
aggregates
is
commonly
studied.
As
the
coalescence
of
two
viscous
drops.
However,
tissues
are
complex
materials
which
usually
exhibit
viscoelastic
viscoelastic
behavior.
It
is
known
that
elastic
effects
can
prevent
the
complete
fusion
of
two
drops,
a
phenomenon
known
as
a
rested
coalescence
here.
A
A
They
can't
move
all
of
a
sudden,
they're
restricted
in
their
movement,
and
this
happens
very
quickly.
You
know
at
a
certain
density,
and
so
what
they're
talking
about
is
this
sort
of
transition
between
jamming
and
jamming?
And
so
this
is
a
really
interesting
sort
of
thing.
So
you
can
do
this.
You
can
analyze
this
with
an
agent-based
model
where
you
have
a
bunch
of
agents
that
are
these
cells,
and
I
think
we've
shown
these
agent-based
models
in
the
group.
A
A
So
this
sounds
like
something
that
susan
would
be
very
interested
in
this
is,
you
know
really
about
the
shaping
process
during
morphogenesis
how
organs
are
built,
and
so
this
is
an
example.
Here
I
don't
know
if
I
can
zoom
in
on
this,
but
you
can
see
that
they've
got
these
cells,
these
are
stem
cells
and
then
they
form
these
cell
aggregates
and
then
they
fuse
together
these
aggregates,
and
this
is
what
they
call
rusted
coalescence.
A
And
so
they
can
measure
this.
They
can
also
simulate
it
with
a
agent-based
model.
They
look
at
the
different
physical
properties
of
these
aggregates
and
when
they
come
together,
so
they're
coalescing
together,
they're
sort
of
almost
like
the
two
clusters
are
overlapping,
whereas
when
they're,
not
overlapping,
there's
no
coalescence.
A
A
You
know
they
think
that
the
sort
of
the
material
properties
of
the
cell
aggregates
are
much
more
complicated
than
we
can
get
from
a
single
physical
model,
and
so
we
turn
to
these
type
of
agent-based
models
and
so
they're
actually
using
the
gpu
to
model
this-
and
I
don't
know
if
they
show
graphs
of
this
well,
here's
one
here.
I
guess
this
is
the
region
based
simulation
of
these
aggregates,
so
they
have
these
red
and
blue
cells.
A
You
know
each
one
of
these
cells
is
an
agent
and
they're
watching
it
they're
coalescent
the
two
clusters
coalesce
into
a
single
cluster,
and
then
they
have
this
regime
here,
where
they
have
protrusion
strength
and
protrusion
ratio,
and
they
have
this
sort
of
map
of
the
different
phase
regimes.
So
they
have
no
coalescence
arrested,
coalescence,
complete
coalescence,
and
so
you
can
build
a
graph
like
that.
Where
you
have
this
transition-
and
this
is
of
course,
the
transition
here-
this
dotted
line.
A
A
A
So
this
is,
I
mean
some
of
the
reasons
might
be
dated,
but
it's
they
kind
of
talk
a
lot
about
sort
of
the
current
theories
of
development,
and
this
is
sort
of
a
record
of
this
book.
So
I
just
found
this
on.
You
know
in
my
readings
I
thought
that
might
be
interesting
to
bring
up
some
of
the
older
classic
books.
This
is
one
of
the
books.
Again,
this
is
almost
100
years
old.
So
it's
kind
of
you
know.
A
Modern
theories
is
kind
of
a
bad
name
for
it,
maybe
at
this
point,
but
so
they
basically
talk
about.
It
is
pointed
out
that
a
crisis
has
been
reached
in
biology
in
1938
due
to
the
rapid
accumulation
of
facts
without
clear
theoretical
laws,
and
so
this
is
the
state
that
they
found
themselves
in
1930,
and
maybe
today,
even
the
controversy
between
mechanism
and
vitalism
is
revived
and
is
shown
where
each
of
these
theories
of
life
breaks
down.
A
The
author
also
considers
the
physiochemical
explanation
of
single
phenomena
in
the
organism,
and
that
does
not
suffice
for
the
foundation
of
a
theoretical
biology,
as
it
fails
to
establish
laws
to
explain
the
arrangement
of
organizational
material
processes,
and
so
there's
this
idea.
If
you
want
to,
if
you're
interested
in
the
history
of
theories,
I
know
we
have
this
theory
building
initiative
that
I've
been
talking
about.
It's
really
just
a
way
to
present
this
to
people,
and
I
think
this
will
be
part
of
that
discussion.
Where
you
know
people
are
interested
in.
A
A
In
the
past
he's
been,
I
think,
he's
spearheading
this
ford,
4d
cell,
nuclear
tracking
online
course,
and
so
what
this
is
is
it's
a
it's
a
course
on
cell
tracking,
where
they
track
the
nucleus
and
in
fact,
a
lot
of
the
microscopy
data
that
we
work
with
in
this
group
are
based
on
these
sort
of
cell
tracking
methods
where
they
stay.
You
know
they
usually
stain
the
cell
with
some
marker,
and
then
they
can
track
the
cell
and
microscopy
images,
so
they
can
get
it
into
a
sort
of
a
common
framework.
A
So
you
can
look
at
how
cells
move
but
you're
tracking
the
nucleus,
so
it's
not
the
entire
cell
necessarily
a
lot
of
times.
It's
just
the
position
of
the
nucleus,
the
time
that
it
appears
the
time
that
it
divides,
and
so
this
is
a
way.
This
is
a
course
it
may
be
beyond
if
you're
interested
just
in
the
output
data,
it
may
be
beyond
what
you're
interested
in,
but
it's
basically
goes
through
a
lot
of
the
stuff
that
you.
G
A
A
And
then
this
is
this
course
introduces
the
use
of
this
public
database
sspd,
which
is
something
that
we
use.
It's
a
very
good
resource
for
data
input,
data
for
models,
there's
a
lot
of
data
on
different
organisms
for
development
or
for
other
types
of
cell
cell
biology,
and
so,
if
you're
interested
in
that,
maybe
even
if
you're
into
machine
learning
it'd
be
good
to
go
through
these
materials
to
get
a
sort
of
an
idea
of
how
the
data
are
collected.
A
H
F
A
G
G
H
G
G
A
good
picture,
okay,
so
what
happened
is
first
of
all
the
data
that
is
I'm
having
is
merged
with
the
thousand
genome
data
and
then,
after
that,
I
used
in
a
tool
named
p-link.
It
give
me
the
eigenvalues
and
after
that,
these
eigenvalues
are
plotted
in
the
language
are
to
get
the
you
know,
visualization.
G
So,
for
example,
if
I'm
having
here
I'm
having
asian
people-
and
here
I'm
having
african
people-
and
my
point
is
someone
here,
so
I
get
the
chance
that
the
person
whose
ancestry
I'm
going
to
check
it
belongs
somewhere
close
to
the
african
people
and
how
it
can
be
helpful.
It
is,
can
be
used
in
selective
medication
because
it
has
been
found
that
different
races
are
respond
to
different
medicines
in
a
different
way.
G
G
Biotechnology
information,
so
here
is
the
data
flow.
First
of
all,
data
is
collected
and
it's
converted
in
a
format
that
is,
you
know,
accessible
by
the
tool
feeling,
and
then
we
exclude
the
variants
that
are
not
necessary
and
after
prune
cloning,
each
of
the
chromosomes
we
get
the
eigenvalues
and
we
link
only
give
us
the
eigenvalue.
It
doesn't
visualize
that
chart,
so
that
is
to
be
done
in
the
r
language,
so
the
things
required
for
that.
We
need
to
have
bad
scripting
for
creating
the
scripts.