►
From YouTube: Tracking Value With GitLab - DORA4 Metrics
Description
In this session Sr. Product Manager, Orit presents an overview of the deployment frequency metrics released in 13.8 (1 of the DORA4); as well as the roadmap & timing for the remaining DORA4 metrics.
A
Okay,
so
now
I
just
need
a
camera,
so
I'm
the
senior
product
manager
for
the
release
stage.
It's
important
for
me
to
note
that
the
door
of
four
metrics
is
a
collaboration
between
a
bunch
of
different
stages
and
that
I'm
leading
it,
but
there
are
different
channel
stages
that
are
also
involved,
among
them
the
optimized
group
for
manage
and
also
monitor
and
used
to
be
release
management,
and
now
it's
all
released.
So
it's
a
lot
of
work
and
it's
been
a
long
time
coming
so
on
the
agenda.
A
A
A
Is
this
really
doing
anything
for
me?
What's
the
roi?
It's
not
something
that
you
can.
You
know,
sell
in
a
for
cost
and
then
figure
out.
If
this
is
something
that's
worth,
the
investment
process
is
much
harder
to
measure
and
that's
why
dora
is
a
really
great
way
for
us
to
measure
the
sdlc
process.
So
that's
kind
of
why
it's
important
and
why
it
was
adopted
and
we
as
git
lab,
have
a
really
great
momentum
to
bring
dora
4
metrics
into
our
platform.
A
We
have
a
bunch
of
this
data
already,
and
so
the
challenge
now
is
just
to
surface
it
to
the
users,
but
anyone
who's
using
gitlab
end-to-end
can
really
benefit
from
all
of
this
data,
and
just
you
know,
learn
from
it
without
having
to
integrate
yet
another
tool
to
figure
out
whether
their
door
for
metrics
are
are
working.
Okay
or
not.
A
A
There's
actually
a
lot
of
controversy
about
how
we
plan
to
measure
this,
and
definitely
something
that
we
can
talk
about
and
kind
of
I'll.
Tell
you
what
the
different
ideas
are
time
to
restore
service,
how
long
it
takes
to
recover
from
an
incident
or
you
know,
pull
out
a
hot
fix
or
whatever
and
change
failure
rate
is
how
in
percentage,
how
often
do
we
recover
from
these
failures,
whether
it's
a
hot
fix
or
rollback
or
or
something
like
that.
A
Production
is
the
main
environment
that
we're
talking
about
I'll
talk
a
little
bit
about
how
we
can
kind
of
escape
that
role
within
git
lab,
but
really
dora
4
by
the
textbook
definition
is
all
about
production
and
successfully
is
also
really
interesting,
because
we
have
a
lot
of
deployments
that
are
are
in
pending
or
in
fail
state.
That's
not
interesting
if
to
be
counted
as
deployment
frequency
has
to
be
successful,
and
so
the
primary
frequency
by
git
labs
definition
is
pretty
similar.
A
We
have
the
average
deployment
frequency
to
production
for
a
specific
time,
so
we
normalize
it
by
the
dates
and
then
we
get
to
the
deployment
frequency,
but
obviously
deployment
frequency
for
seven
days
will
be
different
than
30
days.
It
will
be
different
than
90
days,
since
everything
is
normalized
by
the
time
stamp
that
is
chosen
by
the
customer,
and
it
is
based
on
the
deployment's
end
time,
so
it
has
to
be
finished
properly
and
the
end
time
is
when
the
deployment
is
considered
done.
A
A
So
we
didn't
look
at
commits
we're
looking
at
merge
requests
and
the
reason
why
we
did.
That
is
because,
in
every
customer
conversation
that
I
had
people
were
super
comfortable
with
merge,
requests
and
found
it
to
be
more
interesting
than
just
commits,
and
so
we're
going
the
gitlab
way
and
counting
it
by
merge
request.
A
We
have
a
little
bit
of
a
controversy
regarding
how
we're
exactly
going
to
implement
this,
because
the
textbook
definition
is
how
long
it
takes
for
code
committed
to
get
into
production,
but
there's
actually
two
stages
for
that
to
happen.
One
of
them
is
for
code
to
be
merged,
but
not
necessarily
into
production.
So
just
you
know
commit
to
merge
and
we
already
present
in
13
9.
A
How
long
does
it
actually
get
deployed
to
production
so
we're
kind
of
in
debate
whether
we
should
count
the
time
from
the
merge
request
being
created
until
it
hits
production
like
the
definition
or
if
we
should
split
them
into
two,
because
we
already
know
the
mean
time
to
merge
and
just
check
the
deployment
time,
and
why
is
this
important?
Because,
let's
say
you
don't
deploy
over
the
weekend
and
now
you're
counting
all
this
average
time
for
a
merge
request
to
get
to
production.
A
A
So
I'm
happy
for
anyone
to
chime
in
or
to
write
in
the
agenda
doc
what
they're
they
think
and
and
we'll
take
that
into
the
conversation
that
we
have
next
week
and
deciding
exactly
how
to
measure
that
the
third
one
is
change.
Failure
rate
and
google's
definition
is
percentage
of
deployments,
causing
a
failure
in
production
and
the
way
that
we're
planning
on
measuring
this
there's
actually
two
ways.
So
the
mvc
is
going
to
be
the
first
one,
which
is
the
number
the
count
of
incidents
divided
by
deployment
count.
A
A
Last
one
is
time
to
restore
service
which,
by
the
google
definition,
is
how
long
it
takes
for
an
organization
to
recover
from
a
failure
in
production,
and
this
is
also
going
to
go
into
two
takes.
The
first
iteration
is
still
leaning
on
incidents.
The
average
duration
of
when
an
incident
goes
from
open
to
close
and
expansion
of
that
for
non-incident
management
users
will
be,
for
example,
how
many
rollbacks
occurred,
and
how
do
we
define
rollbacks
in
gitlab?
A
B
Questions
the
the
last
one
for
the
last
two.
From
my
perspective,
it
seems
as
though
it
makes
more
sense
to
use
the
first
two
metrics,
because
they're
actually,
the
metric
like
the
second
one,
the
time
to
restore
service
is
an
example
measuring
how
many
rollbacks
go.
That's
a
count,
that's
not
how
long
it
took
you
to
restore
service.
A
B
B
So
I
think
if
we,
if,
if
we
iterate
too
much
and
then
sort
of
move
away
from
from
the
sort
of
standard
understanding
of
what
the
door
four
is
and
the
lead
time
for
changes
is
an
interesting
one
that
we
we
risk,
devaluing
them.
Oh
they're
kind
of
yeah
someone's
put
glorifor
gitlab
or
a
version
of
the
door
for,
and
I
feel
like
that's
the
point
in
which
customers
might
be
like
just
like
okay.
Well,
we
we
want
to
see
the
door
of
four.
A
B
The
lead
time
for
changes,
one
from
my
perspective,
is
an
interesting
one,
because
it
from
the
way
I
read
it
is
it's
the
the
lead
time
for
basically,
how
long
does
it
take
for
a
change
to
be
started
to
get
it
into
production?
That's,
and
I
think,
change
started
for
me-
is
probably
the
first
commit
on
an
mr,
like
it's
not
the
subsequent
commits,
because
it's
all
part
of
that
same
change.
B
So
I
would
probably
because-
and
the
reason
why
I
differentiate
that
from
the
mr
being
created,
is
because
sometimes
mls
sit
there
without
any
commits
on
them
for
a
little
while
actually
and
discussions
going
on
as
to
how
should
we
attack
this
problem
before
the
check
before
the
first
change
is
actually
made,
but
yeah
there's
it's
it's
interesting
because
yeah,
they
are
very
much
open
to
interpretation
yeah.
So
that's.
A
A
really
good
point:
I'm
going
to
make
a
note
of
that
to
add
it
to
one
of
our
suggestions.
Basically,
we
can
at
one
point
support
any
of
these.
Variations
is
just
deciding
the
mvc,
because
we
have
all
this
data,
so
we
could
really
allow
the
user
to
pick
and
choose
at
some
point.
We
have
everything,
so
I
think
that's
what
one
of
our
biggest
advantages
we'll
see
what
users
ask
for,
and
we
can,
then
you
know
iterate
towards
that.
C
A
quick,
more
generic
question
these
dollar
form
metrics
are:
they
is
the
intention
behind
that
that
organizations
want
to
compare
themselves
again
with
other
organizations
or
is
it
whether
you
want
to
track
whether
you
make
progress
or
have
a
degradation
on
on
some
of
these
metrics
or
inside
an
organization?
What's
the
main
driver.
A
Seeing
and
there's
two
things
that
are
interesting.
One
is
the
aggregated
data
of
all
the
company.
They
want
to
see
how
often
everyone
is
deploying,
and
the
second
point
is
they
want
to
compare
groups
and
teams
of
developers
inside
their
organization
to
see
who
is
performing
better
than
others.
Maybe
that's
a
point
to
learn
from
someone
from
a
really
great
performing
team
or
someone
that
needs
some
help.
A
C
B
A
So
I've
seen
optimize,
they
have
a
really
nice
roadmap
of
showing
the
adoption
of
the
different
stages
that
you
have
in
devops
and
I
think
they
also
wanted
to
present
the
devops
score.
Based
on
that,
so
I
think
that's
kind
of
similar
to
what
we're
discussing
here.
What
I
mean
is
it's
really
hard
to
define?
What's
a
company
like
mine,
when
you
want
to
compare
it
to
others,
is
it
just
everyone
on
gitlab.com?
Is
it
someone
in
my
tech?
Is
it
someone
who
has
the
same
amount
of
seats
that
I
have?
A
Is
it
someone
who
has?
I
don't
know
the
same
amount
of
projects
we
can
define
this
going
forward,
but
I
think
it's
a
really
great
space
to
be
in
where
we
can
actually
give
that
dora
force
score
based
on
customer
data
that
we
have-
and
everything
of
course
has
to
be
anonymized
also
still
related,
but
really
interesting.
I've
been
reading
a
lot
of
trends
and
blogs
in
the
industry
and
apparently
high
performing
teams.
A
They
can
kind
of
get
their
wings,
so
the
amount
of
permissions
that
you're
allowed
to
do
in
your
team
has
to
do
with
how?
Well,
your
team
is
performing,
and
so
someone
may
get
permission
to
deploy
to
production
based
on
their
dora
force
score.
If
they're
doing
really
well,
then
their
team
can
deploy
automatically
to
production,
then
they
don't
have
to
go
through
some
manual
approval.
A
We
definitely
should.
I
agree.
I'm
gonna
open
up
an
issue
for
that.
What
what
I
have
been
tracking
right
now,
maybe
I'll,
show
that,
in
the
end
of
the
presentation,
is
actually
how
sorry
about
that,
how
people
affected
how
people
started
using
the
dora
for
metric.
So
we
placed
dora
foreign-
that's
in
my
next
slide,
but
we
placed
door
4
kind
of
in
not
the
best
place
at
the
moment.
A
D
E
So
one
thing
I'm
as
I
think
about
door:
four,
I
wonder
about
what
type
of
customer
where
it
is
most
interested
in
these
metrics
and
the
reason
I
bring
this
up
is
if
it
is
in
my
mind,
it's
usually
more
larger
enterprises
that
want
a
broader
view
across
the
organization
and
if
that's
the
case,
there
are
some
things,
I'm
not
sure.
Gitlab
is
the
best
place
to
capture
or
to
measure
the
metric,
for
example,
time
to
restore
service.
Mptr
is
very
much
a
itil
service
management,
type
of
metric
and
any
large
enterprise.
E
A
So
I've
definitely
spoken
to
enterprises
that
are
that
are
interested
in
this.
Something
that
has
come
up
a
lot
is
that
they
don't
necessarily
want
to
watch,
want
to
view
this
data
inside
gitlab
and
they
might
want
to
export
the
data
outside
of
the
lab
and
we've
been.
We've
decided
to
also
supply
apis
in
addition
to
the
ui,
so
you
can
import
that
into
external
systems.
I've
seen
customers,
especially
in
the
financial
industry,
where
they
have
like
jira
data.
A
They
want
gitlab
data,
they
want
servicenow
data,
they
want
data
from
everywhere
and
they
just
place
it
in
some
monitoring
tool
based
on
the
apis.
So
that's
definitely
been
a
use
case.
I
have
heard
lots
of
customers
also
enterprises
that
they
use
this
tool
to
kind
of
convince
their
bosses
and
why
this
is
important.
A
A
I
think
when
you
look
at
it
our,
as
I
said,
the
primary
persona
that
we're
targeting
is
the
executive
buyer,
but
also
individual
teams
and
team
leads,
are
really
interested
to
see
how
well
they're
performing
and
how
they're
continuously
improving
over
time
for
each
one
of
these
different
metrics,
and
that's
also
really
really
important,
so
the
team
can
benefit
from
it.
The
group
can
benefit
from
it.
The
organization
can
benefit
from
it.
So
it's
a
rather
wide
range.
A
That
moving
on,
so
what
do
we
already
have
supported,
and
so
I
linked
here
speed
run.
It's
also
linked
on
the
issue
that
I
created
to
show
how
you
can
use
these
apis
and
how
to
view
the
metric
in
the
system,
but
I'm
going
to
go
through
it
anyway.
This
is
the
what
the
api
looks
like
for
deployment
frequency.
This
is
already
supported
the
project
level.
A
You
can
see
that
what
we
need
here
is
the
project
id
specifically,
and
then
you
have
the
environment,
so
it
can
be
any
environment
in
the
api.
It
doesn't
have
to
be
production,
and
some
companies
are
really
excited
about
this.
I
just
talked
to
a
prospect
financial
industry,
heavy
on
compliance
and
regulations
and
they're
super
excited
about
having
dora
four
metrics,
but
they
only
deploy
to
production
like
once
a
quarter
because
they
have
all
this
like
red
tape
to
go
through
what
they
like
to
do.
A
Is
they
like
to
test
out
their
upgrades
in
a
staging
whatever
production-like
environment
and
they
bring
down
that
environment
to
whatever
version
production
currently
has,
and
then
they
do
an
upgrade
and
they
test
how
long
it
takes
to
end
to
do
that
upgrade.
So
they
were
super
excited
about
having
this
ability
to
choose
any
environment
they
want
and
any
time
stamp
they
want.
A
The
group
level
deployment
frequency
is
already
available
on
production,
but
it
is
hidden
behind
a
feature
flag.
So
it's
really
not
available.
Unless
you
have
gitlab
admin
permissions
and
then
you
can
turn
it
on
the
plan
is
during
this
milestone
of
1310
to
enable
it
we
did
see
some
performance
issues,
so
we
want
to
solve
that
before,
enabling
the
feature
flag
for
everyone.
A
And
this
is
what
this
looks
like
in
terms
of
the
project
level
chart
this
already
exists
today.
What
you
can
see
is,
as
I
mentioned,
we
didn't
place
it
in
the
its
final
resting
home,
but
if
you
want
to
find
it
today
or
show
anyone
you
can
go
through
under
the
project
analytics
ci
cd,
the
regular
landing
page
is
for
pipelines.
A
We
introduced
a
new
tab
called
deployments,
and
once
we
have
all
four,
this
is
gonna
change
to
door
or
four,
but
at
the
moment
we
only
have
deployment,
so
it
didn't
make
sense
to
call
it
door
four,
so
we
called
it
deployments
and
what
you
can
see
here
is
a
graph
of
the
deployments,
and
these
are
the
fixed
dates.
So
last
week,
last
month,
last
month
and
last
90
days,
you
can
see
there's
a
discrepancy
between
this
and
the
api.
The
api
lets.
A
You
choose
any
timestamp,
and
here
we
hard
decoded
it
because
of
performance
issues.
I'm
sure
we're
going
to
work
on
this,
but
this
is
currently
what
we
show
in
the
far
future.
We
would
let
anyone
choose
whatever
date.
They
want
and
also
the
environment
right.
Now.
This
is
only
showing
production
environment
and
I
think
I
have
a
slide
about
talking
about
production
environment,
but
if
not
I'll
go
back
to
this
and
discuss
it
so
currently,
there's
a
limitation
that,
in
order
to
view
this
data,
your
environment
must
be
named
production.
A
A
This
is
available
on
the
group
level,
and
this
shows
how
many
releases
you
have
in
your
group
of
projects
and
how
many
are
associated
to
releases,
and
why
is
this
semi-related
to
dora
4,
because
it's
the
first
place
we
ever
added
group
level
cicd
analytics.
So
this
is
going
to
be
the
landing
page
for
door
4,
similar
to
what
we
saw
on
the
project
level,
with
pipelines.
A
We
at
git
lab
ourselves,
call
our
production
environment
gprd,
so
we
can't
even
dog
food
it
and
so
there's
a
lot
of
limitations.
So
we
had
some
different
conversations.
One
of
the
ideas
was
to
make
a
regex
option
to
have
anything
that
like
has
prod
in
it,
but
then
we
thought
wait.
Pre-Production
also
has
prod
in
it
or
again.
Gprd
doesn't
follow
that,
so
we
thought
maybe
just
pr,
but
that
just
makes
so
many
false
positives.
A
And
so
what
we're
introducing
in
this
milestone
and
is
a
really
interesting
concept,
is
allowing
you
to
name
your
production
environment,
whatever
you
want,
but
introducing
on
the
yama
level
type.
So
you
can
call
your
en
environment
banana,
but
make
it
a
tight
production,
and
these
graphs
will
and
also
the
value
stream
analytics,
will
align
to
this
as
well.
B
A
So
you're
going
to
have
a
type:
that's
either
staging
or
dead
or
unknown
is
also
okay,
but
a
lot
of
our
features
lean
on
this
naming
convention.
That
really
doesn't
make
any
sense.
So
we
want
it
to
be
as
flexible
as
possible,
not
related
to
dora,
but
this
is
also
going
to
the
first
step
to
introducing
group
level
environments,
so
we're
really
excited
about
it.
B
A
The
idea
is,
we
think
that
you
can't
assume
that
there's
only
one
production
environment,
especially
when
you're
thinking
about
multi-cloud
deployments-
and
I
don't
know
like
just
a
bunch
of
stuff-
a
bunch
of
applications-
have
a
lot
of
production
environments.
So
we
don't
want
to
assume
there's
only
one.
Okay
again.
F
G
A
G
A
G
A
Yes,
so
the
its
original
purpose
was
to
introduce
the
group
level
environment,
which
is
something
that
we've
been
asked
for
for
for
many
customers,
because
at
the
moment,
if
you
want
to
define
a
protected
environment,
it
goes
by
project.
And
so,
if
you
have
600
projects
but
one
production
environment,
you
have
to
define
that
in
each
and
every
one
of
the
product
projects
and
people
are
getting
annoyed
at
it.
Yeah
painful.
G
A
G
A
Yeah,
absolutely,
and
if
any
of
you
hear
anything
from
customers,
please
please
share
the
data
with
me.
The
more
I
learn,
the
better
we
can
deliver.
This
also
customers
when
we
say
dora
4,
they
get
all
excited
and
they
ask
for
a
bunch
of
different
metrics
that
have
nothing
to
do
with
door
for,
and
so
that's
just
a
little
bit
of
a
pitfall
that
we
have
in
every
customer
conversation.
Oh,
but
I
want.
I
A
A
I'm
sure
you're
going
to
have
a
lot
of
questions
when
we
talk
about
tiers,
but
at
the
moment
we
decided
not
to
support
instance,
level
metrics
and
the
idea
that
the
reason
behind
that
is
one
of
our
goals
is
sas.
First
and
sas
is
in
a
disadvantage
in
terms
of
instance,
level
metrics
we
can't
show
it.
A
B
I
think
you
mentioned
a
really
interesting
point
there,
but
very
very
quickly
and
skipped
over
it,
so
just
to
confirm
that
all
of
the
data-
that's
that's
creating
these
charts
is
going
to
be
available
from
the
api
as
well,
because
a
lot
of
the
metrics
we
currently
have
a
lot
of
the
dashboards
we
have
currently
are
not
available
as
api
routes,
and
I've
got
a
lot
of
customers
that
are
asking
about
door,
fours
and
metrics,
but
they
want
to
put
it
into
their
own
metric.
You
know
their
own
dashboard,
you
know
analytics
dashboard
effectively.
A
Yeah,
that's
one
of
the
first
things
I
learned
from
customer
interviews.
They
wanted
a
way
to
export
it,
so
we
did
api
first.
We
also
have
the
front
end
leaning
on
these
apis,
so
it
shortened
the
development
time
in
that
sense,
so
it
made
a
lot
of
sense
to
do
api
first
and
value
stream.
Analytics
today
show
some
of
these
data
as
well,
and
I
think
that
was
a
question
before
and
so
they're
going
to
be
aligning
to
to
our
data
they're.
Also
helping
us
develop
some
of
these
apis.
So.
A
G
A
Not
a
stupid
question
smarter
question:
we're
working
really
closely
on
collaborating
with
optimize
team.
Optimized
team
have
developed
the
value
stream
analytics
I'll,
show
you
what
that
looks
like
after.
I
finish
the
presentation
just
because
I'm
a
little
bit
of
a
zoom
idiot,
and
I
don't
know
how
to
get
back
to
the
presentation
and
to
the
to
the
into
the
product,
but
I'll
remind
you
at
the
end
to
show
you
what
that
looks
like,
and
so
they
have
a
lot
of
this
data,
but
not
in
charts
and
not
in
api.
A
They
have
a
tile
view
where
they
tell
you
deployment
frequency
is
30..
Something
like
that.
So
some
of
this
data
exists,
but
we're
going
to
realign
it,
and
the
idea
is
that,
at
the
end
of
the
day,
the
door
four
metrics
are
supposed
to
be
super
detailed
and
the
value
stream
analytics
is
the
first
maybe
starting
point,
but
you
can
drill
down
into
the
door
of
four
metrics.
So
I
want
to.
A
We
look
at
this
chart
right
here.
We
know
that
there
was
an
appointment
in
december
19
and
in
february
7,
but
we
don't
really
understand
anything
that
happens
in
between.
So
what
we
want
to
do
is
add
to
these
charts.
Annotations
like
here
was
a
deploy,
freeze
and
here
was
a
release
date
and
so
it'll
make
a
lot
more
sense.
When
you
look
at
it
to
understand
at
a
glance
what's
happening
in
in
this
in
this
section
at
all,.
D
A
And
another
thing
that
I'm
we're
really
excited
about
with
dora
4
is
that
it
it's
kind
of
an
entry
point
to
a
bunch
of
hidden
features
like
what
I
like
to
call.
We
have
so
many
great
features
that
gitlab
and
no
one
knows
about
them,
so
we
could
help
customers
improve
their
metrics,
based
on
the
fact
that
we
can
point
them
to
different
things.
So,
let's
say
your
deployment
frequency
is
rather
low
and
there's
a
bunch
of
manual
approvals
or
manual
jobs
in
your
in
your
pipelines.
A
We
could
kind
of
share
that
with
information
with
the
customer
and
say
hey,
it
would
be.
Maybe
you
can
think
if
you
really
need
this
manual
job
or
maybe
you
can
make
a
runbook
out
of
it
and
make
it
maybe
get
more
automatic
and
increase
your
deployment.
Frequency
or
let's
say
your
time
to
restore,
is
really
slow.
We
can
say
hey.
Did
you
know
that
we
have
auto
roll
back?
Why
don't
you
try
enabling
it
or
you
know,
point
into
different
features
that
can
help
them
out
throughout
their
their
workflows.
D
Yeah
the
corollary
to
that
that's
funny.
You
mentioned
that,
because
brian
wald
and
I
were
actually
slacking
on
the
side
about
this-
is
if
people
aren't
using
those
features
like
incidents,
for
example.
I
guess
we
can
try
and
lead
them
down
that
path,
but
it
feels
like
we're
trying
to
force
people
to
use
our
functionality
in
order
to
get
these
metrics.
And
while
I
guess
it's,
it's
optimistic
to
take
the
view
that
people
might
start
using
those
that
functionality.
I
Well,
I
think
that
for
incidents,
it's
it's
particularly
an
interesting
one
right
because
I
think
our
time
to
recover
right,
because
I
think
that's
the
one
that
most
everyone
has
separate
tools
for,
including
gitlab
uses
a
separate
tool
for
that
right.
So
if
we,
I
wonder
if,
because
it's
only
potentially
just
one
of
those
and
a
lot
of
the
other
ones,
I
would
say
realistically,
a
lot
of
people
would
be
using
would
be
there
be
a
future
state
where
we
maybe
could
import
information
into
that.
A
Yeah,
so
absolutely
it
has
been
considered
and
I
don't
want
to
force
anyone
to
do
anything,
but
we
needed
to
decide
where
to
start
from
and
starting
with
the
gitlab
value.
First
was
a
easier
and
b.
You
know
we
kind
of
want
to
do
cross-stage
collaboration
and
get
people
to
get
the
the
best
value
that
they
can
from
a
single
tool.
Having
said
that,
we
absolutely
understand
that
people
are
not
using
gitlab
for
every
single
stage
of
their
devops
pipeline.
A
So
then,
and
we
can
integrate
with
a
bunch
of
tools,
but
we
need
to
find
the
justification
to
do
that
and
also
what
to
start
from.
So
it
really
depends
on
the
feedback
that
we'll
get
from
the
field
and
from
customers
on
what
they
want
to
see.
Another
solution.
I
don't
want
to
jump
to
solutions,
because
I
think
that
the
problem
is
really
interesting,
but
we
can
introduce
web
hooks.
A
That
would
just
create
these
incidents
for
them,
and
then
you
don't
have
to
use
the
incidents,
but
it's
there
to
rely
on
in
terms
of
the
metrics
and
again
a
lot
of
the
customers
that
I
talk
to.
They
don't
even
want
to
see
these
metrics
in
in
gitlab.
They
just
want
a
way
to
export
it.
So
I
don't
know,
that's
just
how
we
decided
to
start,
but
I'm
sure,
as
we
show
this
to
more
people
and
more
people
get
excited,
we'll,
have
more
requests
to
support,
servicenow
or
pagerduty
or
whatever.
J
Out
there
I
have
a
quick
example.
I
had
a
conversation
with
the
customer
yesterday
around
metrics
in
general
value
stream.
Dora
for
everything
and
the
problem
is
that
they're
using
argo
cd
for
deployments
and
it's
the
same
situation
with
incidence
management,
for
example,
but
for
the
deployment
part
of
things,
and
it's
just
that
we
need
that
event
back
in
gitlab,
saying:
hey,
it
was
deployed
successfully
or
not
and
integrate
that
into
everything.
J
A
First
of
all,
vlad
I
would
love
to
be
in
touch
with
this
customer
if
you
can
connect
me
to
understand
why
they're
using
argo
cd
instead
of
gitlab
or
what's
missing.
But
having
said
that,
I
understand
that
a
lot
of
people
are
going
to
choose
external
cd
solutions
door
for
rely
on
deployment
to
production.
This
is
very
much
around
production.
B
B
Nobody
else
can
do
this
because
they
don't
have
that
end-to-end
visibility,
but
we
have
to
have
that
end-to-end
visibility
in
order
to
create
these
metrics
so
like
having
git
lab
and
then
going
oh
you're,
going
to
bolt
on
argo
cd,
I'm
going
to
bolt
on
another
like
pagerduty
as
an
incident
management
tool,
then
you
haven't
got
this
platform
and
then
you
don't
have
that
end-to-end
visibility.
I
I'm
all
for
the
idea
of
hey
yeah.
B
J
Yeah,
that's
true,
but
in
some
cases
the
maturity,
the
product
maturity
isn't
there.
Yet,
while
still
with
some
of
these,
let's
call
them
workaround
or
shortcuts.
We
can
get
value
to
the
customer
quicker
if
you
will
and
what
it
the
plan
was
to
reach
out
to
the
pm
team
and
have
a
session
with
this
customer
to
find
out
more
about
their
use
case.
Get
that
feedback
back
to
the
pm
team.
Yeah
I'll,
follow
up
with
you
on
that.
Thanks.
A
Great
again,
the
dora
for
metrics
rely
on
deployments
and
they
rely
on
environments,
and
if
you
don't
manage
them
and
gitlab,
I
think
it's
going
to
be
a
little
tricky.
I'm
not
saying
impossible,
because
we
can
solve
anything.
But
again.
When
we
have
to
choose
priorities,
it
has
to
have
a
really
good
business
justification.
K
So
one
question
I
have
already
have
you
thought
about
overlay?
I
know
this
graph
specifically
speaks
to
deployments,
but
have
you
thought
about
overlaying
the
development
cadence
with
the
deployment
data
right
because
you
think
about
it?
There's
the
concept
of
like
you're,
always
developing
right
and
then
you're
choosing
to
deploy
on
demand
right.
It
would
be
really
interesting
to
see.
Let's
say
that
skype
lab,
for
example,
right
we
get
gilad
developing
on
a
monthly
cadence
right
and
then,
especially
in
glab.com,
deploying
constantly.
K
A
I
think
the
idea
of
having
staging
or
whatever
environment
the
staging
type,
banana
and
donuts
one
by
one,
could
give
you
that
visibility
as
well.
Absolutely
it's
really
interesting.
We
have
also
metrics
for,
as
I
mentioned
meantime
to
be
merged,
not
not
on
the
door
of
four
but
on
the
value
stream
analytics
side.
So
we
have
a
lot
of
this
data.
I
do
think
at
some
point.
We
need
to
consolidate
everything
to
one
page
and
then
have
people
drill
down
to
whatever
they
want.
A
Cool
okay,
so
timeline,
I'm
sure
all
of
you
are
really
interested
about.
When
are
we
going
to
develop
all
of
this
great
stuff
so
diploma
frequency?
It?
I
put
it
in
green
because
it's
already
supported
and
you
can
already
access
it.
Group
level.
Api,
as
I
mentioned,
is
hidden
behind
the
the
feature
flag,
but
is
available.
A
First
class
production
environments
is
that
concept
that
I
talked
about
having
that
environment
type
in
the
yaml
file.
I
put
it
here,
even
though
it's
not
exactly
directed
to
dora4
but
still
really
interesting,
we're
working
on
it
now
going
forward
lead
time
for
changes.
So
I'll
remind
you,
we
have
the
api
in
this
quarter.
A
In
addition,
optimize
team
is
working
sorry.
This
is
still
releasing
project
level
charts
for
change
failure
rate,
which
is
being
developed
here
in
the
first
quarter
in
api
and
the
optimized
team
is
taking
on
the
second
metric
of
time
to
restore
and
developing
that
project
level.
Api.
So
by
the
end
of
q2,
we'll
have
three
out
of
the
four
api
level
and
two,
no
four
out
of
the
four
api
level
and
two
complete
ones
enter,
including
ui
and
and
failure
rate
will
be
api
and
project
level
charts
in
q03.
A
The
plan
is
to
complete
change
failure
rate,
to
be
everything
and
to
have
project
level
time
to
restore
services
and
by
the
end
of
the
year
we
should
have
everything
all
the
four
metrics,
both
api
project
level
and
group
level,
and
then
we'll
introduce
the
tiers.
So
any
question
about
timeline-
and
you
know
this
is
gitlab,
so
we're
not
committing
to
it.
This
is
our
plan,
but
I
think
we
can
do
it.
G
C
A
Okay,
so
dora
4,
we've
established,
is
super
important.
We
started
with
putting
it
placing
an
ultimate
first
and
the
idea
was
just
to
make
it
simpler
for
our
developers
to
start
developing
something
without
going
into
logic
of
tears,
of
what
they
need
to
start.
You
know
checking
licenses
and
so
on.
We
wanted
to
put
everything
in
place
and
then
we're
going
to
start
opening
it
up
for
other
types
of
users,
and
we
really
want
everyone
to
be
able
to
benefit
from
dora
4..
A
A
So
we
talked
about
this.
Oh,
I
did
have
a
slide
on
about
it.
This
is
what
the
demo
is
going
to
look
like
in
terms
of
of
the
type
sorry,
so
we
have
environment
extension,
the
name
of
the
environment
already
exist,
and
then
the
type.
So
that's
just
what
the
yama
will
look
like
and
there's
a
link
in
the
presentation.
If
you
want
to
check
out
that
issue
as
well.
A
So
for
the
nbc
we
mentioned,
everything
is
going
to
be
under
ultimate.
It
includes
project
level,
group
level,
api
and
ui
for
both
project
level
and
group
level
for
all
metrics
next
year,
we'll
change
this
by
tiers.
So
I
want
to
show
you,
the
mock-ups
and
what
they're
going
to
look
like
unless
there's
questions
before
the
mock-ups.
A
A
A
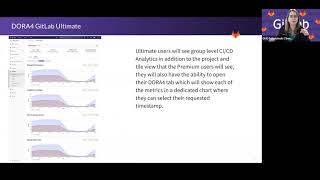
Okay
and
last
but
not
least,
ultimate
we'll
see
everything
that
the
premium
and
core
users
are
seeing,
but
they're
also
going
to
see
the
group
level
deployment,
frequency
and
group
level
deployment.
Frequency
is
really
interesting.
We're
going
to
show
two
things
here
so
at
the
beginning
of
what
we
defined
for
the
mvc
we're
going
to
show
aggregation.
A
So
this
is
going
to
show
the
aggregated
data
of
all
the
deployment
frequency
on
all
the
projects
that
are
associated
to
a
group.
But
what's
really
also
interesting,
is
comparing
different
projects
within
a
group,
and
so
that
data
is
also
going
to
be
available
at
the
group
level,
and
you
can
see
the
different,
the
different
metrics
of
each
project,
individual,
I'm
going
to
pause.
I
H
A
A
A
Yeah,
I
agree,
and
this
is
going
to
rely
a
lot
on
the
feedback
from
you
from
you
all
again.
This
year
is
all
only
going
to
be
an
ultimate,
so
our
decision
to
change
tiers
may
change
next
year
and
that's
going
to
rely
heavily
on
feedback
that
the
field
is
going
to
give
us
on
this.
I
like
the
fact
that
we
are
giving
something
for
every
tier.
A
A
So
there
are
a
lot
of
features
that
I'm
thinking
are
going
to
be
available
only
for
ultimate,
but
it's
since
we're
really
in
nbc
state.
I
I
really,
I
think
it's
important
for
you
to
understand
like
where
my
head
is
right.
Now
what
what
the
plan
is
for
this
year
and
then
you
know
how
we're
gonna
still
deliver
value
in
the
future.
A
K
Just
really
quick,
all
right
and
one
thing
that
I
would
have
it's
a
pm
on
the
forefront
of
my
mind
is
performance.
That's
that
can
be
a
lot
of
data
and
we
know
that
and
then
sometimes,
for
example,
as
sa
we
want
to
like
just
demo
stuff
on.com,
but
there's
so
much
data
it
takes
so
long
to
load
that
it
ends
up
looking
bad
right.
So
just
I'm
sure
you
were
aware
of
that
better
than
I
am.
But
anyhow,
I
just
want
to
point
that
out
the
important.
J
A
And
I
think
that
happened,
because
we
consolidated
the
view
so
that
you
can
just
check
whether
you
want
the
last
week
or
30
days
and
that
used
to
be
three
different
charts.
So
even
though,
like
the
last
one
would
load
really
slowly,
you
still
got
data
on
the
page,
and
now
it
just
does
all
the
queries
together.
So
we're
working
on
performance
in
1310.
A
G
A
B
A
G
F
A
So
it's
actually
managed
not
me.
This
came
up
in
one
of
our
conversations
of
whether
or
not
to
support
this
on
the
instance
level
and
I
think
we
shouldn't
and
the
workspace
kind
of
solves
my
problem.
So
I
was
really
happy
to
hear
that
there's
plans
for
it,
but
I
don't
I
don't
know
I
can
check
customers.
A
Okay,
so
some
of
the
what
the
future
holds
for
door
for
so
we
talked
about
workspace,
or
instance,
level
door
for
gamification.
So
let
me
just
open
this
link.
We
kind
of
talked
about
how
people
want
to
compare.
Why
isn't
any
of
the
link
working
one?
Second
people
want
to
compare
how
they're
performing
versus
others,
so
we
kind
of
want
to
introduce
these
badges
that
tell
you
hey,
you're,
doing
really
well
you're
elite
or
or
not
based
on
others,
so
go
ahead
and
check
out
this
issue.
A
D
A
Then
we
have
benchmark
view
of
similar
companies.
We
talked
about
that
in
product
tips
and
tricks
to
import
improve
performance.
We
also
kind
of
touched
on
that.
How
we
could
help
users
find
the
bottlenecks,
whether
it's
manual
jobs
or
help
them.
You
know
automate
more,
do
auto
roll
back
other
things
like
that.
A
I
think
is
really
interesting
in
the
really
far
future.
We
could
think
about
seeing
even
how
a
ci
cd
pipeline
is
built
in
a
similar
company.
That's
an
elite
and
see
like
what
the
difference
is.
Of
course
we
would
need
some
kind
of
consent
and
anonymization,
but
you
know
just
comparing
the
pipelines
would
be
really
interesting.
We
have
all
this
really
great
data
that
we
can
use
and
help
help
users
out.
A
We
talked
about
ability
to
select
multiple
environments
and
this
one's
really
interesting
export
historical
data
capabilities.
So
we
talked
about
the
fact
that
we
have
performance
limitations
and
at
the
moment,
we're
only
showing
90
days,
for
example,
but
maybe
you're
interested
in
more
so.
The
code
coverage
team
already
has
this
export
capability
for
older
data
into
csv.
H
A
A
D
A
K
D
H
Yes,
thank
you
for
your
time,
or
this
is
actually
super
relevant
to
some
e-learning
courses.
That
field
enablement
is
working
on
for
the
sales
team,
around
gartner's
report
on
value
stream
delivery
platforms.
So
I
actually
plan
to
use
some
snippets
from
this
presentation
for
that.
So
again,
thank
you
for
the
time.
Thank
you
for
those
who
stayed
over
and
we
appreciate
you
getting
to
those
questions
in
the
doc.
If
you
need
anything,
let
me
know,
but
I
hope
everyone
has
a
great
day.