►
From YouTube: Inquiry update for Inbound Marketing recap
Description
No description was provided for this meeting.
If this is YOUR meeting, an easy way to fix this is to add a description to your video, wherever mtngs.io found it (probably YouTube).
A
A
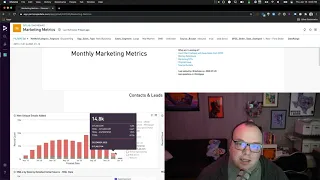
So
that's
when
somebody
enters
their
email
address
and
you
know
signs
up
for
our
newsletter
trial,
anything
where
they
submit
that
information,
that's
an
inquiry,
and
so
I
just
want
to
take
a
second
and
walk
through
where
we're
at
with
inquiries
right
now.
What
we're
seeing
and
some
of
the
trends
there
so
we'll
start
off
looking
here
and
just
looking
at
the
trial
for
enterprise,
which
is
self-hosted
and
then
gitlab.com,
which
is
sas,
and
so
you
can
see
here
our
our
trial,
velocity,
interesting
thing.
A
I
think
here
is
when
you
look,
you
know
last
year,
when
you
look
in
december
december,
was
you
know
about
half
of
where
we
were
at
in
november?
And
then,
when
you
look
this
year,
we
actually
grew
trials
in
december.
So
that's
a
kind
of
a
a
great
indicator
that
we
are
moving
in
the
right
direction.
There
you
know
we're
half
about
halfway
through
january
now,
and
so
this
data
is
through
yesterday.
So
I
anticipate
that
we're
going
to
end
up.
A
You
know,
january
of
this
year
being
very
close
to
what
we
saw
for
december
of
of
the
previous
month
of
december
2020..
So
we
can
look
at
some
other
items
here.
One
of
the
things
that
kind
of
throws
this
chart
off
when
you
look
at
it
right
now
is
when
you
look
at
gitlab.com
signups
there
there's
some
kind
of
it
looks
like
there's
a
bug.
A
That's
not
sending
this
information
to
this
chart
for
some
reason,
so
I'm
gonna
follow
up
with
the
street
the
marketing
strategy
team
and
the
date
the
data
analysts
there
to
see
if
we
can
find
out
what's
going
on
with
this
chart
and
why
those
sign
ups
aren't
showing
up
here
going
back
up,
you
can
see,
you
know,
gated
content
and
some
other
items.
So
let's
turn
this
off
just
kind
of
get
a
better
look
there.
A
You
know
this
is
you
know
people
coming
to
about
gitlab.com
and
signing
up
for
an
ebook,
so
you
know
that
december
drop
is
you
know?
Pretty
expected,
I
think
part
of
you
know
this.
What
we're
looking
at
is,
you
know,
maybe
you
know,
don't
have
a
source
here,
so
I'm
not
sure
if
these
are
coming
from
paid
organic
or
how
these
people
are
ending
up
on
those
resources.
So
there's
always
work.
A
We
can
do
to
optimize
this
to
make
sure
that
you
know
we're
sending
people
from
their
landing
page
to
that
page.
That
you
know
presents
them
with
an
offer.
That's
compelling,
based
on
the
page
content
demo,
take
a
look
here.
You
can
see
same
thing
here,
slide
up
tick
in
december
for
demo
request
and
then
we're
on
track
here
to
already
exceed
demo
for
december
and
november.
A
A
A
lot
of
these,
though,
are
you
know
not
necessarily
you
know
things
that
are
controlled
by
the
websites
like
any
kind
of
purchase
list
or
virtual
sponsorship,
and
for
right
now,
I'm
going
to
mark
this,
this
video
private,
just
because
it
I
did
show
like
gitlab.com
subscription
numbers.
At
least
you
know
what
we
have
in
our
periscope
sisense
dashboard
right
now,
but
I
can
always
make
this
public
if
we
want
to
do
that.