►
From YouTube: gitlab insights
Description
Using GitLab Insights
Learn how GitLab insights can help you understand the status of work and where things were at.
Get in touch with Sales: http://bit.ly/2IygR7z
A
Hey
everyone
Johnny
get
lab,
began.
The
strategic
marketing
I
wanted
to
share
a
little
bit
about
how
you
can
get
insights
out
of
get
lab
and
and
how
your
issues
are
tracking
and
being
managed.
It's
been
a
challenge.
A
lot
of
people
have
asked
me
about
and
there's
some
really
cool
ways
you
can
do
that
and
get
lab,
but
I
want
to
show
you
at
least
one
of
the
ways
we're
doing
in
our
team.
Looking
at
the
status
of
work
and
the
type
of
work,
it's
called
get
lab
insight.
A
So
let
me
dive
in
and
just
show
you
exactly
what
it
is
and
how
to
get
to
it.
If
your
lab
insights
is
a
part
of
analytics,
if
you
look
at
it
and
then
the
under
the
project
analytics
also
exists
at
the
group
level
as
well,
but
I'm
going
to
focus
on
the
project
level
for
the
sake
of
our
discussion
discussion
this
morning.
So
first
off
it's
under
insights
that
I
click
on
insights.
It
brings
up
the
insights,
page
and
I'm
going
to
collapse.
A
The
sidebar
I
don't
want
to
look
at
that
for
the
moment,
and
you
can
see
it's
a
series
of
charts
and
graphs.
We
can
have
bars
stacked
bar
charts
bar
charts,
a
whole
host
different
views.
I'll
show
you
a
line
chart
in
a
second.
This
is
a
view
of
different
issues
that
I've
did
on
an
earlier
video,
where
we're
looking
at
the
status
of
work
in
a
work
flow
from
new
requests
to
triage,
to
assigned
or
backlog
to
when
it's
actually
completed
and
in
product
marketing.
A
Our
team
is
managing
a
number
of
different
kinds
of
work,
and,
and
so
we
wanted
to
look
at
the
kinds
of
issues
that
are
coming
in
and
so
we're
looking
at
just
new
issues
coming
in
and
how
many
issues
the
team
is
getting
on
a
monthly
basis
and
you
can
decide
divide
this
up.
Monthly
daily
weekly
do
those
kind
of
slices,
and
then
we
divide
the
work
further
down.
I'm
gonna
skip
this
these
two
here
we
divide
the
work
DT
under
detailed
and
I
like
scope
labels.
Each
of
these
are
scoped
labels.
A
One
is
work
on
the
web
work
on
collateral
events.
Each
of
these
scoped
labels,
and
if
you
learnt
wanna,
look
about
scope
label
scope,
labels
basically
mean
you
can
have
only
one
of
this
group
of
labels
in
an
issue.
So
if
I
change
it,
if
I
add
a
different
scoped
label,
the
other
one
is
removed.
So
it's
a
only
one
of
those
labels.
A
That
says,
look
everything,
that's
web
or
collateral
or
events
or
AR
or
PR
or
sales
as
external
we're
working
on
things
that
are
external,
and
there
are
some
things
that
we
work
on,
that
are
more
internal
of
helping
the
team,
its
messaging,
its
Dex,
its
research
enablement,
and
so
when
we
did
that
we
create,
we
were
able
to
then
to
us,
assign
some
new
scope
labels
and
in
the
capitalization
matter.
So
I
put
the
capital
M
there,
because
I
wanted
to
just
make
it
different.
A
This
is
external
versus
internal
other,
and
now
we
can
see
the
ratio
of
the
work
we're
doing
and
we
can
also
see
it
in
a
bar
chart,
and
this
is
the
bar
chart
view
of
this
and
I
thought.
Well,
that's
awful
interesting.
What
if
I
wanted
to
look
at
it
from
the
perspective
of
what
are
the
different
kinds
of
things
that
we're
doing
focusing
on
external?
So
we
looked
at
it
a
different
view.
So
this
is
the
external
and
the
other
thing
is
you
can
toggle
these
on
or
off
and
see
them
or
not?
A
But
here
is
this:
this
is
a
view
of
external
initiatives
and
the
distribution
of
things.
We
were
working
on
again,
really
interesting
and
really
helpful
in
leading
and
managing
the
team.
So
the
next
thing
you
might
say,
is
well
that's
great,
but
how
do
I
set
that
up?
Well,
the
first
thing
you
do
is
you
go
search
and
get
you
go
to
the
get
lab
documentation
on
insights.
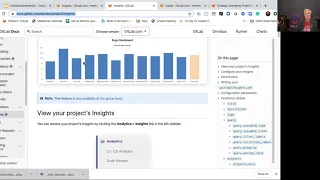
A
Insights
is
available
as
a
feature,
and
you
can
use
this
to
look
at
and
to
slice
and
dice
your
data
and,
as
you
go
through
it,
you
can
configure
this
it's
configured
in
a
yamo
file
and
I'll.
Show
you
ours
that
we're
using
in
strategic
marketing,
but
it's
very
straightforward
to
do.
Let's
go.
Take
a
quick
look
at
that
and
we'll
wrap
up.
A
Okay,
it's
in
our
repository
under
files,
and
it
is
a
file
under
the
docket
lab
folder
and
it
is
called
incites
diamo
and
it
is
a
structure
where
it
simply
is
defining
the
different
things
you
want
to
look
at.
So
you
see
the
the
query
with
the
different
labels
of
what
type
of
thing
you're
gonna
look
at,
whether
it's
a
merge
request
and
its
status,
whether
it's
closed
or
open,
and
then
what
are
the
subsets?
What
are
the
buckets?
You
want
to
look
at
how
frequently
we
do
you
want
to
group
it.
A
So
this
defines
one
chart
real,
straightforward,
real,
simple,
this
section
up
here.
It
defines
the
sections
of
the
chart
that
you
want
to
show.
So
all
of
us
defined
in
this
in
this
llamo
file
saved
and
committed,
and
then,
when
you
go
ahead
and
run,
get
lab
insights,
it
reads
the
file
and
builds
charts
for
you.
Pretty
awesome,
I'm
real
excited
about
how
it
helps
us
do
our
work
and
how
we're
working
using
it
to
get
things
done.
We're
improving
this
all
the
time.
A
It's
an
a
minimum,
viable
change,
one
step
after
other,
makes
it
better.
So
if
you're
interested
in
learning
more
here's,
a
quick
link,
that'll
take
you
to
the
documentation
on
get
lab
insights.
If
you're
interested
I
urge
you
and
encourage
you
to
go,
play
a
play
with
it
and
try
it
out,
but
with
that
that's
a
wrap
and
have
a
great
day,
and
please
please
contribute
everyone
can
contribute.