►
From YouTube: GitLab Performance Bar Tips and Tricks
Description
No description was provided for this meeting.
If this is YOUR meeting, an easy way to fix this is to add a description to your video, wherever mtngs.io found it (probably YouTube).
B
Okay,
so
yes,
today,
I'm
gonna
talk
about
the
performance
bar,
it's
a
very
useful
tool.
They
are
used
in
the
past
and
still
use
when
I
need
to
work
on
some
of
the
performance
issues.
So
let's
get
started
so.
First
of
all,
we
have
a
documentation
page
about
the
performance
bar
yeah
feel
free
to
review
it.
It
has
some
like
some
information
about
what
means
what
but
I
think
we're
gonna
go
through.
All
of
this
points,
all
of
these
features
of
the
performance
bar
and
see
how
it
works.
B
So,
first
of
all,
if
you
don't
have
performance
bar
enabled
you
can
use
this
keyboard
shortcut,
P,
plus
b.
So
let's
say
we
have
like
a
GitHub
page
I,
press,
p
and
B.
Okay,
wait
a
bit
and
the
performance
bar
appears
nice.
So
let's
take
a
look.
What
we
have
here
so
first
part
it's
a
number
of
the
SQL
requests,
so
the
number
here
is
how
long
it
takes
to
execute
all
of
them.
Second
number:
it's
a
number
of
the
SQL
request
that
we
had
to
had
to
execute
to
show
this
page.
B
If
you
click
on
that,
we
see
a
list
of
requests
like
sorted
by
the
duration,
so
the
heaviest
request
should
be
on
the
top,
and
here
you
can
see
the
request
itself.
If
you
want
to
know
from
where
the
request
is
like
coming
from,
you
can
take
a
look
on
the
spec
Trace,
so
it's
pretty
useful.
For
example,
if
you,
if
you
notice
that
the
page
is
slow,
you
can
take
a
look
like
and
see
so
one
of
the
first
of
the
requests
might
be
one
of
the
biggest
problems
in
some
cases.
B
It's
not
about
the
one
heavy
request
it.
We
might
have
a
problem
with
n
plus
one
request.
So
let's
say
instead
of
like
loading
all
of
these
users,
and
we
have
like
thousand
users
of
the
page
instead
of
issue
and
one
request
we
make
1000
requests
so
for
that
there
is
usually
there
is
like
a
notification
that
appears
on
the
performance
bar
that
something
is
wrong.
You
have
too
many
of
the
requests,
but
what
I
do,
let's
say?
B
I
just
like
check
the
list
of
requests
and
if
I
see
some
like
patterns
repeating
patterns,
then
I
just
like
check.
Okay,
maybe
that
can
be
the
problem,
so
you
can.
Let's
say
you
can
select
some
part
of
the
request
like
that
and
see
okay,
so
it's
only
one
occurrences.
So
it's
probably
not
this
request,
but
let's
say
we
have
some
like
select
users,
for
example.
Let's
see
so
we
have
two
of
these
requests,
as
the
Search
tool
shows
to
me.
B
So
that's
the
first
part
about
the
postgres.
Second
part
that
might
also
contribute
a
lot
to
the
performance
of
the
page
is
Tech
Italy.
So
if
you
click
on
that,
we
see
okay,
we
have
three
calls
here
and
we
see
the
name
of
the
call.
We
can
also
check
like
from
where
this
call
was
issued
and
have
some
like
extra
information
about
that
and
again
I
like
there
are
some
pages
that
depend
on
the
gitly
heavily.
B
B
Usually
redis
is
not
a
problem,
but
sometimes
it
can
be
so
it's
kind
of
the
same
idea.
You
see
a
list
of
the
registry
quests
and
yeah.
If
you
notice
something
weird,
then
you
can
also
get
keeper.
So
this
Performance
Tool
is
kind
of
good
good
starting
point.
If
you
have
like
a
performance
issue
working
on,
so
you
can
just
start
open
the
page
and
take
a
look
probably
like
after
some
time.
B
You
will
notice
something
weird
and
it
will
be
a
good
starting
point
of
point
for
your
investigation,
so
other
parts
they
don't
really
use
because
they
mostly
related
to
the
front
end.
For
example,
this
one
show
some
of
the
front-end
related
information.
How
long
it
takes
like
to
fetch
some
assets,
so
I
usually
don't
rely
on
this
one,
so
don't
load
I,
think
you
can
just
download
all
of
this
information
as
I
like
CSV
file
or
Json
file.
B
Also
I.
Don't
use
that.
Then
this
field
is
kind
of
useful
because
sometimes
for
our
page
we
may
issue
multiple
requests
and,
for
example,
we
are
not
interested
in
the
request
that
loads,
the
main
page.
But
you
will
we
have
some
of
the
dynamic
requests
triggered
by
the
JavaScript
that,
for
example,
fetch
some
of
the
extra
information,
for
example
this,
like
lock
screen,
and
if
you
click
on
the
logs
tree,
then
it
refreshes-
and
you
can
see
the
information
about
this
particular
request.
B
So
when
you
investigate
so
pay
attention
to
what
request
you
are
investigating
into
because
it
might
not
be
always
the
default
one,
it
might
be
one
of
the
extra
requests
that
we
issue
to
fetch.
Some
of
the
extra
information
on
the
page
and
I
think
the
most
not
the
most
interesting
but
kind
of
useful
part
that
I
used
a
lot
for
occasion.
I
see
you
have
a
question
I.
B
Part
and
I
refresh
the
page,
so
we
have
our
main
gitlab
request.
So
this
request
the
get
request
to
the
gitlab
and
the
information
connected
to
this
request.
We
see
right
now,
but
let's
say
we
have
this
graphql
request
this
one
that
gets
the
last
commit
information
to
see
information
about
this
request.
We
click
we
find
it
here
in
the
list
and
then
we
see
what
do
we
need
to
get?
How
many
like
SQL
queries?
We
executed
how
many
Italy
requested
triggered.
So
we
have
this
information
for
this
particular
request.
A
B
Got
it
correct
so
yeah
we
have
some
of
the
dynamic
parts
and
these
Dynamic
Parts
triggered
by
JavaScript
when
the
after
the
page
is
loaded
or
on
some
user
action.
For
example,
if
you
have
some
extra
request
on
click,
then
you
will,
you
can
click
on
something
and
then
you
will
see
the
new
request
appeared
here.
Got
it.
A
B
You
so
yeah,
okay,
you're,
welcome
and
another
interesting
part
that
I
used
a
lot
when
I
was
investigating
the
Bonsai
performance
issues.
So
just
a
few
words
about
the
bonsai
for
our
markdown
documents.
We
have
a
special
tool
that
allows
us
to
convert
the
markdown
representation
into
some
kind
of
like
a
rich
content,
so
you
replace
the
links
with
the
actual
links.
B
So
when
we,
for
example,
have
like
a
hashtag
number
of
the
issue,
the
Bonsai
tool
will
replace
it
with
the
actual
issue,
link
and
we'll
put,
for
example,
the
name
of
the
issue
on
it
on
on
demand
and
so
on,
and
this
part
usually
causes
some
problems,
because
it's
quite
heavy
and
there
are
some
particular
files,
one
of
them
at
this
changelog
file.
As
you
can
see,
it
contains
lots
of
lots
of
links
and
loading.
This
file
was
quite
a
problem
and
I
think
it's
still
a
problem
because
it's
kind
of
grows
indefinitely.
B
So
we
have
lots
of
the
information
about
it.
It's
not
properly
rendered
right
now,
I
think.
It's
not
sure
why
I
think,
because
the
size
of
this
file
got
so
big,
so
we
kind
of
stopped
doing
that,
but
if
it
renders
then
it
will
be
lots
of
links
and
to
understand
like
what's
going
on,
because
sometimes
it's
not
clear.
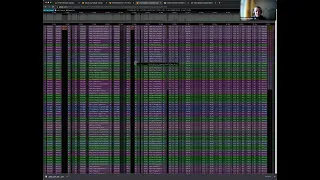
We
have
the
flame
rod
so
flame
graph,
I
already
loaded
it
because
it
might
take
a
long
time
by
default.
B
It
looks
like
that,
and
it
shows
you
the
time
the
code
spent
in
every
in
every
module
in
every
function
and
by
default,
so
in
time
order
I,
don't
use
it
because
it's
we
have
lots
of
the
repetitions
here.
I
prefer
to
group
the
stuff
together
by
clicking
link
heavy,
and
here
we
can
have
some
information.
So
overall
it
took
like
around
like
28
seconds,
to
load
this
page
and
basically
starting
from
the
top
or
actually
a
30
seconds,
starting
from
the
top.
We
see
some
of
the
like
Puma
thread
request.
B
So,
that's
not
really
not
something
that
I
pay
attention
to
I,
usually
scroll
down
here,
I
see
this
kind
of
Separation,
so
we
have
like
a
main
thread
of
the
execution
and
then
we
have
several
different
parts
of
the
code.
Different
functions
that
execute
so,
for
example,
here
what
we
have
it's
a
part
of
the
Bonsai
and
it's
kind
of
separated
in
two
parts,
so
to
optimize
that
I
was
looking
into
different
execution
flows.
B
For
example,
I
can
try
to
think
about
like
what
can
we
optimize
here,
so
it
takes
22
seconds
and
64
percent
of
the
request,
so
significant
amount
I
think
it's
a
good,
optimization,
Target
and
let's
see
what
we
can
do
here.
So
if
you
look
further
here,
I
see
some
of
the
active
record
each.
So
it's
a
signal
for
me.
B
So
one
of
the
IDS
can
be
like
to
improve
the
database
query
by
loading,
less
data
or
like
or
I,
don't
know
what
we
can
do
as
well.
Maybe
checking
the
going
back
and
checking
the
query
itself.
That's
actually
how
the
query
looks
like
and
maybe
looking
for
some
of
the
optimization
yes
optimization
ideas.
What
we
can
do
about
that
it
can
be
one
of
the
options
indexes
indexes.
Yes,
but
I
think
for
this
particular
case,
it's
kind
of
an
exception.
B
It's
like
you
actually
need
all
of
this
information
about
all
of
the
merge
requests,
because
you
need
to
know
if
they
actually
exist
and
you
need
to
know
some
extra
information
about
the
merge
request,
merch
request
name,
for
example,
to
build
their
necessary
links
and
so
on
what
else?
There
are
some
parts
that
might
not
be
related
to
the
database
but
might
be
close
to
the
code
itself.
So
yeah
I
see
a
question.
C
Yeah,
it's
to
no
sorry,
I
missed
the
beginning
of
the
of
the
meeting.
I
was
kind
of
distracted,
but
like
for
the
for
the
Bonsai
thing,
do
we
need
to
know
if,
like,
for
instance,
the
Mr
existed
at
this
point
in
time
or
do
we
need
to
know
it
if
it
existed
all
every
time?
It's
it's
actually
checked
and
every
time
the
the
markdown
is
actually
checked.
C
B
C
A
B
B
So
it's
kind
of
so
we
have
like
a
code
that
executes
some
other
code
and
some
other
code,
so
it
starts
from
the
top
on
the
top.
We
have
Puma
that
deals
with
the
request.
So
most
of
the
time
contributes
to
the
Puma,
because
everything
that
happens
it's
inside
of
this,
like
Puma
execution
flow
and
then,
if
you
like
scroll
down,
we
can
see
okay.
So
now
we
have
like
some
brag
taking
a
part
of
that.
B
We
have
some
like
rails,
like
active
dispatch,
active
support,
Sentry
and
it
kind
of
takes
less
and
less
time,
so
you're
kind
of
going
from
the
very
general
piece
of
code
that,
let's
say
at
any
point
of
time
we
can
see.
Oh
we
can
say:
okay,
we
are
inside
of
this
code
flow
to
some
of
the
smaller
flows
that
happen
inside
of
this
process,
so
just
to
be
precise,
for
example.
So
we
start
with
the
Puma
here,
then
we
go
to
the
rails.
At
some
point,
then
we
start
rendering
some
some
templates.
B
For
example,
here
we
use
like
action
view
renderer.
It
happens
inside
of
the
Puma
flow,
but
it's
kind
of
a
smaller
piece
of
that
and
get
smaller
and
smaller
and
smaller,
and
we
kind
of
get
into
the
like
smaller
details.
So
here
it's
already
like
a
bonsai
logic
of
the
representation,
but
it's
included
into
the
Puma
flow
included
inside
of
the
rails.
For
so
and
the
problem.
B
A
No,
no,
that
makes
sense.
Sorry,
no!
It's
just
more.
The
visual
I
understand
that
it's
the
stack
of
this
like
the
contact
or
whatever,
but
I
just
don't
understand.
Looking
you
know
in
rooms
like,
for
instance,
if
you
take
the
row
above
the
one
you've
selected,
I,
don't
understand
as
we
look
right
along
the
graph.
What
are
they
now
nested
calls,
or
so
I
understand
vertically,
that
they're
within
each
other,
but
then
horizontally
I,
don't
understand.
Okay,.
B
I
see
I
see
so
what
it
means.
For
example,
we
have
this
perform
field,
filter
function
and
inside
of
this
perform
filter
function.
We
call
the
reference
filter.
Call
it's
like
one
of
the
functions
that
called
inside
of
that
and
another
function
is
pipeline.
Filter
call,
so
we
have
like
two
functions
inside
of
one
and
we
have
like
okay
and
it's
kind
of
splits,
splits
and
splits
to
the
smaller
pieces
and
sometimes
on
the
edge
of
these.
Like
smaller
pieces,
you
can
see.
Oh
yeah
might
have
some
like
sanitize
transform.
B
C
Okay,
yeah
follow-up
questions
to
Gavin's,
okay,
so
the
horizontally,
those
are
sub.
The
Sub
sub
calls
yep
found
this
thing
correctly,
but
where
are
those
gaps
in
between
is?
Is
it
not
supposed
to
be
like
all
failed
in
because
it
represents
how
much
the
main
query
along
the
main
query
has
been
taken
to
to
finish.
A
C
B
Part,
okay,
yeah,
so
here
it's
kind
of
it's
maybe
like
a
representation
thing,
but
sometimes
one
of
those
like
final
functions
of
this,
like
call
stack,
it
just
occupies
like
lots
of
time.
So
it's
let's
say
it's
like
a
final
function.
It
does
some
heavy
processing
and
it's
on
the
same
level
as
a
load
records
per
parent,
but
load
parents,
Locker
load
records
per
parent,
actually
execute
some
other
like
sub
functions.
B
C
Maybe
it's
like
a
metaphor
like
a
paint
job
like
we
have
multiple
function
called,
and
some
of
them
has
a
long
stack.
Some
of
them
has
a
deeper
stack.
Some
of
them
have
a
bit
shorter
stack,
so
like
10
functions
were
executed
and
some
of
them
have
have.
Some
of
them
have
like
five
function
in
it.
Nested
some
of
them
have
three
functions:
nested
in
it
so
and
exactly
this
one.
Maybe
it's
like
executed
and
some
nested
functions
and
then
did
some
job
on
their
own,
and
so
that's
why
it's
yeah.
C
B
But
I
think
it's
the
right
guess,
I
think
because
of
the
like
functions
have
like
different
some
functions.
Some
of
them
have
like
zero
sum
functions,
and
it's
like
a
final
one.
It
will
just
take
less
based
on
this,
like
graph,
some
of
them
that
have
like
some
more
internal
functions
inside
of
the
functions,
they
will
be
yeah.
A
B
A
B
C
B
A
C
Yeah,
it's
probably
something
that
should
be
checked
because
I
think
for
go
for
go
or
Services.
We
have
like
a
go
profiler,
but
it's
actually
a
feature
for
Google
Cloud
platform
and
it
actually
allows
us
to
view
their
calls
like
like
this
yeah,
but
for
this
particular
graph,
yeah
I
think
we
like
perform
things
in
Flight
if
it's
enabled
and
then
display
it,
because
actually
I've
introduced
one
thing,
which
is
maybe
not
very
useful,
but
it's
on
development
environment.
C
Only
now,
if
you're
not
familiar
with
bullet
them,
which
allows
you
to
detect
n
plus
ones
yeah,
when
the
development
we
actually
have
also
have
a
section
which
is
called
bullet,
and
if
we
have
n
plus
one,
we
can
click
and
it
shows
which
which
records
were
inefficiently
loaded.
But
this
feature
is
only
enabled
on
development,
because
maybe
it's
too
risky
usually
usually
maintain
this
suggest,
enabling
it
only
on
development.
That's
why
you
haven't
enabled
it
on
production,
so
just
to
avoid
some
unexpected
results.
A
A
And
redis
I
said
it's
all
our
data
stores
it's
interesting
because
I
was
wondering
we
don't
have
a
representation
of
shell
or
Workforce
that
a
lot
of
traffic
will
go
through
those
I
guess.
Shell
would
be
I,
guess
probably
not
on
this,
because
we're
not
accessing
it
through
the
UI
but
yeah
I.
Guess
clear
course.
Maybe
we
would
look
at
editing
Workhorse
at
some
point.
A
B
One
more
thing
I
wanted
to
add:
before
we
wrap
up,
there
is
a
plus
sign
which
is
kind
of
useful,
because
you
can
provide
your
your
request.
For
example,
if
you,
for
example,
we
have
this
API
request
like
that,
provides
a
list
of
projects
to
us
and
we
want
to
understand.
What's
going
on,
we
can
copy
this
request.
We
can
go
to
any
page
that
have
that.
Has
this
performance
bar
you
can
click
plus
sign
paste,
it
click
enter
and
then,
after
some
time
we'll
see
this
request.
B
A
B
A
Great,
thank
you
so
much
specially.
It
was
a
really
a
really
great
follow-up
to
the
other
tools
that
you
showed
us
with
cabana,
and
that
was
really
really
useful
information,
because
a
lot
of
people
don't
know
how
to
use
some
of
these
tools.
That's
really
really
awesome.
Thank
you.
So
much
you're
welcome.
Thank
you.
I'll!
Stop
the
video!
Thank
you.
Thank
you.