►
Description
No description was provided for this meeting.
If this is YOUR meeting, an easy way to fix this is to add a description to your video, wherever mtngs.io found it (probably YouTube).
A
So,
let's
directly
jump
into
the
first
session,
I'm
pleased
to
welcome
ryan
and
marcelo,
which
are
working
on
kubrick
performance
and
are
leading
the
sick
group
there
in
kubert,
and
they
want
to
tell
us
today
a
little
bit
about
cubert
scale
and
performance
with
six
scale,
ryan
and
marcelo.
It's
your
turn.
B
All
right,
thanks,
roman,
so
scale
and
performance
with
sixth
scale,
so
marcelo
and
I
are
gonna-
walk
through
a
few
things
that
I've
been
working
on
in
sixth
scale
and
in
the
area
of
scale
and
performance
all
right,
so
we're
gonna
start
first
with
the
the
story
behind
sixth
scale
and
where
it
all
started.
So
sixth
scale
was
kind
of
it
started.
Actually
as
a
conversation
that
we
were
having
internally
at
nvidia.
B
We,
we
really
began
looking
at
trying
to
find
if
you
know,
measure
performance
of
of
the
bmis
and
we
started
by
by
creating
you
know.
You
know
a
tool
that
will
will
create
500
vmis
and
it
will
measure
a
few
things
and
take
some
data
points
and
so
on
and
what
we
did
is
we
took
the
data
that
we
got
from
this
tool.
B
This
was
kind
of
where
it
started
and-
and
we
have
what's
what's
pictured
here-
is
they
create
a
running
time
of
vmis
and
split
up
between
pods
and
bmis,
so
the
the
vert
launcher
pod
is
the
dotted
line
and
the
solid
line
was
the
the
vmi
and
so
we'd
measure.
You
know
when
you
know
when
every
launcher
pod
would
go
to
running
and
when
the
vmi
would
go
to
running,
and
we
saw
that
there
was
this,
this
gap
between
them
and
we
thought
that
was
interesting.
B
We
you
know
we
obviously
want
to
have.
We
want
to
see
how
fast
we
can
make
these
vmis
go
from
crate
to
running
so
you
know:
what
can
we
do
better?
What
can
we
changes?
Can
we
make,
and
so
we
we
started
off
making
a
few
changes,
and
you
know
we
measured
again
and
those
changes.
We
found
that
this
green
line
here
that
we
actually
moved
the
lines
and
the
graph
left,
which
is
cool.
That's
what
we
wanted.
You
know
we
were
able
to
see.
B
B
Theoretically,
you
know
we
should
be
able
to
have
vmis
go
to
running
pretty
quickly,
with
a
very
similar
amount
of
time
that
the
pods
go
to
running
for
the
vert
launcher,
pods
go
to
running,
and
so
we
so
we
have
these
questions
and-
and
you
know,
even
even
some
more
like
you-
can
see
the
the
slopes
of
these
lines
like,
for
example,
the
pod
slopes
fairly
linear.
That's
the
it's
been
fairly
consistent,
whereas
the
vmi's
they
vary
quite
a
bit
almost
kind
of
speed
up
as
like
more
were
created.
B
So
there's
a
lot
of
questions
that
we
had
and
we
kind
of
took
this
conversation
and
we're
having
some
of
the
code
that
we
had.
We,
you
know,
went
discussed
with
the
community
and
this
is
really
where
it
all
started.
You
know
we
there's
a
lot
of
interest
in
this
and
we
saw
that
there
was
some
the
work
that
could
be
done
and
it's
improvements
that
maybe
we
could
make.
So
we
decided
you
know.
Okay,
maybe
we
can
meet
regularly
and
really
continue
this
conversation,
so
this
is.
B
This
is
how
six
scale
started
and-
and
we
came
up
with
some
goals
that
we
want
to
accomplish
with
this
with
the
sig,
we
want
to
analyze
keyword
component
scalability.
You
know
this
is
important.
You
know
we
have
computer
as
a
control
plane.
We
want
to
know
how
well
it
can
scale.
We
want
to
learn
how
kever
can
more
efficiently
use
kubernetes,
also
very
important
cubert's,
an
extension
of
kubernetes.
B
So
as
since
it's
a
guest
on
the
platform,
you
know
we
we
can
affect
how
the
how
pods,
how
fast
they
can
come
up,
and
that's
also
really
important
for
for
us.
You
know,
because
we
depend
on
pods
right
in
cubert,
so
it's
it's
important
that
you
know
we
don't
you
know,
affect
them
in
any
way
and
and
that
and
that
will
directly
impact,
not
only
us
and
our
ability
to
scale
and
perform,
but
even
other
people
that
are
on
the
platform
using
using
pods.
B
So
the
word
began
was
like
I
said,
with
questions
and
conversations,
so
we
start
to
try
and
answer
some
of
these
questions,
and
so
we
began
with
you
know
like
with
with
what
like
what
is
you
know?
What
are
the
steps
that
a
vmi
takes
from
going
from
creation
to
running?
We
wanted
to
enumerate
this
and
we
built
this.
B
We
spent
some
time
building
this
this
chart
and
you
can't
see
a
lot
of
details
because
there's
a
lot
going
on
there
and
this
chart's
actually
merged
into
the
into
the
cube
repo,
and
if
you
want
to
see
it
in
more
detail,
you
can
check
it
out
on
that
link,
but
it
goes
through
all
the
steps
that
a
vmi
will
go
through.
All
the
phases
even
goes
down
to
the
function,
level
call
out
some
functions.
That
will
happen
that
it
goes
through
in
the
code.
B
All
the
components
that
it
goes
through,
the
handoffs
the
phases,
what
they
mean
and
what
to
expect.
So
this
really
served
as
a
guide
for
us
in
this
initially.
So
you
know
if
we
wanted
to
have
conversations
but
specific
parts
of
the
code
base
or
just
areas
that
we
sought
were
that
we
might
have
some
ideas
of
what
what's
going
on
there,
maybe
they're,
slow
or
maybe
there's
something
that
could
be
identified
as
an
issue
or
something
we
wanted
to
just
puddle
up
around
we'd
have
this
diagram,
and
so
this
was
great.
B
We
know
we
could
have
you
know
we
now
we
understand.
Okay,
what's
going
on
with,
you
know
the
phases,
so
you
know,
let's,
let's
see
what
you
know,
what
else
we
can
do,
and
now
we
we've
had
some.
You
know
kind
of
this
understanding
of
phases.
You
know
we
want
to.
We
actually
want
to
measure
this.
This
was
some
cool
work
that
was
done
as
in
the
community.
We
had.
B
We
want
to
measure
the
the
crate
to
running
time
of
of
vmis
and
like
we're
doing
in
that
graph,
with
the
with
our
own
tool.
We
wanted
to.
Maybe
there's
a
better
way
to
do
this,
and,
and
so
the
we
there's,
though
we
came
up
away
with
with
this.
This
pull
request,
adding
a
feature
so
that
we
can
actually
measure
this
and
have
it
actually,
this
data
export
to
prometheus.
B
So
we
can
create
some
some
cool
graphs
around
it,
and
we
also
wanted
to
do
this,
so
we
can
see
how
long
specific
phases
took.
So
this
is
great.
You
know
we
can.
We
can
take,
you
know
not
only
like,
so
we
can
do
all
sorts
of
different
measurements
for
it
and
we
also
build
tooling
around
it,
because
this
is
actually
on
the
status
phase.
B
You
can
see,
there's
this
phase
transition
time
stamp,
and
this
is
the
the
time
stamp
that
we
record
when
the
vmi
went
into
the
pending
phase,
and
so
you
can
do
what
you
can
do
is
if
you
want
to
measure
how
long
we
spend
in
a
in
a
specific
phase,
you
can
subtract
two
of
them
like.
If
you
want
to
know
how
long
we
were
spent
in
scheduling
phase,
you
could
subtract
the
schedule
in
the
scheduling
timestamp,
so
53,
minus
29
comes
out
to
24
seconds
they'll
be
spent
in
scheduling,
phase.
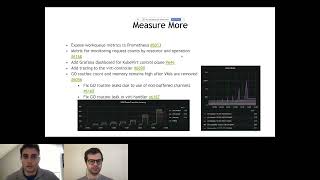
B
So
we
also
spent
a
lot
of
time
on
measuring
more.
You
know
we
there's
a
bunch
of
work
done
to
add
more
metrics,
so
we
found
you
know.
Prometheus
was
our
friend
we
wanted
to.
We
wanted
to
use
it
to
expose
these
metrics
and
we
wanted
to
use
grafana
to
actually
visualize
them,
and
this
became
something
that
we
centered
a
lot
of
our
work
around.
We
add
more
metrics,
we
can
run
more
tests.
We
can
then
look
at
the
dashboards,
and
then
we
can
talk
about
them.
B
So
we
would
spend
a
lot
of
time
actually
in
our
meetings.
We'd
talk,
we'd,
look
at
dashboards
from
experiments
and
see
if
we
can
find
interesting
things
and
it
did
yield
a
lot
of
interesting
conversations
and
some
we
in
some
cases
found
some
interesting
bugs
and
as
an
example
of
a
good
example
of
one
here,
and
this
was
a
a
go
routine
leak
that
we
found
when
we
were
exposing
these
metrics
and
actually
analyzing
them.
This.
B
You
know
graph
that
looks
similar
to
this
one
at
the
bottom
of
the
vmi
phase
transition
latency,
where
we
have
an
increase
and
then
we
go
back
to
baseline
and
then
increase,
go
back
to
baseline
and
and
then
we
looked
at
our
go
routines
and
we
found
that
the
baseline
actually
increased,
even
as
there
were
no
vmis
running,
which
is
a
surprise.
We
would
expect
that
this
purple
line
would
actually
descend
back
to
where
it
started,
which
is
almost
around
the
200
range.
B
B
We
can
take
those
and
we
can
set
expectations
about.
You
know
how
long
these
first
machines
should
take
to
actually
go
from
crate
to
running
and
and
also
you
know,
we
can
find
some
bugs,
and
this
was
a
fairly
recent
one.
We
saw
you
know
the
get
node
request
is
high.
You
know
on
the
right
here.
This
is
where
we're
measuring
the
the
number
of
of
requests
that
we're
making
to
the
api
server
create
requests
gets
patches.
You
know
these
things
are
important
for
scale.
B
We
want
to
make
sure
we're
not
making
too
many
of
these,
and
so
we
know
we
can
see
with
you
know
with
create
requests.
We
have,
you
know
around
100
crate
requests
and
you
can
see
like
things
like
update
virtual
machine
instances,
an
account
you
know
which,
roughly
like
a
nine
to
one
relationship
which
is
to
be
expected,
because
you
know
we
vmis
go
through
different
phases,
scheduling
pending
scheduled
running.
We
expect
updates,
but
there
are
some
things
that
we
don't
expect
and
we
don't.
B
We
don't
want
ratios
to
be
too
high
and
we
saw
one
that
was
a
little
bit
interesting
and
seemed
a
little
out
of
place
was
to
get
notes
count
in
over
five
minutes.
In
this
test
we
create
100
bmis
and
we
have
548.
Footnotes
count
seemed
a
little
bizarre,
so
we
have.
We
have
created
a
book
to
actually
record
that
and
something
we
want
to
investigate.
C
Yep
thanks
ryan,
and
so
when
we
started
also
to
discuss
the
performance
of
kubevir,
especially
for
the
upstream,
what
we
say
you
know
the
code
that
it's
being
merged
to
the
you
know
the
extreme
repository
we.
We
also
had
the
question
about:
what's
the,
how
is
the
performance
being
affected
by
change
in
the
code?
C
So,
given
that
we
decide
to
create
a
performance
cluster-
and
I
will
give
some
details
about
that,
so
the
cooperate
cicd
system
has
the
pro
and
external
clusters.
Okay,
so
the
pro
clusters-
they
it's
scheduling,
you
know
jobs
from
the
pro
control
plane
cluster.
You
can
see
here
that
has
like
for
contour,
plane
and
workload
that
itself,
you
know,
meaning
the
names
so
that
the
counter
plane
schedule
jobs
and
runs
functional
tasks,
end-to-end
functional
tasks
in
the
workload
cluster,
okay,
and
we
have
other
two
clusters.
C
Now
there
is
a
arm
cluster
and
a
performance
cluster,
so
the
pro
control
plane
also
schedule
jobs
that
runs
runs
jobs
in
one
of
the
the
cluster
can
be
in
the
control
plane
workload
both
and
this
job
actually
access
a
external
cluster
and
run
tests
in
this
external
cluster.
Okay,
so
that's
what's
happening
behind
the
scene
here
and
the
external
cluster:
it's
not
it's,
not
creating
a
dedicated
cluster
could
be
virtu
ci
cluster,
so
in
the
functional
tests
it
creates,
you
know,
creates
a
vm
with
kubernetes.
C
You
know
cluster
inside
this
vm
and
runs
the
functional
test.
So
in
the
performance
cluster
we
don't
want
to
create
things
inside
the
vm.
You
know
and
run
tests
with
nested
virtualization.
We
want
to
run
all
the
tests
directly
to
the
bare
metal
for
performers.
You
know
perspective,
so
that's
why
we
are
not
creating
an
internal
cluster.
It's
running
directly
to
the
kubernetes
cluster
and,
however,
just
have
a
drawn
back,
which
means
we
cannot
run
multiple
jobs
at
the
same
time,
so
they
are
installing.
C
You
know
installing
convert
running
the
task,
and
then
you
know
installing
and
unemploying
cover,
so
only
one
test
can
run
at
the
same
time.
Yes-
and
this
needs
to
be
taken
account
when
creating
performance
jobs
to
run
there,
and
we
have
also
a
parameters
stack
deployed
in
a
graphene
dashboard.
The
dashboard
has
the
contour
plane
dashboard.
That
ryan
talked
before
and
also
other
several
dashboards.
That
is
well
known
for
kubernetes.
You
know
you
see
resource
and
performance.
C
Can
you
yeah
okay,
great
thanks
so
right
now
you
know
ryan
already
introduced
that
we
have
a
performance
job
that
was
created
before
and
then
we
have
other
two
mars
that
are
running
the
performance:
cluster.
Okay,
so
again,
the
the
the
performance
jobs
is
should
to
try
to
see
some
performance
regressions
in
the
code,
not
only
check
the
performance.
How
is
it
right
now,
but
I
also
see
how
it
will
change
you
know
continuously
when
we
see
updates
in
the
code.
So
we
have.
C
We
first
introduced
a
performance
job
that
runs
as
a
functional
test.
It's
running
the
workload
cluster
with
all
the
functional
tests
and
it's
great
100
vmis,
is
the
one
that
ryan
was
showing
before
that
we
we
got
some
interesting.
You
know
information
from
that.
It's
actually
generates
load
as
a
functional
test
as
well,
and
then
we
have
another
kind
of
jobs
that
runs
in
the
performance
cluster.
C
However,
it's
using
another
tool
to
generate
the
load
to
create
the
vmis
and
that
we
have
internally,
you
know
in
the
comfort
code
also
that's
called
per
scale
load
generator
and
we
have
another
job
that
it's
kind
of
trying
to
test
some.
You
know
variations
of
number
of
dmis.
I've
not
call
this
scale
test
because
it's
a
small
cluster.
It
only
has
three
master
nodes
between
worker
nodes,
but
it's
a
performance
cluster.
C
C
So
we
have
a
a
lot
of
you
know
metrics
there
that
we
are
always
discussing
the
six
scale
meetings
and
and
to
understand
performance
and
and
see,
probably
you
know,
problems
and
and
bugs
that
might
be
happening
as
ryan
mentioned
before.
So
just
this
job
here
it's
creating
100,
vmi
and,
and
then
we
can
see
here.
C
You
know
interesting
things
that,
like
the
99
percentile
of
vm
creation,
time
from
the
metric
that
ryan
explained
before
here
is
to
create
100
mi,
it's
less
than
one
minute
to
create
the
vm
in
the
worst
case
99,
and
we
can
see
others
metrics,
like
virtual
controller.
It's
doing
you
know.
Sev
put
operations
per
vmi
and
also
the
vert
handler
has
many
failed
post
operation?
Okay,
so
we
you
know,
I
just
want
to
show
here.
C
C
You
know:
what's
it's
the
behavior
of
the
what's
its
you
know,
involved
in
the
latency
of
creating
the
vmi
and
and
also
things
that
we
see,
for
example,
although
it's
already
a
small
experiment
in
a
small
cluster,
we
can
see
some
performance
like
the
api
request
right.
You
know
a
number
of
write
requests
here.
We
have,
for
example,
set
seven
put
operations
per
vmi
when
we're
creating
up
to
500
vmis.
C
B
Okay,
so
we're
going
to
talk
about
some
features
that
our
future
we
we've
worked
on
in
sixth
scale
and
there's
a
link
to
the
design
proposal
here.
This
this
feature
is
pretty
cool
the.
What
it's
meant
to
do
virtual
machine
pools
is
it's
supposed
to
give
you
the
ability
to
manage
a
group
of
similar
vms.
B
This
is
kind
of
like
a
high
level
abstraction
that
you
see
in
a
lot
of
infrastructure
as
a
service
providers,
and
they
take
large
amounts
of
vms
and
they
kind
of
want
them
to
be.
You
know
they
group
them
together
in
their
life
cycle
or
whatever
it
is
that
you
create
them
together,
and
you
can
have
an
easy
way
to
manipulate
the
number
of
account
or
whatever
it
is
about
those
virtual
machines.
What's
interesting
is
like
this,
this
you
can
visualize
this.
B
This
idea
of
virginia
pool
it
kind
of
sounds
similar
to
a
deployment.
It
is
fairly
similar,
but
there
are
some
differences,
and
one
of
them
is
that
I
use
the
word
similar
vms
and
so
I'll
explain
I'll,
explain
that,
because
the
vms
are
going
to
have
they'll
be
very
similar
in
their
spec
and
their
outlook
right.
They
may
have
a
similar
number
of
cpus
cores
and
memory,
and
things
like
that.
B
But
there's
going
to
be
things
that
make
them
unique
and
we
and
we
want
to
be
able
to
express
those
things
and
I'll
explain
those
in
the
in
the
futures,
and
the
other
thing
is,
is
that
there
is
they're
stateful
and
and
that's
that
that'll
also
explain
in
the
features.
So
the
some
of
these
are
actually
work
in
progress
and
I've
marked
them
as
a
star
as
some
things
that
are
still
being
worked
on.
B
But
this
feature
was
recently
merged
into
something
that
it's
an
alpha
and
you
can
try
it
yourself.
So
the
first
one
is
so
being
able
to
manage
replication
of
stateful
vms
at
scale.
Virtual
machine
tools
provide
us
that
that
ability
we
want
to
be
able
to
have
a
replica
count
or
whatever
that
we
can
set
increase
and
decrease
and
easily
wait
to
manage
these.
We
want
automated
rollout
of
spec
changes
and
other
updates,
so
you
know
we
have
a
spec
of
a
of
a
virtual
machine.
B
B
So,
third,
we
have
automated
and
manual
scale
out
skill
in
so
this
is
kind
of
a
very
similar
behavior
of
what
you
see
in
a
lot
of
you
know,
like
I
said
deployments,
you
know
when
you
can
have
a
group
of
virtual
machines.
You
can
change
the
number
of
replicas
from
five
to
ten
or
from
ten
to
five,
but
what's
interesting
about
this,
is
you
know
when
you
take
a
number
of
virtual
machines
and
you
change
it
from
ten
to
five?
B
Well,
this
is
where
you
have
a
decision
to
make,
and
this
is
where
the
the
word
staple
comes
in.
Is
that
these
vms
we
expect.
Is
that
the
to
have
some
control
over
that
we,
you
know
what,
if
you
have
workloads
on,
if
you've
got
10
vms
and
you
want
to
bring
it
to
5,
you
might
have
a
customer
running
on
five
of
those
vms,
so
we
want
to
make
a
choice.
We
want
to
be
very
deliberate,
of
which
vms
we
want
to
remove.
B
So
we
want
to
have
that
control,
automated
replacement
of
virtual
machines.
You
know
if
they're,
not
passing
health
checks
over
deleted,
so
replacement
of
virtual
machines,
and
then
you
know
the
ability
to
specify
unique
secrets
and
config
map
data
per
vm.
This
is
where
you
know
we
use
the
word
similar
vms,
that
they
have
a
lot
of
similarities,
but
things
that
they
will
be
unique,
maybe
like
cloud
in
it:
data
user
data
things
like
that.
B
There's
some
concepts
that
we'd
like
rvms
to
have
uniqueness
about
them,
and
so
there
are
certain
fields
that
that
can
be
unique
per
vm.
Well,
there
are
certain
ones
that
will
be
the
same
and
then,
lastly,
the
ability
to
detach
from
vm
from
a
vm
pool.
So
maybe
forensics
wanted
to
analyze
something
you'd
attach
it,
and
then
you
maybe
do
some
work
on
it.
Decommission
and
automatically
gets
replaced
in
the
pool.
B
B
We
want
some
want
to
generate
a
scale
test
that
we
can
hand
to
users
to
actually
do
some
measurements,
some
scales,
a
complicated
thing
and
as
well
as
performance
and
having
users
ability
to
measure
their
their
performance
and
scale
actually
help
us
generate
these
slos
performance
and
scale
producing
a
job.
You
know
we
want
to
be
able
to
test
code
that
gets
checked
in
for
its
ability
to
scale
and
prevent
its
then
its
performance,
and
then
you
know,
lastly,
generate
some
statistics
about
about
these
things
in
a
cuba
release.
B
B
A
B
A
C
A
A
B
Yeah,
certainly
yeah-
I
mean
these
all
things.
These
things
start
they
play
a
role.
We've
we've
talked
about
it
in
another
in
some
of
our
meetings.
You
know,
because
any
area
that
could
affect
how
a
vmi
goes
from
you
know,
created
to
running.
You
know
we
want
to
measure
as
much
as
we
can
and
that
can
affect
that
can
affect
it.
So
definitely.