Description
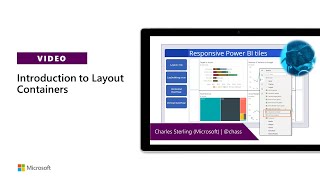
In this 5-minute citizen ceveloper-focused demo, Charles Sterling inserts multiple chart - Power BI tile controls into a row container. The arrangement of controls in the container is manipulated in the reference example’s left nav (columnar container) consisting of 4 toggling buttons - column/row, wrap/no wrap, allow/not allow horizontal and vertical overflow (scroll bars or not). See Daniel Christian’s demo on this same date on how to make static tile content refreshable inside a container. This PnP Community demo is taken from the Microsoft Power Apps community call - February 2021, recorded on February 17, 2021.
Demo Presenter: Charles Sterling (Microsoft) | @chass
Supporting documents:
• Blog post - New Layout containers in canvas apps make responsive apps easier | https://powerapps.microsoft.com/en-us/blog/new-layout-containers-in-canvas-apps-make-responsive-apps-easier/
• Documentation - Power BI tile control in Power Apps | https://docs.microsoft.com/en-us/powerapps/maker/canvas-apps/controls/control-power-bi-tile
Stay connected:
• Twitter https://twitter.com/microsoft365dev
• YouTube https://aka.ms/M365DevYouTube
• Blogs https://aka.ms/M365DevBlog