Description
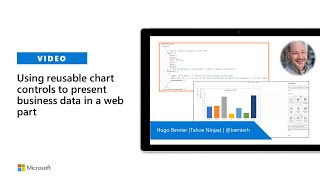
During this 11-minute Developer-focused demo, Hugo Bernier shares a robust web part sample that uses PnP Reusable ChartControl to add theme aware, responsive fluent UI integrated charts (20 charts) to your web parts. You may use plugins for custom rendering or for showing continuous data feed in a chart. This “Chartinator“ control pulls static or dynamic data into your web part. You are able to define chart colors, type, layout, legend, animations in the properties pane. This PnP Community demo is taken from the SharePoint Framework and JavaScript Special Interest Group (SIG) – Bi-weekly sync call recorded on February 25, 2021.
Demo Presenter: Hugo Bernier (Tahoe Ninjas) | @bernierh
Supporting materials:
• Website - JavaScript charting for designers & developers | www.chartjs.org
• Samples - Chart Control Samples | https://github.com/pnp/sp-dev-fx-webparts/tree/master/samples/react-chartcontrol
• PnP Samples - Samples by JavaScript Framework | https://aka.ms/spfx-webparts
Learn more:
• Learn more about the Microsoft 365 Patterns and Practices community at: http://aka.ms/m365pnp
• Visit the Microsoft 365 Patterns and Practices community YouTube channel: https://aka.ms/m365pnp-videos