►
From YouTube: 4th PAWS Webinar
Description
The fourth webinar from the Paleoclimate Advances Webinar Series (PAWS) which took place on July 8th 2022.
Lily Hahn discussed "Mechanisms of polar-amplified warming" and Eli Tziperman discussed "Cloud feedbacks that may help explain observational constraints on continental Eocene climate"
For more information and to signup for the PAWS Google Group visit:
https://www.cesm.ucar.edu/events/webinars/paws/
B
Okay,
great,
let's
get
started
hello.
Everyone
welcome
to
the
paleoclimate
advances
webinar
series.
Before
introducing
today's
speakers,
I
would
like
to
briefly
remind
people
our
code
of
conduct
and
the
format
of
the
webinar.
By
joining
this
webinar,
you
agree
to
follow
our
code
of
conduct
during
the
webinar.
Please
consider
new
ideas,
encourage
innovation,
offer
constructive
feedback,
acknowledge
teamwork,
show
appreciation
and
share
the
air.
The
webinar
has
two
talks.
Each
talk
has
20
minutes
with
five
additional
minutes
for
q
and
a
in
the
end.
We
will
have
about
10
minutes
for
general
discussion.
B
I
will
give
a
two
minute
reminder
for
each
speaker
just
to
keep
us
on
track.
Our
co-host,
professor
bronwyn
konecki
today,
will
help
us
moderate
the
q.
A
if
you
have
questions
for
the
speakers
please
either
type
them
in
the
chat
box
or
use
the
right
hand
function.
As
always,
we
welcome
speaker
nomination.
You
can
fill
out
the
nomination
form
on
our
webpage
or
contact
anyone
on
the
organizing
community.
B
He
has
done
important
and
influential
work
on
the
equivalent
climates
and
many
other
fundamental
questions
in
climate
dynamics.
Professor
zipperman
has
recently
published
a
book
entitled
global
warming,
science,
a
quantitative
introduction
to
climate
change
and
its
consequences.
Please
check
it
out
if
you
are
interested
without
further
ado.
Let's
start
the
webinar
with
lily
han.
I
will
stop
screen
sharing.
B
C
C
So
looking
first
at
historical
and
near
surface
temperature
trends,
we
can
see
in
these
observationally
based
data
sets
this
pattern
of
having
greater
warming
in
the
arctic
than
in
the
tropics
or
in
the
antarctic,
which
has
had
some
historical
cooling
in
these
datasets
and
if
we
define
a
polar
amplification
as
the
near
surface,
warming
north
of
60,
divided
by
the
global,
mean
warming.
This
gives
a
factor
of
3.5
in
the
arctic,
for
polar
amplified,
warming
and
in
the
antarctic,
there's
been
slower.
C
Warming
compared
to
the
the
global
mean
giving
a
smaller
factor
there.
So
how
does
this
look
in
the
latest
generation
of
climate
models
here?
I'm
showing
the
ensemble
mean
of
sum
of
six
models,
looking
at
historical,
near
surface
temperature
trends,
and
we
see
similar
patterns
of
having
stronger
warming
in
the
arctic
compared
to
the
rest
of
the
planet.
C
Although
the
sensible
mean
overestimates
the
warming
at
all
other
latitudes
in
the
arctic,
compared
to
the
observations,
and
so
as
a
result,
there's
underestimated
factor
polar
amplification
and
this
symmetrics
ensemble
mean
compared
to
the
observations
for
the
arctic
and
it
actually
overestimates
antarctic
warming
compared
to
the
observations
but
generally
getting
this.
This
observed
pattern
of
having
arctic
amplified
warming
and
weaker
warming
in
the
tropics
and
antarctic.
C
So
how
does
this
compare
to
intermodal
spread
and
internal
variability
here,
I'm
showing
in
the
yellow
shading
the
range
of
intermodal
spread
versus
map
six
and
then
in
the
dashed
orange
lines,
a
measure
of
internal
variability.
Looking
at
this
esm2
large
ensemble,
two
standard
deviations
plus
or
minus
compared
to
the
zoom
of
six
mean,
and
so
we
can
see
that
these
observed
warming
trends
in
black
largely
fall
within
this
range
of
intermodal
spread
and
internal
variability.
C
C
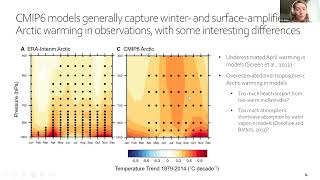
If
we
look
at
the
seasonal
and
vertical
structure
of
warming
for
observations,
or
this
observationally
based
re-analysis
data
set
compared
to
sum
of
six
in
the
arctic,
we
can
see
that
the
models
also
generally
capture
these
patterns
of
having
winter
amplified,
warming
and
also
surface
amplified.
Warming
with
weaker
warming
aloft
and
in
summer
there's
some
interesting
differences
between
the
models
and
observations.
C
So
the
models
are
missing.
This
april
peak
in
warming,
that's
found
in
observations,
although
the
the
observations
do
fall
within
the
intermodal
spread
and
internal
variability
for
a
single
model
for
april,
but
I
think
that's
sort
of
an
open
question
of
why
the
models
underestimate
this
april
warming
in
the
arctic
near
the
surface
and
the
models
also
have
overestimated.
C
Mid-Tropospheric
arctic
warming
compared
to
observations
for
this
latest
generation,
and
this
could
be
related
to
having
too
warm
of
temperatures
in
the
mid-latitudes,
which
would
lead
to
too
much
heat
transport
from
the
mid-latitudes
to
the
upper
atmosphere
in
the
arctic
and
yeah.
That
could
that
could
support
this
overestimated
temperatures
aloft
in
the
arctic.
C
So
to
do
that
I'll
switch
to
some
more
idealized
experiments
with
abrupt
co2
quadrupling
and
I'll
show
averages
centered
on
year,
100
after
co2
quadrupling
compared
to
pre-industrial
control.
Experiments
here
we're
looking
at
near
surface
warming
in
these
experiments
versus
latitude,
and
we
can
see
in
symbolic
five
and
seven
six
models.
As
in
the
historical
warming
patterns.
We
see
the
arctic
amplification
of
warming
and
now
we're
also
seeing
antarctic
amplification.
But
we
still
see
this
hemispheric
asymmetry
of
greater
warming
in
the
arctic
than
in
the
antarctic.
C
So
we
split
up
the
the
plank
feedback
into
a
global
mean
blank
response
and
the
local
deviation
from
that
global
mean
and
then
divide.
Everything
by
the
global
mean
plank
feedback,
and
this
gets
to
units
of
kelvin.
And
if
we
rearrange,
we
can
express
the
total
near
surface
warming
in
the
arctic
as
coming
from
different
contributions
from
feedbacks
forcing
an
atmospheric
and
ocean
heat
transport
as
well
as
a
residual
term.
C
So
we'll
look
at
each
of
these
different
factors
in
this
next
plot
and
here
we're
looking
at
how
each
factor
contributes
to
tropical
warming
versus
arctic
warming.
So
there's
this
one
to
one
line
and
if
a
factor
is
farther
away
from
that
line
in
the
upper
left
triangle,
it's
contributing
more
to
arctic
amplified
warming.
C
So
you
can
see
the
lapse
rate
and
albedo
feedbacks
are
contributing
most
to
arctic
amplification
in
these
models
in
summit
5
and
student
6,
and
this
is
consistent
with
previous
studies
and
just
for
a
reminder
on
the
lobster
feedback.
This
is
based
on
having
these
base
state
near
surface
temperature,
inversions,
so
really
stable.
Temperature
profiles
that
inhibit
vertical
mixing
and
they
trap
under
co2.
Forcing
this.
This
warming
is
trapped
near
the
surface.
C
Another
thing
we
did
here
was
to
separate
the
atmospheric
heat
transport
into
a
moist
and
dry
component,
and
so
we
can
see
as
a
result
of
doing
that
that
increased
latent
heat
transport,
this
moist
atmospheric
heat
transport,
is
the
third
largest
contributor
to
arctic.
Amplified
warming
in
these
models
and
one
way
to
understand
that
increase
in
latent
heat
transport
is
through
a
diffusive
perspective
of
flame
energy.
C
So
this
is
looking
at
vertically
integrated,
specific
humidity
times
the
latent
heat
of
vaporization
for
the
pre-industrial
control
and
abrupt
four
times
co2
experiment
and
then
also
their
difference
on
the
bottom.
And
we
can
see
that
the
tropics
as
a
result
of
starting
out
warmer
have
a
greater
increase
in
latent
energy
than
at
the
pools.
And
this
gives
this
increased
equator
to
pole,
gradient
and
in
latent
energy
that
results
from
a
diffusive
perspective
and
increased
moist
atmospheric
heat
transport
to
the
arctic
under
co2.
C
Forcing
if
we
switch
perspectives
to
looking
at
arctic
versus
antarctic
warming
and
these
hemispheric
gas
imageries.
We
can
see
that
most
of
these
factors
contribute
to
stronger
warming
in
the
arctic
than
in
the
antarctic
and
particularly
the
lobster
feedback.
So
a
lot
of
papers
have
looked
at
this
asymmetry
and
we
argue
in
hanadal
2020
that
the
lobster
feedback
is
weaker
in
the
antarctic
as
a
result
of
antarctic
elevation.
C
But
more
details
are
in
this
paper
and
other
papers
for
that.
Another
interesting
feature
here
is
that
the
moist
atmospheric
heat
transport
is
one
of
the
only
things
that's
actually
contributing
more
to
antarctic
warming
than
arctic
warming,
and
we
can
see
that
this
is
the
largest
contributor
to
antarctic
warming
here.
C
So
that's
one
possibility.
It's
also
possible
that
having
all
these
other
more
negative
feedbacks
like
the
cloud
feed,
the
shortwave
cloud
feedback
and
the
antarctic
could
contribute
to
greater
moist
atmospheric
heat
transport
to
the
antarctic
as
a
result
of
having
this
greater
equator
to
pull
gradient
and
radiation.
C
So
some
interesting
differences
between
the
arctic
and
antarctic.
Here
I
will
just
end
this
project
by
looking
at
the
intermodal
spread
in
an
arctic
warming,
but
we
found
similar
results
looking
at
the
antarctic
as
well
for
this,
so
we're
showing
how
each
warming
contribution
its
variants
and
on
the
on
the
diagonal,
as
well
as
covariance,
between
warming
contributions,
and
this
is
looking
across
models.
C
C
So
if
you
have
greater
warming
in
a
model,
there's
more
of
a
reduction
in
atmospheric
dry
heat
transport
to
the
pools
which
stamps
that
arctic
warming
and
damps
the
intermodal
spread-
and
I
really
like
this
figure-
because
it
shows
that
these
different
mechanisms
are
are
connected
and
also
shows
that
it
can
be
helpful
to
use
more
idealized
experiments
to
try
to
pick
them
apart
and
look
at
interactions
between
them,
which
I'll
talk
more
about
in
the
second
second
paper.
I'll
talk
about.
C
But
first
to
summarize
this
first
section
we
looked
at
contributions
to
polar
warming
and
hemispheric
asymmetry
and
saw
the
lobster
and
albedo
feedbacks
are
pretty
key
for
greater
warming
in
the
arctic
than
the
tropics
or
antarctic
and
also
moisture.
Transport
is
an
important
contributor
to
antarctic
warming,
and
then
we
just
saw
that
intermodal
spread
is
amplified
by
the
albedo
feedback
and
its
covariance.
C
Having
peak
warming
early
on
shifting
to
late
winter
later.
In
these
experiments
to
understand
these
patterns,
some
mechanisms
that
have
been
proposed
are
seasonal,
ocean
heat
storage
and
ice
insulation
effects,
as
well
as
long
wave
cloud
and
temperature
feedbacks
that
peak
in
winter.
But
here
I'll
focus
on
this
mechanism
of
having
increasing
effective
heat
capacity
of
the
surface
layer
as
you
transition
from
ice
to
open
ocean.
C
So
how
how
this
mechanism
works
is
that
there's
the
ocean
mix
layer
has
a
large
effect
of
heat
capacity
as
a
result
of
having
this
thick
layer
of
water.
That's
coupled
to
surface
heat,
fluxes
and
melting
sea
ice
also
has
a
large,
effective
heat
capacity
because
all
of
the
energy
that
you
add
goes
towards
latent
heating
to
melt
ice
rather
than
raising
the
surface
temperature,
in
contrast
to
open
ocean
or
melting
sea
ice
frozen
sea
ice
has
a
small,
effective
heat
capacity
and
acts
like
a
shallow
mixed
layer.
C
But
this
is
just
one
of
many
different
mechanisms
that
have
been
proposed
so
to
try
to
pick
these
apart.
We
used
a
single
column
series
model
and
also
some
idealized
experiments
and
a
gcm
to
test
out
this
mechanism,
so
I'll
focus
just
on
the
single
colon
model
here
and
comparing
the
single
column
model
to
cesm2
that
we
were
just
looking
at,
but
here
at
90
degrees
north.
C
We
can
look
at
these
seasonal
patterns
of
warming,
so
looking
at
temperature
surface
temperatures
for
different
forcings
and
also
the
anomalies
for
each
forcing
compared
to
the
pre-industrial
control
or
zero,
forcing
experiment,
we
can
see
that
the
single
column
model
generally
captures
the
seasonal
pattern
of
having
greater
warming
in
winter
than
summer
and
peak
warming
and
early
shifting
to
late
winter
and
in
the
single
column
model.
You
have
frozen
ice
for
temperatures
less
than
zero
and
then
melting
ice
for
temperatures
equal
to
zero
and
open
ocean
for
temperatures
greater
than
zero.
C
But
even
if
we
keep
the
oops
sorry,
even
if
we
keep
the
ice
depth
constant
and
the
conductive
heat
flux
in
this
model-
and
we
have
constant
warming
over
frozen
ice.
Simply
transitioning
from
ice
to
open
ocean
will
give
this
pattern
of
peak
warming
in
early
winter
shifting
to
late
winter.
So
this
suggests
that
this
is
kind
of
a
fundamental
feature
of
having
the
surface
layer
shift
from
ice
to
ocean
and
having
that
increasing
effect
of
the
heat
capacity,
but
to
try
to
explicitly
model
those
changes
in
effective
heat
capacity.
C
We
used
an
even
simpler
version
of
this
model
where
we
had
no
cs
and
only
an
ocean
mixed
layer
and
constant
ice
albedo,
and
we
just
wanted
to
model
these
different.
Effective
heat
capacities
of
the
surface
layer,
so
here
we're
again
looking
at
surface
temperatures
and
changes
in
surface
temperature
compared
to
a
stereo,
forcing
experiment
and
we're
representing
the
small,
effective
heat
capacity
of
frozen
ice
with
a
shallow
mix
layer
and
then
the
larger,
effective
heat
capacity
of
open
ocean
with
a
deeper
mixed
layer
here.
C
C
C
But
just
to
add
this
to
the
summary,
we
saw
that
increasing
effective
heat
capacity
of
the
surface
layer
can
alone
produce
the
seasonal
pattern
of
arctic
warming.
Although
there's
also
other
factors
contributing
to
seasonality
in
the
arctic,
yeah
I'll
just
leave
up
the
summary,
but
thanks
for
listening
and
happy
to
take
questions.
D
A
C
Yeah,
I
think
that's
a
big
question
of
like
why
the
the
model
to
observation
differences
in
the
antarctic
and
there's
like
many
different
possibilities,
including
like
internal
variability
as
part
of
that,
so
I
think
it
might
be
less
about
the
the
moisture,
the
atmospheric
heat
transport
and
more
about
ocean
circulation
there,
that
the
models
aren't
capturing.
But
I
think
that's
like
a
huge
open
question
of
like
what
exactly
has
been
going
on
in
in
the
past.
A
D
We
have
a
question
in
the
chat
which
I
can
read
out
loud
from
alex
thompson
who
says.
Thank
you
for
the
nice
talk.
You
showed
that
albedo
was
a
much
stronger
feedback
for
the
arctic
than
for
the
tropics.
Do
you
think
future
changes
in
arctic
vegetation,
such
as
boreal
forest,
overtaking
tundra,
I.e,
lowering
albedo,
will
lead
to
an
even
even
larger
warming
asymmetry
between
the
arctic
and
the
tropics.
C
C
B
C
Sure
yeah,
so
I
think
nicole
feldel
and
robin
bakey
have
more
work
on
this,
but
at
least
specifically
looking
at
like
the
albedo
and
lobster
feedback,
I
think
people
think
that
the
causality
is
sort
of
just
the
the
sea.
Ice
changes
are
what's
most
important
and
then,
if
you
have
greater
sea
ice
loss,
that
gives
you
a
stronger
both
a
stronger
albedo
feedback
and
also
more
as
a
result
of
that
and
just
the
base.
The
the
sea
ice
loss
itself.
C
Having
greater
near
surface
warming,
gives
you
this
this
stronger
lobster
feedback
so
yeah.
I
think
the
like
root
cause
of
that
all
is
the
sea
ice
loss
and
they've
looked
into
into
that
a
lot.
So
it's
kind
of
like
picking
a
part,
that'll
be
done.
Laptop
feedback,
maybe
doesn't
make
so
much
sense,
since
they
definitely
interact
and
the
lobster
feedback
is
dependent
on
the
albedo
feedback
yeah.
So
that's
one
example,
and
then
I
think
for
the
causality
of
the
dry
heat
transport.
I
think
it's
the
like
a
response
to
arctic
warming.
C
So
if
you
have
more
arctic
warming,
you
have
less
less
of
a
like
equator
to
full
gradient
and
dry
static
energy,
so
you
that
reduces
your
dry
heat
transport
to
the
to
the
arctic.
As
a
result
of
that
yeah
there's
a
lot
of
different
things
to
look
at
here,
though,
with
the
different
interactions
so
yeah,
I
think
some
more
idealized
experiments
can
be
helpful
too.
D
B
D
E
Great,
I
hope
you
can
hear
me:
okay,
nice,
so
I'd
like
to
talk
about
equitable
climate,
explain
what
the
challenge
is
and
suggest
two
ideas
for
for
explaining
these
challenges
with
equivalent
climate
in
particular.
This
is
based
on
mostly
the
work
of
dorian
abbott
when
he
was
a
student
and
and
tim
cronin
when
he
was,
I
posted
with
me
a
few
years
ago.
E
So
here's
the
main
challenge.
In
the
present
day.
You
look
at
any
of
the
northern
states
of
the
united
states
and
you
have
these
events
of
arctic
air
that
is
coming
from
canada,
very
cold
temperatures.
This
is
the
specific
event
in
2014,
and
this
is
from
some
weather
tv
station,
and
you
see
that
with
windshield
temperature
is
minus
40
to
minus
65.
E
E
E
So
what
you
see
here
is
temperature
of
the
deep
ocean
as
function
of
time.
This
is
the
present.
This
is
60
million
years
ago.
This
is
the
eoc,
and
you
see
that
the
deep
ocean
temperature
is
estimated
to
have
been
about
12
degrees
celsius
and
because
the
deep
water
temperature
is
determined
at
the
high
latitudes.
It
means
that
the
high
latitudes
were
very
warm.
E
This
is
strengthened
by
this
picture
right
here,
so
there's
a
proxies
and
mostly
fossil
evidence
of
things
like
crocodiles
and
palm
trees
and
other
plants
and
animals
that
cannot
sustain
sub-freezing
temperatures.
So
you
know
if
the
temperature
goes
down
below
freezing
for
a
night
or
two
palm
trees
can
survive
and
crocodiles
and
alligators,
and
so
on
can
survive.
The
numbers
are
right
here
and
define
the
fact
that
we
find
fossils.
Of
these,
things
vary
at
very
high
latitudes.
E
Whenever
there's
a
black
dot
basically
means
that
the
temperature
in
these
areas,
such
as
in
green
river
wyoming,
which
is
a
famous
fossil
site.
The
temperature
in
these
areas
never
went
below
freezing
for
millions
of
years,
and
that
is
the
challenge.
How
could
it
be
that,
even
in
the
coldest
day
of
the
winter,
for
me
for
thousands
and
millions
of
years,
the
temperature
never
drops
below
freezing,
and
this
is
in
the
middle
of
the
continent,
far
away
from
the
moderating
effect
of
the
ocean.
E
So
this
is
the
challenge,
we're
trying
to
explain
how
could
these
things
survive
and
how
could
the
temperature
not
go
below
freezing
even
briefly
for
such
a
long
time,
so
I'd
like
to
propose
to
a
two-part
answer,
part
one
based
on
these
papers.
Is
that
what
happens?
Is
you
have
marine
air
coming
from
the
ocean
very
moist
in
a
warm
climate,
the
ocean
would
be
very
warm.
This
marine
air
goes
over
the
continent.
E
Then,
by
the
time
it
leaves
the
the
continent
it's
replaced
by
other
warm
and
moist
air.
That
creates
these
clouds
and
these
clouds
are
what's
forming.
So
that's
part,
one
of
the
answer
that
I'll
try
to
explain
part
two
has
to
do
with
the
arctic.
If
the
arctic
is
ice
covered,
then
air
coming
from
the
arctic
won't
be
moist,
because
it
won't
be
able
to
absorb
moisture
from
the
ocean.
E
So
we
have
to
make
sure
that
the
arctic
is
ice
free
in
an
equitable
climate
and
the
second
mechanism,
I'll
propose,
is
convective
cloud
feedback
that
creates
a
greenhouse
effect
during
winter
time
that
prevents
the
arctic
from
freezing
in
in
an
equivalent
climate.
So
this
is
the
two
part
answer
again:
low
clouds
keep
the
continent
warm
and
and
the
convective
clouds
keep
the
arctic
ice
free
and
allow
this
moist
air
to
form
in
order
to
later
cover
the
continent.
E
Okay,
so
part,
one.
Is
this
arctic
s,
air
suppression,
by
low
cli
cloud?
So
let
me
explain
this
is
the
work
with
team
cronin.
So
let
me
explain
this,
so
we
start
by
taking
a
simple
single
column
model
worth.
Basically,
if
someone
cares-
and
we
pretend
that
this
represents
an
air
column
starting
over
the
ocean
and
moving
over
the
continent,
the
day
is
zero
and
it's
moving
over
the
continent
where
there's
no
shortwave
radiation,
because
it's
winter
time.
So
this
is
the
temperature
profile
of
the
model
at
t
equals
zero
at
day
equals
zero.
E
E
So
this
is
the
process
of
arctic
air
formation.
Now
this
air
is
then
adjected
from
canada
to
the
united
states
and
and
might
have
killed
these
dinosaurs
and
at
the
earlier
phases,
or
later,
the
the
palm
trees
and
crocodiles
and
so
on.
So
what
happens
in
a
warmer
climate?
So
this
is
the
same
simulation
same
single
coil
model
except
this
time,
we're
assuming
that
the
ocean
is
a
20
degree
we're
taking
an
extreme
to
see
what
happens.
So
this
is
day
zero.
E
This
single
column
model,
the
surface
is
a
20
there's
some
lapse
rate
and
then
we
need
within
the
first
day,
this
cools
again
by
10
degrees.
So
it's
still
a
very
significant
cooling.
But
then,
if
you
see
day
two
day,
four
and
so
on,
there's
hardly
any
cooling
going
on
and
the
reason
there's
no
cooling
in
this
case
is
that
clouds
are
formed.
The
clouds
are
denoted
by
these
green
patches
here.
So
we
have
lots
of
moisture
in
the
air.
That's
coming
from
starting
very
warm
over
the
ocean
that
moisture
condenses.
E
These
clouds
have
a
strong
radiative
effect
that
I'll
show
in
a
second
that
prevents
further
cooling
for
a
while
by
the
time
the
moisture,
dissipates
and
the
cooling
continues.
The
air
is
off
the
continent
and
replaced
by
other
air.
So
that's
the
mechanism
we're
proposing
this.
This
shows
this
a
little
bit
better.
Perhaps
so,
what's
shown
now
in
this
case,
is
temperature
of
the
surface
as
function
of
time.
E
You
can
see
here
14
days,
so
you
see
this
initial
cooling
that
happens
in
in
this
warm
ocean
case,
so
an
abrupt
cooling
in
the
first
few
hours,
but
then
there's
a
plateau
in
which
there's
hardly
any
cooling
and
then
later
the
the
cooling
continues.
The
reason
there's
no
cooling
here
is,
if
you
look
at
the
net
long
wave
radiation.
E
This
is
this
orange
curve.
You
see
that
the
long
wave
radiation
starts
very
strong,
so
there's
very
strong
cooling
at
the
beginning,
but
within
hours
that
stops
when
the
clouds
form
and
then
the
clouds
prevent
any
long-wave
radiation,
and
that's
why
the
surface
doesn't
cool
for
a
long
long
time.
Eventually
the
clouds
dissipate
and
the
cooling
does
continue.
E
So
this
was
a
single
column
model
so
to
to
test
that
using
a
little
bit
more
elaborated
model.
We
take
a
three-dimensional
model.
Now
we
prescribe
the
sea
surface
temperature,
so
this
is
a
series
of
four
out
of
many
runs
that
we've
done
beginning
with
pre-industrial
temperature
and
going
all
the
way
to
a
prescribed
sst
where
the
temperature
never
drops
below
20
degrees
celsius.
So
that's
an
extreme
high
temperature
scenario
and
then
we
calculate
the
temperature
everywhere,
in
particular
over
the
continent,
where
we're
isolated
from
the
warm
warming
of
the
ocean.
E
So
here's
what
we
find
this
is
the
minimum
two
meter
temperature
in
the
pre-industrial
case.
You
can
see
these
blue
colors
correspond
to
-40
degree
celsius,
and
this
is
the
case.
When
we
have
a
warm
ocean,
you
can
see
that
the
continent
is
much
much
warmer
harley
hunter
drops
below
zero.
You
can
also
see
the
pdf,
so
this
also
tells
you
about
the
variability.
E
This
was
the
pdf,
the
probability
distribution
function
of
surface
temperature
in
the
pre-industrial
climate
and
the
red
one
is
the
pdf
in
the
warm
climate
with
the
warm
ssd,
and
you
can
see
the
temperature
hardly
ever
drops
below
zero.
If
you
look
at
the
reason
for
this,
you
can
see
that
this
is
low
cloud
fraction
developing
over
the
continent,
so
the
gcm
is
consistent
with
a
single
color
model
because
it
shows
low
clouds
forming
over
the
continent
and
these
low
clouds.
This
is
now
the
temperature
profile.
E
This
is
the
pre-industrial
with
the
inversion,
the
well-known
inversion
at
high
latitudes.
That
lily
also
talked
about-
and
this
is
what
happens
at
the
warm
sst
where
the
inversion
is
completely
illuminated,
then
the
surface
doesn't
go
below
freezing.
So
all
of
this
is
consistent
with
the
arctic
air
suppression,
by
low
clouds
that
was
described
by
this
single
color
model.
This
time
in
a
three-dimensional
gcm
all
right.
E
This
is
also
relevant
to
the
polar
amplification
mentioned
before
so,
as
lily
mentioned,
the
lapse
rate
is
an
important
feedback
where,
if
you
go
to
high
enough
temperature
in
maybe
in
a
different
climate,
you
know
rcp,
8.5
or
equivalent
climate
in
the
past,
we
find
that
these
low
clouds
can
eliminate
the
inversion,
so
an
important
feedback
for
explaining
the
the
arctic
amplification
and
the
lab.
Sorry
feedback
is
going
to
be
surface
clouds
developing
because
of
the
advection
of
more
marine
air
from
the
ocean.
E
Okay.
So
this
summarizes
this
first
part.
Basically
we're
saying
here
that
we
find
that
arctic
air
formation
is
suppressed.
If
the
sea
surface
temperature
is
above
10
degrees
celsius,
as
you
expect
it
to
be
in
a
warm
climate.
So
if
the
ocean
warms
in
an
equal
climate,
you
can
also
explain
the
warming
of
the
continent
and,
more
importantly,
you
can
explain
why
the
temperature
never
goes
below
freezing
thanks
to
the
warming
effect
of
these
continental
clouds,
slope
clouds
that
develop-
and
this
might
be
relevant
to
future
climate
as
well.
E
Okay,
so
stepping
back
and
getting
back
to
the
original
picture,
remember
we
talked
about
air
coming
into
saint
north
america,
and
if
the
air
is
coming
from,
say
the
pacific
in
this
direction
and
the
pacific
is
warm,
then
that's
fine.
The
mechanism
I
just
described
works
because
the
ocean
will
be
warm
and
and
and
the
air
would
be
moist
and
that
would
allow
these
low
clouds
to
develop.
E
But
what
happens
if
the
air
comes
across
from
siberia
across
the
arctic
as
it
does
in
this
event,
that
was
analyzed
by
all
in
that
case,
if
that
happens,
in
an
equitable
climate
and
the
arctic
is
ice
covered,
then
the
air
won't
be
able
to
accumulate
moisture
and
the
mechanism
I
described
before
won't
work.
So
we
must
eliminate
sea
ice
in
the
arctic
during
winter
for
this
idea
to
work.
So
let
me
explain
how
we
can
get
rid
of
sea
ice
in
an
equivalent
climate,
and
this
is
the
second
part.
E
This
is
the
convective
cloud
feedback
mechanism.
That's
the
work
with
dorian
out
okay.
So
we
start
with
this.
You
write
a
simple
energy
balance
for
the
arctic.
You
take
into
account.
You
know
they
hit
like
hit
from
mid-latitudes
it
tracks
for
mid
latitudes,
they're
different
radiative
fluxes,
and
you
ask
okay.
E
So
the
back
of
the
envelope
suggests,
and
the
calculations
suggest
that
clouds
over
the
arctic
ocean
would
be
the
most
effective
way
to
warm
the
arctic
by
15
degrees
and
keep
it
ice
free
during
winter.
So,
let's
see
how
we
can
do
that,
so
just
a
quick
reminder
about
height
clouds
and
low
clouds.
You
remember
that
high
clouds
have
a
low
albedo
but
high
emissivity,
so
they
have
a
warming
effect
on
climate,
while
low
clouds
have
albedo
and
have
a
cooling
effect
on
clouds.
So
what
we
need
is
high
clouds
during
winter.
E
Over
the
arctic
to
to
study
that
we
formulated
basically
a
simple
six
box
model
we'll
get
to
gcms
in
a
second,
but
we
started
with
a
six
box
atmospheric
model
and
we
analyzed
this
model
in
the
following
way.
So
we
plot
here
in
the
box
model
the
temperature
difference
between
the
arctic
and
the
tropics.
E
That's
this
axis
right
here,
so
again:
temperature
difference
between
the
arctic
and
the
tropics
as
function
of
co2.
As
we
increase
the
co2.
We
start
with
the
high
value
of
this
temperature
difference.
A
high
value
of
this
temperature
difference
means
a
climate
in
which
the
temperature
in
the
arctic
is
called
so
high
values
here
correspond
to
cold
arctic
climate.
Now
we
start
increasing
the
co2.
E
You
see
the
temperature
difference
between
the
arctic
and
the
tropics
is
decreasing,
but
eventually
there's
a
jump
and
then,
as
you
decrease
the
co2
you
get
this
hysteresis
and
at
some
value
of
steel,
two
you
have
two
different
states.
One
state
has
a
high
temperature
difference
between
the
arctic
and
the
equator.
This
is
a
present
day
like
climate
and
another
state
has
a
low
temperature
difference
between
the
arctic
and
the
low
latitudes,
and
this
would
be
an
equitable
climate
solution.
E
So
this
is
a
very,
very
simple
model,
but
it
predicts
that
in
an
equal
climate,
there
would
be
con
convection
during
wintertime
over
the
arctic
and
that
convection
would
lead
to
a
very
warm
arctic.
That's
a
obviously
a
dramatic
prediction
of
wintertime
convection.
That
is
like
the
convection
that
happens
over
the
tropics
today,
but
happens
during
winter
with
no
sunlight
in
the
arctic.
So
it's
a
bit
crazy
and
when
we
submitted
this
to
the
publication,
here's
some
reviews
we
get
first
controls.
E
The
first
reviewer
tells
us
that
this
behavior
will
probably
not
be
of
much
scientific
interest.
The
second
one
said
that
the
model
simulation
is
incompatible
with
observations.
The
third
one
said
that
the
model-
it's
not
clear,
why
this
simple
toy
model
would
get
such
a
state
while
a
realistic
gcm
cannot
and
another.
One
said
that
the
basic
the
answer
is
built
into
the
model
and
basic
data
about
cloud
properties
have
been
ignored.
So
that
was
the
enthusiastic
reception
we
got
in
the
reviews.
E
Obviously
I
wouldn't
show
you
that
if
we
were
wrong,
I
think
we're
right,
and
these
reviews
were
wrong
and
I'd
like
to
show
you
why
and
for
that
purpose.
Let's
look
at
some
ice.
Icp
ipcc
runs.
So,
let's
see
all
right,
we
have
time.
So
these
are
two
models
run
in
a
four-time
steel,
two
scenario:
the
end
car
model
in
the
gfdl
model
and
we're
seeing
we're
looking
at
the
arctic
during
winter
time,
and
let's
go
one
by
one
and
see
what
the
models
predict
the
first
model.
E
The
encore
model
predicts
that
at
four
times
co2
the
arctic
is
ice.
Free,
that's
what
the
red
stuff
here
means.
Well,
the
gfdl
predicts
that
the
arctic
is
ice
covered.
You
continue
and
you
look
at
the
surface
temperature.
The
anchor
model
shows
the
warming
at
four
times
co2
of
about
25
to
30
degrees
celsius.
Why
the
gfdl
model
doesn't
show
any
warming
or
very
weak
warming.
The
next
one
is
the
cloud
radiative
forcing
so
the
arc.
E
So
basically,
one
model
shows
convection
over
the
arctic
leading
cloud
to
cloud
radiative,
forcing
leading
to
warming
and
leading
to
ci
smelting
exactly
as
the
box
model
predicted,
and
the
second
model
shows
the
second
state
with
no
convection
no
cloud
ready,
forcing
no
warming
and
full
sea
ice,
and
if
you
need
further
proof
that
this
convection
will
actually
happen
in
the
future,
you
can
look
at
these
from
these
results
from
a
simi
5
model
from
erasmus
work
that
we've
been
doing.
So
what
you
see
here
is
five
different
models
for
each
model.
E
You
see
as
function
of
time
going
from
present
to
2300
and
latitude.
The
colors
indicate
convective
precipitation
and
you
can
see
that
every
single
model
predicts
that
in
the
arctic
at
85
degrees,
north
and
90
north,
a
convective
precipitation
will
develop.
Except
for
this
one
model
I
think
that's
the
french
climate
module
any
other
model
predicts
that
in
a
warm
climate
in
rcp,
8.5
convection
will
indeed
develop
over
the
arctic.
According
to
this
toy
model
that
I
just
discussed.
E
Great
and
so
I'll
skip
the
summary
of
this
one,
because
I
want
to
provide
sort
of
a
big
picture
perspective
into
the
whole
thing.
So
that
would
be
this
thing
right
here.
Six
ideas
were
suggested
for
equable
climate
so
far,
and
I'd
like
to
review
each
of
them
in
15
seconds
and
tell
you
what
I
think
about
them
so
that
you
have
the
big
picture
in
mind.
So
this
was
the
idea
by
kerry
emmanuel
that,
in
a
warm
climate,
squirrel
guns
will
get
stronger.
E
This
will
lead
to
ocean
mixing.
The
ocean
mixing
will
strengthen
the
overturning
circulation,
and
this
will
transport
heat
into
the
arctic.
It's
a
nice
idea
that
he
suggested
using
a
box
model,
but
when
he
tried
it
with
a
gcn,
the
warming
you
get
is
about
half
a
degree
celsius,
so
it's
completely
negligible.
So
this
doesn't
seem
to
work.
The
next
idea,
the
first
one
chronologically,
is
by
brian
farrell
1990
in
a
beautiful
paper
in
which
she
suggested
that
if
you
have
an
equator
to
pull
headless
cell,
this
would
lead
to
a
very
warm
climate.
E
We
tried
that
with
the
gstm.
The
thing
is,
if
you
have
an
equator
to
pull
heavily
cell,
the
subsidence
over
the
pole
leads
to
cloud-free
skies.
The
cloud-free
skies
leads
to
significant
warming
and
then
sea
ice
develops
and
prevents
this
warming
from
happening.
So
this
works
in
the
dry
model,
but
not
when
you
take
into
account
moisture
and
clouds.
E
Next
idea
was
polo
stratospheric
class
that
was
suggested
by
sloane,
attal
92
and
then
further
development
by
kirk,
davidoff
and
alex
2002
carey
manuel
looked
into
this
with
a
with
a
his
student
quality
and
they
found
that
that
particular
mechanism
doesn't
seem
to
work
for
complicated
reason.
I
don't
want
to
get
into
that.
So
again.
This
one
is
an
exotic
mechanism.
It's
not
clear
that
it's
working!
E
Finally,
there's
this
recent
idea
by
schneider
2019
that
in
high
co2,
stratocumulus,
decks
will
break
down
and
that
would
lead
to
a
10
degree
warming
of
the
subtropics.
The
problem
with
that-
and
I
mean,
I
think,
that's
a
beautiful
work.
Actually,
the
problem
with
that
is
what
you
need
to
explain
is
winter
time,
continental
climate
at
high
latitudes.
Well,
this
deals
with
the
subtropics
and
it's
not
clear
how
this
warming
will
get
from
the
subtropics
to
the
high
latitudes.
D
E
Yeah,
it's
actually
pretty
pretty
basic
thermodynamics.
So
suppose
you
have
two
temperature
profiles,
and
so
suppose
you
have
this
temperature
collapsed
right
and
you
just
warm
it
with
a
constant
shift
of
temperature,
so
no
lab
straight
feedback,
you're
just
taking
the
lab
street
and
warming
it
as
a
result
of
that
the
moisture
will
increase
much
more
near
the
surface,
simply
because
of
clausius
glyceron.
E
You
know,
there's
the
same
stream.
Warming
at
the
surface
would
lead
to
much
larger
increase
in
moisture
as
a
result
of
that,
the
moist
static
energy
will
increase
much
more
with
the
surface
than
it
up
in
the
upper
atmosphere
and
that
increase
in
in
the
moist
static
energy
at
the
surface
leads
to
a
state
that
is
convectively
unstable
and
that
would
lead
to
to
destabilization.
In
that
sense,
and
you
know
you
can
see
that
in
every
you
know
it's
not
just
this
theoretical
idea.
E
You
can
see
it
in
every
single
semi
model
that
is
being
run,
so
all
of
them
are
showing
that
convection
during
winter
time
in
the
arctic.
I
do
agree
with
you
that
completely
that
it's
non-intuitive,
but
it's
now
been
shown
to
happen
in
every
model
and
the
basic
thermodynamics
behind
this
is
pretty
simple.
Actually,
thanks
for
the
question.
F
E
E
Here
we
go
so
you
warm
the
surface.
This
makes
the
air
column
unstable.
This
leads
to
convection
the
clouds
and
further
warming
when
you
have
a
positive
feedback
like
that,
it
allows
for
multiple
equilibria
to
happen.
I
would
say,
though,
that
these
there
is
a
multiple
equilibrium
might
be
a
the
less
realistic
part
of
this.
The
important
part
of
the
mechanism
is
the
fact
that
there
is
one
state
with
no
convection
and
with
sea
ice
in
another
state,
with
a
convection
and
nauseas,
whether
they
coexist
at
the
same
parameter
regime
is
less
obvious.
D
B
Go
ahead
thanks
for
the
great
talk
you
mentioned,
the
two
mechanisms
both
involve
this
cloud
formation,
so
my
question
is
which
one
you
think
is
maybe
better
captured
by
gcn
and
what's
the
if
there's
problem
with
gcm,
it's
more
like
a
structural
problem
or
resolution
or
parameter
problem
right.
Thank
you.
E
Yeah,
so
it
seems
the
gcm
do
gcms
do
get
recent
gcms
do
get
this
convection
in
the
winter
over
the
arctic,
so
they
do
seem
to
be
able
to
get
that,
even
though
they
parameterize
convection
and
so
on.
When
we
run
these
models
with
with
very
high
ssd,
they
also
get
the
low
clouds
over
the
surface.
So
it
seems,
like
you
know,
both
mechanisms
are
actually
captured
by
gcns.
Now
you
could
ask
how
reliable
is.
Does
this
happen?
E
How
reliable
is
the
sco2
at
which
this
happens,
and
so
on
that
we
don't
know
and
when
we
do
have
great
doubts
about
the
ability
of
gcms
to
stimulate
convection
and
cloud
and
so
on.
So
I
would
say
that,
even
though
gcms
do
get
both
of
these
mechanisms,
there
are
many
uncertainties
in
terms
of
quantitatively
at
what
co2
would
these
two
feedbacks
be
triggered.
D
A
E
That's
great
yeah,
you
know
so
the
way
we
did
it
is.
First,
we
did
a
simple
color
model.
That
has
nothing.
Basically,
you
know
just
a
single
earth
column
that
we
pretend
is
moving
from
the
ocean
to
the
left.
The
next
step
is,
we
prescribe
the
sst
and
check
the
effect
over
the
continent.
The
next
step
after
that
would
have
to
be
running
a
coupled
model,
increasing
the
co2,
letting
the
model
increase
the
sst
and
seeing
how
that
affects
the
low
clouds
over
the
continent.
E
We
haven't
done
that,
but
I
completely
agree
with
you
that
that
would
be
the
next
interesting
step
to
take,
and
I
think
there
is
going
to
be
a
challenge
to
get
the
ocean
to
warm
enough.
For
this
to
happen,
we
find
that
you
need
to
warm
the
ocean
by
at
least
10
degrees
with
enough
co2.
You
might
be
able
to
get
it,
but
you
know
it's
not
obvious
that
you
can.
A
E
A
E
Yeah,
so
the
answer
is
here
so
this
is
this
is
the
initial
temperature
of
the
ocean.
So
this
is
the
initial
temperature
of
the
air
over
the
ocean
before
it
moves
over
land
in
this
one-dimensional
color
model
and,
what's
shown
on
the
vertical
axis,
is
how
long
does
it
take
for
this
air
to
get
to
the
freezing
point?
Okay?
So
if
you
start
at
zero,
obviously
it
takes
zero
days
to
get
to
freezing,
because
you
started
that
zero
frequency.
If
you
start
with
an
ocean
that
is
even
nine
degrees.
E
The
initial
cooling
that
is
very
that
is
very
rapid
before
the
clouds
develop
bring
the
temperature
to
freezing
within
hours.
If
the
temperature
of
the
ocean
is
above
10
degrees
celsius,
then
the
time
to
freezing
becomes
much
larger.
So,
for
example,
if
the
ocean
is
15
degrees
celsius,
it's
going
to
take
about
a
week
to
get
this
surf
surface
to
be
below
freezing.
E
E
D
I
have
a
question
maybe
related
to
that.
I'm
wondering
if
any
of
these
feedbacks
that
you're
talking
about
would
potentially
be
further
enhanced
by
the
paleogeography
in
eurasia
and
if
that's
something
that
you
it
looked
like,
you
were
using
modern
continental
configuration,
but
maybe
that's
an
additional
influence.
E
I
don't
actually
know
what
the
paleo
elevation
of
that
is,
that
could
have
made
a
big
difference.
Obviously,
so
I
think
when
you
try
to
interpret
proxy
evidence,
the
topography
is
going
to
make
a
big
difference.
I
think
the
idea
of
frost,
intolerant
plants
and
animals
in
high
latitudes
is
pretty
robust,
regardless
of
elevation
changes.
D
E
That's
right:
they
might,
there
might
have
been
in
a
big
inland
sea
in
north
america.
Obviously,
in
the
western
part
of
north
america
that
could
have
helped,
because
then
you
could
accumulate
moisture
over
land.
You
don't
have
to
accumulate
it
over
the
ocean
in
order
to
form
these
clouds.
So
I
think
it
does
make
sense
to
repeat
such
calculations
using
a
gcm
that
uses
the
the
paleo
topography
as
opposed
to
the
present-day
topography
which
we've
used.
That
was
a
bit
crude.
B
B
C
I
would
expect
these
other
feedbacks
to
become
muted
over
time
when
you,
in
these,
like
warmer
climates
without
any
sea
ice
loss.
So
yeah
and
it
sounds
like
super
non-linear
for
the
cloud
feedback
of
where
in
present
day
and
near
future
warming,
it
seems
less
important
than
other
feedbacks
like
the
laptop
feedback.
But
once
you
get
these
convective,
this
convection
it's
more
important
but
yeah.
I
think
there's
some
also.
Some,
like
overlap
with
current
or
more
like
near
future,
lobster
feedbacks
being
dependent
on
the
the
clouds
in
the
arctic.
C
So
I
think
there's
a
paper
by
ib10
introduced
your
altmo
that
looks
at
if
you
change
this,
the
amount
of
super
cool
liquid
and
clouds
in
the
arctic.
How
that
impacts
the
lobster
feedback
so
which
is
something
that
eli,
I
think,
was
talking
about
a
little
bit
in
equitable
climates
as
well
yeah,
that's
something
to
think
more
about!
It
seems
like
there
are
a
lot
of
nonlinear
changes.
D
I
think
we
are
out
of
time.
Thank
you,
everybody
for
the
great
discussion
and
thank
you
so
much
to
our
two
speakers
for
really
excellent
talks,
stay
tuned
for
our
next
webinar,
which
we
will
be
announcing
sometime
soon.
If
you
have
speakers
that
you
would
like
to
nominate,
please
do
so
we're
happy
to
take
nominations.
You
are
welcome
to
self-nominate
as
well.