►
From YouTube: New protein crystallographic science enabled with GPU computing at X-ray free electron lasers
Description
Nicholas Sauter from LBNL presents a talk on New protein crystallographic science enabled with GPU computing at X-ray free electron lasers. Recorded live via Zoom at GPUs for Science 2020. https://www.nersc.gov/users/training/gpus-for-science/gpus-for-science-2020/ Session Chair: Hugo Brunie
A
A
But
for
the
past
10
years
we've
been
using
a
very
different
and
much
more
intense,
x-ray
light
source
where
all
the
x-rays
are
compressed
into
30
femtoseconds.
This
actually
destroys
the
crystal,
but
not
until
the
diffraction
pattern
is
recorded
and
therefore-
and
we
only
get
a
partial
diffraction
pattern
there.
A
So
we
have
to
do
an
experiment
where
we
examine
and
sequence
you
know
perhaps
a
half
a
million
crystals
in
random
orientations
and
piece
together,
the
diffraction
pattern
from
there
and
that's
why
this
is
now
becoming
an
extra
scale
problem
and,
of
course,
requiring
gpus,
but
we're
relatively
new
as
a
field
in
implementing
gpus,
and
I
think
you'll
appreciate
that
from
the
talk.
So,
let's
go
on
to
the
next
slide.
Please
waiting
for!
Yes,
thank
you.
So
I'm
gonna
give
you
an
example
of
a
protein
structure
that
we're
looking
at
in
photosynthesis.
A
Photosystem
two
you'll
remember
from
biology
that
this
is
the
response.
The
protein
that's
responsible
for
accepting
four
photons
from
sunlight
and
using
that
to
split
waters
and
evolving
molecular
oxygen.
In
so
doing,
the
hydrogen
released
is
put
into
chemical
energy
in
the
form
of
atp
and
the
high
energy
electrons
are
then
used
for
carbon
fixation,
but
we
are
focusing
on
in
a
particular
in
this
particular
case
on
the
cofactor,
which
is
four
manganese
atoms.
A
Coupled
with
bridging
oxygens
and
a
calcium
next
slide,
please
so
why
would
a
system
like
this
require
this
very
bright,
expel,
light
source
and
that-
and
it
all
has
to
do
with
radiation
damage
we're
interested
in
following
the
time
progress
of
a
redox
reaction?
However,
any
exposure
to
x-rays
will
reduce
the
manganese
to
manganese
too.
So
the
very
thing
that
we're
interested
in
studying
is
destroyed
by
the
x-rays
and
that's
why
we
need
a
30
femtosecond
source
to
actually
get
the
diffraction
pattern
before
damaged
processes
come
in.
A
So
in
order
to
control
for
that,
we're
actually
simultaneously
looking
at
the
k
beta
emission
line
from
manganese.
So
this
is
an
x-ray
emission
line
that
changes
ever
so
slightly
because
it's
coupled
to
the
valence
state
of
the
manganese.
Let's,
let's
show
how,
on
the
next
slide,
how
that
comes
off
in
practice
in
an
experiment.
So
in
the
very
lower
left
corner,
we
are
streaming.
A
You
know,
half
a
million
crystals
into
the
x-rays
in
rapid
succession.
At
the
same
time,
we're
exciting
the
crystals
one
by
one
with
laser
pulses,
perhaps
one
two
three
and
four
laser
pulses
in
order
to
move
them
around
the
redox
cycle.
We
are
collecting
diffraction
patterns
in
this
gray
detector,
but
at
right
angles
to
that
this
yellow
x-ray.
A
This
is
an
x-ray
emission
spectrometer,
where
we're
we're
actually
recording
this,
this
emission
spectrum
and
we're
seeing
very
small
millie
electron
volt
changes
in
the
x-ray
emission
spectrum
that
tell
us
that,
after
the
first
flash,
we
oxidize
after
the
second
flash,
we
oxidize
and
after
the
third
flash
we're
actually
forming
that
o
o
double
bond,
generating
the
molecular
oxygen
and
we're
reducing
the
magnesius
again.
But
the
very
thing
we
because
of
spectral
overlap.
A
We
cannot
tell
the
individual
charge
states
of
individual
manganese
atoms,
which
is
what
we're
very
interested
in
so
I'll
circle
back
at
the
end
of
the
talk,
how
we're
going
to
address
that
in
the
meantime,
let's
advance
to
the
next
slide.
Please
and
just
show
so
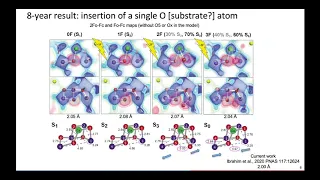
after
eight
years
of
working
on
this
system,
we've
gotten
some
results
very,
but
there's
a
lot
of
stuff
that
we
still
need
to
know.
So,
if
you
go
down
down
to
where
I
have
the
s3
label,
this
shows
that
after
two
photons
excitation,
the
manganese
is
in
purple.
A
Just
to
show
you.
This
is
a
diffraction
pattern.
You
know
the
normal
analysis
is
that
we
look
at
bragg
spots
and
we
measure
the
number
of
photons
in
each
bragg
spot
now.
There's
a
distinction
to
be
had
here
between
a
bragg
spot,
which
is
observing
photons
on
an
image
and
structure
factors
which
become
the
coefficients
in
a
fourier
transform
that
yield
us
the
electron
density,
and
I
would
love
to
tell
you
that
the
brag
spot
is
the
same
as
the
structure
factor
amplitude.
A
But
it's
not
it's
not
really
and
I'll
show
why,
in
the
next
couple
of
slides
in
the
meantime,
it's
all
a
matter
of
accuracy,
and
there
are
two
reasons
maybe
for
wanting
high
accuracy,
as
you
see
in
this
kind
of
gray,
diffraction
pattern
in
the
back.
As
you
go
out
to
a
higher
angle,
the
diffraction
spots
become
weaker,
so
we're
actually
trying
to
measure
small
changes
in
very
weak
bragg
spots
and
secondly,
if
you
just
think
about
it,
we're
looking
at
one
oxygen
atom
in
a
very
large
molecular
complex
of
maybe
46
polypeptide
chains.
A
So
we
really
want
one
percent
accuracy
in
these
intensity
measurements,
and
this
is
why,
instead
of
the
traditional
analysis
pattern,
that's
maybe
a
terrascale
computation
where
we
just
sum
up
the
photons
in
each
bragg
spot
we're
moving
instead
to
a
a
profile
model
where
we
fit
the
structure
factors
to
the
bragg
spots
as
if
they
were
unknown
parameters,
so
I'll
show
on
the
next
slide.
You
know
why
of
the
traditional
procedure
that
the
pteroscale
procedure
fails
and
we're
moving
to
exoscale
use.
A
This
is
just
what
you
know
from
a
physics
class
about
x-ray
diffraction
from
planes
of
atoms.
In
a
crystal
and
due
to
bragg's
law,
you
get
a
reflection
at
a
specific
angle,
but
what
we've
known
for
a
hundred
years
or
so,
is
that
it's
not
a
delta
function,
there's
actually
a
width
to
this
to
the
observing
observation
of
a
bragg
spot.
A
So
if
you
rotating
the
crystal
the
black
spot
flashes
on
and
then
it
goes
off
slowly
with
a
certain
angular
width,
this
is
called
the
rocking
curve
and
we
don't
really
know
the
the
shape
of
this
function.
It's
it's
a
parameter.
It's
it's
due
to
the
underlying
mosaic
disorder
of
the
crystal.
The
second
reason
why
the
profile
modeling
becomes
difficult
on
this
on
the
next
slide,
please,
is,
is
that
the
x-ray
spectrum
at
the
the
light
source
is
slightly
broadband.
A
It's
spiky
and
it's
stochastic,
so
we
can
measure
it
differently
for
every
pulse.
But
if
you
think
about
a
bragg
spot
that
you
know
on
this
right
side,
there's
an
experimental
bragg
spot,
but
this
is
really
composed
of
photons
of
different
energies.
So
the
red
photons
produce
this
little
red
fringe
on
the
second
panel
and
the
blue
photons
produce
a
blue
fringe
and
well,
when
we're
modeling
the
bragg
spot.
A
We
add
up
all
these
fringes
from
different
different
x-ray
energies
to
produce
a
physics
model,
the
bragg
spot,
that
we
then
compare
with
the
experimental
model,
and
this
is
just
shown
in
an
equation
down
here.
The
pixel
intensity
is
really
a
sum
over
wavelength
channels
where
the
coefficients
are
the
spectral
intensities
that
we
measure
and
then
the
big
unknown
in
yellow
is
the
structure
factor,
that's
what
we're
treating
as
an
unknown
quantity,
and
the
third
factor
is
simply
due
to
the
rocking
curve
that
I
showed
on
the
last
slide.
A
So
let's
go
on
to
the
next
slide,
please.
So
what
we're
really
doing
here
is
we're
producing
a
large
bayesian
model.
So
we're
saying
we,
you
know
we
have
a
model
physics
based
model
where
we
predict
that
there's
perhaps
10
photons
on
this
pixel,
but
we
only
observe
eight.
So
what's
the
probability
of
that,
and
then
we
do
iterative
first
derivative
parameter
optimization
to
maximize
the
bayesian
agreement
between
the
model
and
the
data
and
the
you
know
the
big
unknowns
that
we're
optimizing
here
are
the
structure
factor
amplitudes.
A
You
know
there
may
be
a
half
a
million
of
them
and
any
given
structure
factor
is
determined
by
input
from
hundreds
of
different
diffraction
patterns.
So
this
is
truly
a
global
analysis.
Of
this
whole,
very
large
100
terabyte
data
set
to
get
us
the
structure
factors
so
on
the
right
side,
this
is
just
a
simulation
to
show
us
shows
we
can
get
to
the
ground
truth,
at
least
in
theory.
Next
slide,
I'm
gonna
show
sorry
hugo.
Can
you
hear
me?
A
Can
you
oh
thank
you,
so
here's
an
a
case
where
we
hope
to
get
some
really
new
science.
Out
of
this
I
mentioned
before
metal
atoms
and
different
oxidation
states
on
different
atoms,
we've
known
for
a
while
that,
for
example,
in
this
ferradoxin
protein,
the
electron
is
only
carried
by
the
red
iron
on
top,
so
that's
reduced
and
that
actually
produces
a
different
absorption
edge
on
the
k,
x-ray
absorption
line
between
ferrous
and
ferric
iron.
This
is
reflected
at
the
very
bottom
in
the
formula
for
the
structure
factor.
A
We
can
actually
use
crystallography
or
crystallographic
diffraction
as
a
spectroscopic
method
to
spatially
resolve
the
contribution
of
different
iron
or
different
metal
atoms
in
a
protein,
one
of
which
is
reduce
one
of
the
which
is
oxidized
and
on
the
upper
right.
I'm
kind
of
indicating
that
we
hope
to
do
this
with
the
manganese
atoms
in
the
photosystem
too,
on
the
next
slide,
we're
just
doing
a
simulation
that
shows
that
this
sort
of
thing
works
out
when
we
model
the
ferrodoxin.
A
So
I'm
going
to
start
wrapping
up
now
so
on
the
next
slide,
just
to
mention
that
there
are
other
complicating
factors
we
really
in
order
to
get
this
last
one
percent
of
accuracy.
We
have
to
account
for
every
single
photon
on
the
image
here.
What
you're
seeing
is
sort
of
a
circle,
a
circular
dark
pattern
that
represents
the
solvent
scattering
within
in
the
water
of
solvation
of
the
protein
crystal,
so
that
is
kind
of
a
it
looks
like
it's
radially
symmetric,
but
it's
an
unknown
radial
function
form.
A
So
what
we
hope
to
do
is
use
machine
learning.
Perhaps
the
gaussian
process
formalism
to
learn
that
radial
distribution
function.
There
are
other
things
you
can
see
that
there
are
shadows
that
are
actually
pieces
of
plastic
that
are
absorbing
some
photons,
so
we
hope
to
use
machine
learning
to
to
model
these
sorts
of
artifacts.
A
So
all
of
this,
of
course,
we
believe,
is
amenable
to
gpu
modeling.
So
in
the
end,
yes,
thank
you.
In
the
end,
we
believe
that,
in
contrast
to
the
older
pattern
of
data
analysis,
where
we
just
sum
the
photons
in
the
bragg
spot,
we
can
do
much
better
by
fully
accounting
for
the
bragg
spot,
size,
shape
and
intensity
profile,
using
physics
models
when
they
are
known
and
machine
learning
when
they
are
unknown.
A
The
immediate
goal
is
to
get
information
about
the
valence
state
of
metal
atoms
in
proteins,
and
the
exascale
project
goals
is
to
kind
of
unfold.
This
type
of
methodology
to
all
x-ray
crystallography
beam
lines,
they're
all
user
facilities,
so
so
that
any
study
of
a
metalloenzyme
could
benefit
from
this.
So
in
the
group
we
have
aaron
brewster
and
derek
mendes,
and
also
james
holton,
collaborating
with
us
on
algorithms
and
then
shortly
today,
you'll
hear
from
johannes
blotch
about
implementation
on
gpu.
So
thanks
for
your.
B
Yeah
nick
nick
salter
has
been
a
scientist
at
lbl
since
2000
and
working
mostly
on
the
algorithmic
development
for
this
protein
crystallography.
While
people
are
searching
for
questions,
so
this
group
started
collaborating
with
nurse
in
2013,
as
he
has
shown
when
it
become
clear
that
the
typical
deflection
data
sets
would
start
exceeding
100
tbrs.
B
A
B
Yeah-
and
I
think
it's
really
important
to
remind
that
all
this
performance
that
we're
trying
to
gain
it's
in
the
end
to
make
science
go
further.
So
I
think
your
talk
is
really
interesting
and
show
us
what
is
behind
the
flops
and
if
we
don't
have
a
question,
I
had
a
question
about
the
the
algorithms
you're
building
for
the
for
this
science.