►
From YouTube: 5. Introduction to cuML
Description
From the NERSC NVIDIA RAPIDS Workshop on April 14, 2020. Please see https://www.nersc.gov/users/training/events/rapids-hackathon/ for all course materials.
A
B
B
B
Okay-
and
so
this
is
what
the
software
stack
looks
like
today,
the
top
layer
that's
exposed
to
the
user
is
python.
Underneath
we
have
cython
wrapping,
which
connects
the
c
plus
plus
to
the
python
layer.
Our
core
algorithms
are
built
in
a
combination
of
cuda
libraries
like
thrust
kuspars
kusover,
and
we
also
have
machine
learning
primitives.
B
Today,
like
nick
mentioned
earlier,
we'll
see
a
couple
of
those
like
linear
regression,
logistic
regression
and
umap.
Some
of
them
like
linear
regression,
random
4,
is
currently
run
on
multi-gpu
and
multi-node,
but
some
of
the
other
ones
were
in
the
process
of
working
on
them
too,
and
extending
them
to
multi-node
voltage
gpu.
So
this
is
the
roadmap
as
we
get
closer
to
1.0.
B
B
Basically
these
are
quadra
cards
compared
to
the
tesla
cars
that
you're
running
on
corey,
gpus,
they're,
basically
the
same,
but
one
is
designed
for
the
server
which
are
the
tesla
cars
and
another
one.
Quadro
is
for
workstation.
So,
basically,
what
all
it
has
is
as
cooling
and
display
boards,
because
it's
a
graphics
card,
rather
just
an
accelerator,
so
I'll
use
that
and
another
thing
that
I
wanted
to
mention-
is
I'll
close
these
tabs.
B
So
we
can
see
the
whole
screen
and
hopefully
it'll
be
large
enough
to
go
through
it,
but
this
is
through
envy
dashboard
that
we
actually
added,
I
think
a
few
months
ago.
So
it's
really
nice
that
you
can
monitor
your
gpu
utilization
and
gpu
memory,
while
you're
going
through
these
notebooks
before
this.
One
thing
that
we
used
to
do
was
that
just
run
nvidia
smi
and
watch
our
gpu
to
monitor
this.
But
this
is
much
nicer,
and
so
this
was
installed
in
the
container
that
I'm
running,
which
is
point
13.
B
So
I
think
it
should
be
in
the
same
one
on
nurse,
but
basically
what
it
is
it's
called
in
the
dashboard.
You
can
install
it
too,
so
you
can
pip
install,
but
if
you're
writing
a
similar
container,
it
should
be
in
your
jupiter
notebooks
on
the
left
too.
So
you
can
click
on
system,
dashboards
and
click.
B
B
For
those
of
you
that
are
familiar
with
cycle,
learn
and
have
used
cycle
learn.
The
api
looks
very
similar,
so
some
of
it
might
actually
be
super
easy
and
straightforward,
but
the
goal
is
to
basically
just
use
some
random
data
or
synthetic
data
to
use
qml
and
port.
The
code
from
second
learn
to
qml
to
run
on
gpus
and
then
the
second
part
of
this
notebook.
We
actually
have
a
hyperparameter
optimus,
optimization
example,
and
the
nice
thing
about
that
is
that
we're
actually
compatible
with
other
hpo
packages.
That
cycle
learn
can
use.
B
So
it's
very
short,
very
similar,
just
a
few
differences
that
I'll
talk
about
when
we
get
to
that
and
then
finally,
we
have
a
notebook
with
umap
to
see
how
we
can
visualize
eminence
data
sets
we'll
compare
that
with
tsne
too
and
then
use
two
data
sets
one
with
digits
and
another
one
with
fashion
data
set.
So
that
includes
like
boots
and
clothes,
and
things
like
that.
B
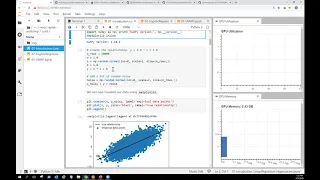
So,
let's
start
with
this
one:
oh
in
the
first
cell,
we're
just
we're
going
to
import
some
of
the
libraries
that
we
need
like
matplotlib
and
numpy,
and
can
I
have
mentioned
here
we're
just
going
to
use
and
create
random
data
set
in
this
example,
and
then
here
we
just
want
to
plot
this.
So
what
we're
doing
is
we're
just
adding
some
random
noise
to
y
and
then
we
want
to
see
how
that
looks.
B
B
So
it's
good
to
keep
track
of
what
you're
running
to
if
there
are
any
issues
or
if
you
want
to
report
any
bugs
later
on,
it's
good
to
just
keep
track
of
that,
and
then
this
is
using
importing
linear
regression
from
scikit-learn
and
actually
scikit-learn
apis
is
pretty
user
friendly.
What
we
did
here
is
we're
just
going
to
create
an
object,
and
then
this
is
the
object
that
will
create
the
ordinary
least
square
regression.
B
Basically,
what
it
will
try
to
do
is
it'll
try
to
fit
a
line
to
the
data
set
that
we
just
created
and
what
it'll
do
is
it'll
minimize
the
square
distance
between
these
observations
and
then
the
true
relationship,
which
is
this
line,
and
it's
basically
one
of
the
introductory
machine
learning.
Algorithms,
that's
commonly
used.
B
So
then
next
thing
that
we
do
is
we
run
fit
we'll
use.
Numpy
and
so
like
an
empire
functionality
to
create
a
format
that
psychic
learn
accepts
so
in
this
case
it'll
be
expanding
that
data
set.
So
what
we
did
was
we
created
this
x,
that's
one
variable,
so
it's
equal
to
a
column
and
what
numpy
expand
does
is
it
just
creates
a
column
on
our
x
expands
the
shape
of
the
array
and
then
with
the
position
that
we've
mentioned
here.
B
One
thing
that
I
mentioned,
I
think
in
the
example
here
we
had
why
so
just
a
slight
modification
to
change
that
to
y
noisy
when
we
want
to
put
the
data
and
then
what
we
do
next
is
we
want
to
run
that
to
see
how
that
will
fit.
So
we
run
here
our
fit
to
see
the
train
our
model
and
then
what
we
do
after
that
here
we
want
to
create
another
set
of
data
to
run
inference.
B
So
basically,
we
want
to
predict
how
this
matches,
with
the
trained
model
that
we
just
created,
we'll
again
use
some
of
the
numpy
functionalities
could
to
create
a
linear
space.
Basically
a
grid
of
these
points
and
again,
in
this
case
it's
just
a
single
line,
because
it's
one
dimension
and
then
with
running
predict.
B
B
B
Now
one
thing
that
I
should
mention
is
you:
don't
necessarily
need
to
create
qdf
to
use
qml
now,
in
a
lot
of
cases
it's
recommended
because,
like
you
can
run
some
of
the
other
operations
faster,
like
the
examples
that
we
saw
and
the
qdf
notebooks,
but
cool
ml
can
actually,
you
can
pass
couple
and
numpy
arrays
too.
So
if
you
really
wanted
to
test
this
feed,
what
you
can
do
is
use
the
same
array
from
the
previous
section
and
then
pass
that
in
without
creating
a
cdf
data
frame.
B
So
it
really
depends
on
the
workflow
if
you're
already
have
it
working
with
a
dataset
that
you're
and
we'll
get
to
that
when
we
get
to
the
logistic
regression.
But
if
you
already
have
a
data,
for
example,
if
it's
in
coupon
format
or
as
a
numpy-
and
you
don't
want
to
convert
it
because
you're
using
other
frameworks
too,
like
pytorch,
you
can
easily
do
that
and
you
can
still
use
qml.
B
So
what
we
did
here
again,
we
we're
going
to
import
cool
ml.
This
is
the
current
version,
which
should
be
similar
to
the
one
that
you
have
on
quarry
and
then
here
again
similar
to
the
scikit-learn
version,
we'll
just
import,
linear
regression
and
we'll
just
name
it
linear
regression
gpu
to
not
confuse
it
with
the
other
one
and
again
we'll
instantiate
our
linear
regression
object
and
fit
it.
B
So
what
we
did
was
similar
to
scikit-learn
that
you'll
have
some
of
these
default
parameters.
We've
added
those
too
and
the
goal
is
so
if
a
user
is
new
to,
let's
say
a
linear
regression
and
they
don't
know
there
are
different
options
for
the
solvers.
Why
would
they
use
one
over
the
other
by
default?
B
B
Now
again
in
this
example,
we
have
a
trained
model
and
what
we
want
to
do
is
again
visualize
this
to
see
how
this
compares
to
our
cpu
prediction
and
then
the
true
line
that
we
had.
That
was
the
relationship
between
y
and
x.
One
thing
is:
you'll,
probably
see
a
lot
of
this
warning,
so
especially,
I
think
in
the
last
cell
or
the
one
before
the
glass.
B
It
basically
means
that
training
for
training,
we're
using
column,
major
and
prediction
requires
row
major
data,
so
there's
inconsistency
between
the
data,
but
that
will
result
in
an
overhead
in
additional
memory
usage,
so
we're
just
showing
or
presenting
this
that
this
is
happening
in
cool
ml.
But
so
it's
not
really
a
bug.
It's
more
of
a
feature
request
that
we're
working
on,
and
you
shouldn't
see
this
in
the
next
couple
of
release
and
then
so.
This
is
the
final
graph
we'll
we
have
the
black
line.
B
B
However,
sometimes
we're
not
running
the
same
exact
algorithm
as
I
could
learn,
sometimes
we're
implementing
algorithms
that
make
more
sense
for
gpus
or
for
massive
parallelism,
so
it
might
be
a
different
solver
and
neither
is
right
or
wrong.
It's
just
a
different
approximation
that
we're
using
yeah,
and
if
you
really
want
to
compare
the
same
exact
algorithms,
you
might
have
to
adjust
parameters
or
say
or
solvers
to
be
able
to
compare
like
apples
to
apples.
B
B
So
overall,
sometimes
we
have
to
we're
using
basically
like
I
mentioned
different
implementations.
Okay.
So
now,
let's
look
at
a
hyperparameter,
optimization
example
or
hyperparameter
tuning,
which
basically
is
a
process
of
choosing
a
set
of
optimal
hyperparameters
for
an
algorithm
or
a
learning
algorithm,
and
these
parameters
are
usually
randomly
set
by
the
user
before
training.
B
So
these
are
things
that
we
can
modify
and
you
can
either
do
that
by
hand
so
to
try
a
different
set
of
outfits.
Sorry
hyperparameters,
but
usually
it's
more
efficient
to
use
hpo
and
we'll
see
that
example
there's
different
methods
that
you
can
actually
use
all
the
combinations
of
the
those
parameters
or
just
randomly
select
a
few
and
then
compare
performance
and
accuracy
to
see
which
parameters
will
give
you
the
best
results.
B
So
what
we're
going
to
do?
For
this
example,
we're
going
to
use
the
diabetes
data
set
from
scikit-learn
secular
actually
has
a
few
built-in
data
sets.
That
is
actually
really
good
for
testing
and
running
demos
and
sample
notebooks
like
these,
I
will
run
hbo
in
this
case
for
ridge
regression
and
so
for
this
example.
B
We'll
have
one
parameter
to
work
with,
which
is
alpha
and
for
other
algorithms
we
might
actually
have
a
lot
of
different
parameters.
So
if
anyone
has
done
deep
learning,
you
know
that
hbo
can
actually
optimize
a
lot
of
different
parameters.
For
example,
let's
say
training
with
in
a
neural
network
and
the
nice
thing
about
that
is
like
I
said
you
can
go
through
all
of
the
possibilities
or
do
a
random
search
and
then
compare
the
performance
of
those
to
find
the
best
ones.
B
B
And-
and
here
we've
just
added
some
of
the
details
about
differences
of
cyclic,
learn
and
qml
examples,
so
both
approximate
the
same
thing
but
qml
currently
has
three
different
solvers
and
cyclic
learn
has
some
of
the
other
ones.
So
the
only
one
that's
in
common
between
the
two
right
now
is
svd
and,
like
I
mentioned
earlier
in
the
previous
section,
sometimes
we're
not
comparing
the
same
exact
parameters
and
for
cycle
learn.
Actually
auto
solver
is
a
good
option.
B
What
they
do
is
they
have
heuristics
that
actually
can
choose
the
best
solver
for
you,
based
on
your
data
set
size
and
other
options,
like
your
type
of
data
that
you're
using
we
haven't
implemented
this
in
qml.
Yet
so
we
don't
have
auto
solver,
and
one
of
the
reasons
is
that
for
complex
algorithms,
we
still
don't
have
good
heuristic
and
we
want
to
basically
see
more
use
cases
to
figure
out,
which
ones
will
give
us
best
performance.
B
So
what
we're
going
to
do
here,
we'll
create
ridge
regression,
objects
again
fit
them
and
then
run
predict
on
both
of
these.
What
I
did
here
and
the
cpu
and
the
gpu
version.
I
explicitly
added
the
parameters
that
I
used,
but
you
can
use
the
default
and
basically
just
call
the
solver
so
select
the
solver.
B
B
So,
like
I
said,
we'll
basically
use
certain
points
of
the
parameter
to
explore.
We
have
alpha
in
this
example,
so
we'll
set
the
value
from
-3
to
-1,
so
we'll
have
10
points
uniformly
the
distributed
points
and
in
this
case
logarithmic
and
then
we'll
do
the
grid
search.
Try
all
the
10
points
we're
generating
we're
using
grid
search,
so
that
will
use
all
the
points
and
another
way
to
actually
run
this.
B
You
can
actually
select
random
search
too,
and
that
would
make
sense
if
you
have
a
larger
array
that
you're
actually
using
more
data
that
you
want
to
run
on.
So
if
you
have
a
lot
of
hyper
parameters
and
if
you
run
grid
search,
so
if
you
actually
test
all
of
them,
it
might
take
hours
or
days
to
actually
run
through
that.
B
Excuse
me
and
it
processes
without
issues
actually
and
you'll,
be
able
to
see
the
results.
The
only
thing
is
again
the
warnings
that
I
mentioned
earlier
that
hopefully
you
won't
see
that
in
the
next
release
and
then
because
there's
a
lot
to
scroll
down,
I'm
comparing
the
output
from
coimo
with
scikit-learn
and
they're
very
similar,
so.
C
B
Based
on
the
latest,
I
think
for
the
frit
and
the
training
it's
expecting
column
format,
but
for
inference,
it's
expecting
row
format
so
and
that's
because
we're
using
the
forest
inference
library.
So
it's
within
cool
ml2
that,
depending
on
what
you're
running,
it's
expecting
different
formats
of
data,
so
this
was
actually
something
that
I
think
I
saw
an
issue
on
github
that
nick
mentioned.
D
Great
thanks
so
yeah
you
pretty
much
nailed
it
laurie,
the
in
general,
most
most
operations
that
we're
doing
will
want
to
a
column
major
memory
layout.
But
in
this
specific
case
the
pipeline
of
dick
after
fit
needs
different
ones,
and
that's
something
that's
being
that's
being
worked
on
in
in.
I
guess
currently
in
general,
though
column
major
is
what
we
would
usually
say.
D
B
So,
as
far
as
I
know
actually
psychic
learn,
I
don't
think
you
can
run
that
on
gpus
and
so
that's
what
we're
doing
we're
reporting
a
lot
of
these
algorithms
to
run
on
gpus.
Now,
there's
a
cycle
learn
api,
for
example,
if
you
use
xg
boost
but
then
again
underneath
that's
using
a
lot
of
the
implementations
that
we've
added.
E
B
Correct
and
that's
actually
one
of-
and
I
I
mentioned
that
earlier
too,
what
we're
doing
is
we're
trying
to
complement
what
already
exists.
So
if
you're,
for
example,
using
pi
torch,
you
should-
and
I
think
nick
had
to
slide
on
that
too.
You
should
be
able
to
pass
your
data
between
the
different
libraries
now
so
qmo
or
pytorch
with
zero
copy.
So
you
you
wouldn't
have
to
go
back
to
cpu.
B
B
E
B
E
B
So,
no,
if
you're,
using,
for
example,
pi
torch
or
tensorflow
some
of
these
frameworks
that
currently
work
with
gpu
arrays.
So
if
you
use
the
cuda
array
interface,
then
you
know
you
don't
need
to
even
convert
that
back
to
numpy
or
pandas.
You
can
directly
use
your
coupe
array
or,
for
example,
for
extra
boost.
You
can
directly
pass
your
qdf
data
frame
for
your
learning,
algorithms.
B
Okay,
so
what
I,
I
won't
really
go
through
all
the
cells
for
this
notebook,
because,
like
I
mentioned
it's
very
similar
to
the
first
one,
the
only
difference
is
this
is
logistic
regression.
So
basically
it's
a
classification
algorithm
when
it's
used
when
actually
the
dependent
variable
is
binary
but
linear,
regression
that
we
saw
earlier,
usually
the
dependent
variable
variable
and
outcome
is
continuous.
B
So
there
are
a
few
differences.
The
first
one
is
you'll
see
here
that
we're
using
coup,
which
nick
mentioned
earlier
too.
So
I
I
really
encourage
you
to
look
at
the
documentation
for
this.
It's
actually
a
really
nice
package,
it's
very
interesting
and
if
you're
already
familiar
with
numpy,
the
api
is
very
similar,
but
underneath
it's
actually
using
cuda
to
create
arrays
on
gpus
and
the
goal
of
this
notebook
is
to
deal
with
data.
That
already
exists.
B
B
And
so
when
we
set
up
our
data
similar
to
the
previous
notebook,
we'll
import
logistic
regression
in
this
case
and
then
the
main
part
is
actually
fitting
the
scikit-learn.
This
part
is
a
fitting
decide
to
learn
logistic
regression,
and
one
point
is:
this:
is
a
gpu
array.
So,
if
you're
using
a
cpu
algorithm,
you
can't
really
pass
that.
So
you
need
to
convert
it
to
an
empi
array
and
the
data
has
to
be
on
the
host.
There's
a
couple
of
ways
to
do
this.
B
B
And
so
what
we'll
do
is,
for
the
second
part,
we'll
use
qml,
logistic
regression
that
can
actually
train
models
with
coupons.
So
that's
what
we
talked
about
earlier,
that
you
don't
necessarily
have
to
convert
your
data
to
even
a
qdf
or
a
qdf
data
frame.
You
can
use
a
coupon
arrays
for
training,
these
machine
learning
algorithms
on
the
gpu,
although
the
difference
here
is
you'll
see
this
that
we
didn't
have
this
and
the
g
and
the
cpu
version,
for
example,
is
that
you
have
to
define
your
data
type
and
what
that
means
is.
B
B
I
think
this
was
actually
added
in
the
last
couple
of
releases,
but
the
only
thing
is
what
the
only
disadvantage
is
that
you'll
it'll
use
more
memory,
because
it's
doing
that
conversion
for
you
and
so
because
of
that
by
default,
it's
off.
So,
if
you
want
to
use
this,
you
can
just
use.
Convert
data
type
to
true
and
converting
the
data
manually
can
actually
be
that
optimization
step.
So
if
you
use
this,
it's
more
efficient
and
you'll
use
actually
less
memory,
gpu
memory,
and
then
we
compare
the
results
and
logistic
regression.
B
B
C
C
B
B
B
And
u
power
used
for
this,
but
essentially
what
they
do
is
model
this
in
a
higher
dimension
and
make
assumption
of
how
the
data
is
distributed
in
this
higher
dimension
and
then
the
case
of
umap.
It
actually
makes
the
assumption
that
it's
uniformly
distributed
and
a
projection
from
the
top
of
these
objects
can
project
in
a
lower
dimension
space,
and
this
is
what
we
see
when
we
we
can
think
of
it.
Like
a
shadow
of
these
dots,
hey.
C
B
So
what
we
basically
want
to
do
is
we'll
look
at
these
datasets
with
tsne
and
umap,
and
then
we'll
just
see
different
distribution
of
these
and
different
clustering
methods.
When
we
compare
the
two
so
for
the
cpu
version,
we'll
use
the
umap
learn
package
that
should
already
come
in
the
container,
if
you're,
using
that.
B
If
not,
then
you
probably
have
to
install
that
if
you're
installing
it
through
conda
and
then
what
we
did
was
we
can
create
the
object
by
selecting
the
number
of
neighbors,
which
at
some
point,
does
the
nearest
neighbor
search
and
it's
in
high
dimensional
space,
which
could
be
actually
a
hyper
parameter
to
optimize
too.
So,
if
you
want
to
run
that,
that
would
be
something
interesting
to
look
at
your
results
and
compare
them,
and
then
the
example
that
I
have
I
modified
the
number
of
neighbors
to
15.
B
B
So,
as
you
can
imagine,
it
has
to
start
from
somewhere
when
it
tries
to
calculate
how
many
different
types
of
clusters
there
are-
and
this
is
doing
an
experimental
initialization
called
spectral
use.
For
example.
In
this
case
it
uses
spectral
clustering.
So
it
took
for
me
with
the
15
number
of
neighbors.
B
So
if
you
select
this
random
state
parameter,
which
is
basically
the
seed
used
by
the
random
number
generator
during
an
initialization
and
optimization,
it
was
added
to
qml
and
the
current
release.
So
it's
actually
pretty
new.
So
in
point
13
which
matches
the
cpu
implementation,
and
what
this
will
give
you
is,
you
can
reproduce
results
so
across
different
runs.
Now
your
results
will
look
very
similar.
So
almost
the
same,
and
so
one
thing
is
one
of
the
reasons
that
I
recommend
using
this
is
for
coilml.
B
I
mentioned
that
we're
improving
performance,
adding
a
lot
of
parallelism,
but
it
sometimes
becomes
challenging
for
the
optimization
stage,
so
all
that
parallelism
might
cause
slightly
different
results
even
with
the
same
speed,
and
sometimes
it
can
impact
our
determinism
too.
So
setting
a
random
say
will
enable
this
consistency
and
will
get
similar
results.
I
think
up
to
three
digits
of
precision,
but
it
can
also
potentially
be
slower
training,
maybe
by
a
few
seconds,
and
it
can
increase
the
memory
usage
too.
B
B
D
B
C
C
C
C
A
A
A
B
B
I
just
wanted
to
share
it
with
you.
So
this
is
the
one
with
the
digits
with
the
data
set
with
the
numbers,
and
I
was
mentioning
earlier
that
if
you
run
this,
if
you
run
the
qmlu
map,
you
can
run
the
cpu
version
too.
But
basically
the
point
is
you'll
see
these
clusters
and
and
this
one
for
example,
four
and
nine
and
seven
are
in
one
cluster
and
then
another
one.
B
We
have
like
two
three
eight
and
five
that
are
similar
in
shape
and
then
for
the
second
part,
that's
also
another
data
set
and
the
difference
with
this
is
again
it's
from
mnist,
but
it's
the
fashion
data
set.
So
it's
going
to
be
very
similar.
If
you
read
through
it
and
again,
we
compared
it
with
tsne
and
then,
if
you
run
through
that,
here's
a
random
state
that
I
was
mentioning
earlier.
B
So,
and
another
thing
is,
I
mentioned
that
earlier
too,
that
I
changed
the
number
of
neighbors
here
to
15
and
rather
than
five
and
the
initial
one
so
like
I
said
this
is
another
parameter
that
you
can
modify.
You
can
run
hyper
parameter,
optimization
on
and
then
the
last
part
is
just
applying
the
trustworthiness
to
compare
the
cool,
mlu
map
and
c
cpu
umap,
and
then
the
higher
score
will
actually
indicate
that
the
gpu
implementation
is
comparable
to
the
cpu
one,
which
is
about
97,
98
percent.